
Status of HAGAR B S Acharya Tata Institute
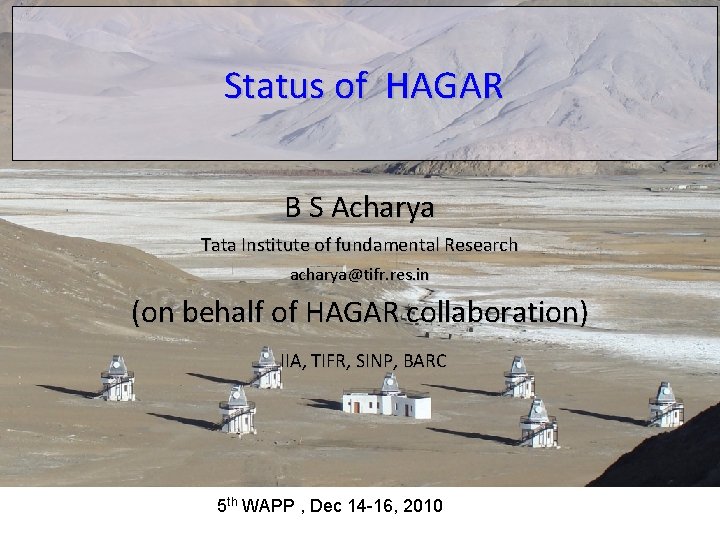
Status of HAGAR B S Acharya Tata Institute of fundamental Research acharya@tifr. res. in (on behalf of HAGAR collaboration) IIA, TIFR, SINP, BARC 5 th WAPP , Dec 14 -16, 2010
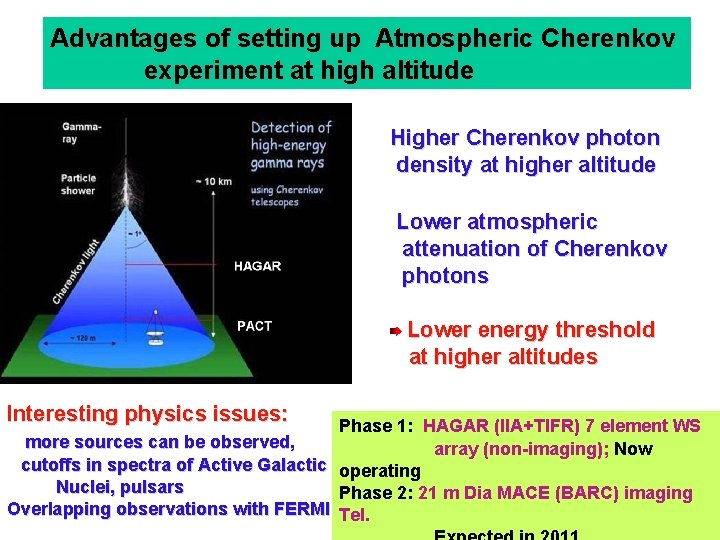
Advantages of setting up Atmospheric Cherenkov experiment at high altitude Higher Cherenkov photon density at higher altitude Lower atmospheric attenuation of Cherenkov photons Lower energy threshold at higher altitudes Interesting physics issues: more sources can be observed, Phase 1: HAGAR (IIA+TIFR) 7 element WS array (non-imaging); Now cutoffs in spectra of Active Galactic operating Nuclei, pulsars Phase 2: 21 m Dia MACE (BARC) imaging Overlapping observations with FERMI Tel.
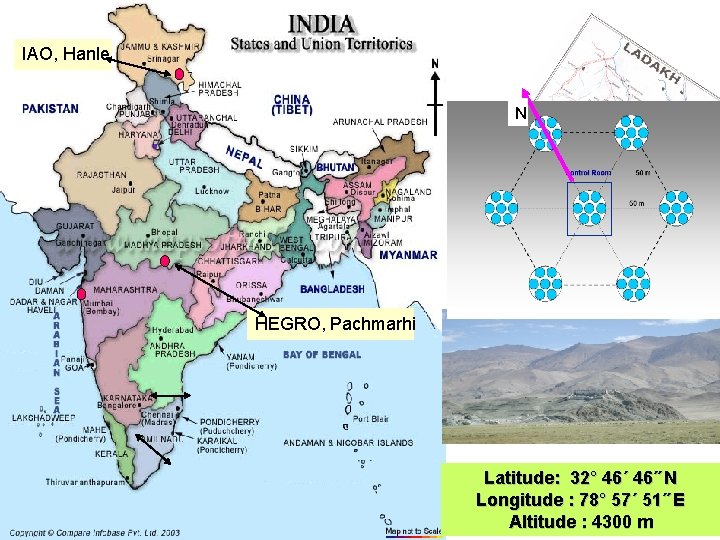
IAO, Hanle N HEGRO, Pachmarhi Latitude: 32° 46΄ 46˝ N Longitude : 78° 57΄ 51˝ E Altitude : 4300 m
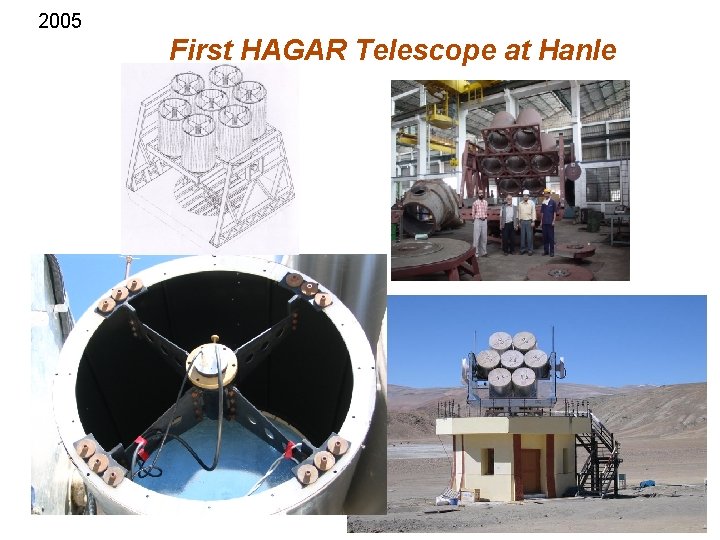
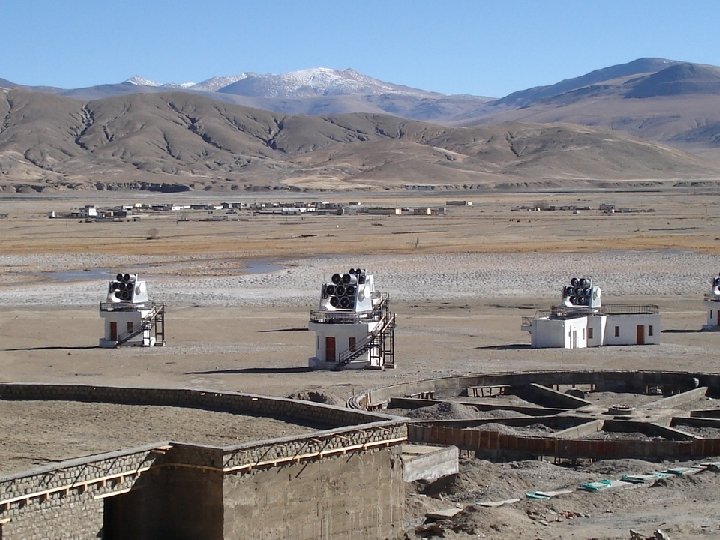
2005 First HAGAR Telescope at Hanle
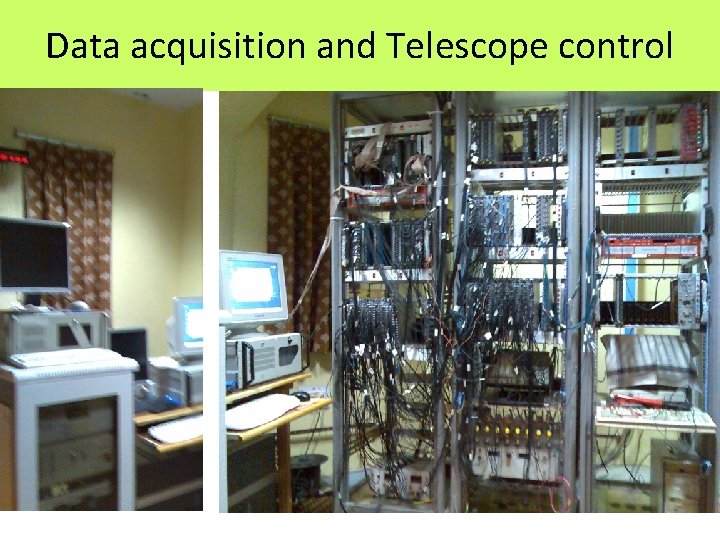
Data acquisition and Telescope control
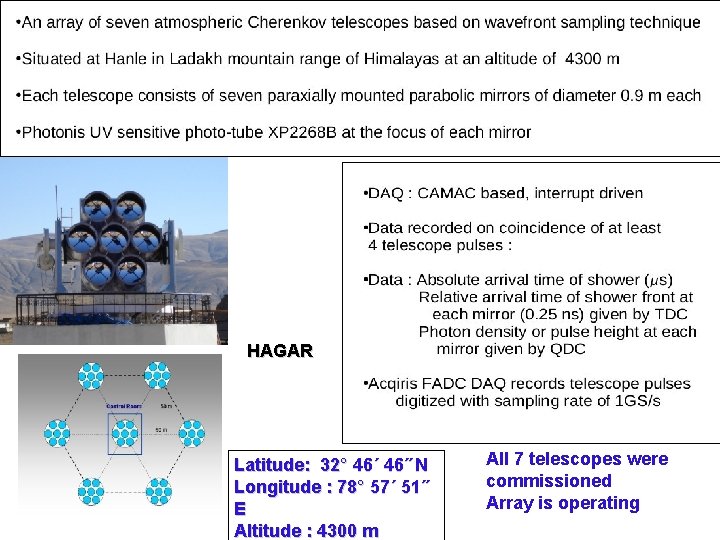
HAGAR Latitude: 32° 46΄ 46˝ N Longitude : 78° 57΄ 51˝ E Altitude : 4300 m All 7 telescopes were commissioned Array is operating
Status of HAGAR • HAGAR array was operational in Sept 2008. • After few engineering runs regular observations were started since October 2008 (Shutdown 3 months in 2008 -09, 2 months 2009 -10, aiming for 0 months in 2010 -11 onwards) • Upgrade/Modifications to various sub-systems of HAGAR were also undertaken in addition to data analysis -These upgrades were partly planned & partly from feed back from data collected. • Instrument upgrade • Calibrations (NSB monitoring, Relative Time offsets…) • Software (DAQ & Telescope control) • Data analysis methods/procedure
Instrument Development Mechanical – lid for Telescope (IIA) Alignment (vertical position & mirror orientation ) HV control- SY 1527 LC was bought Trigger system (Version 0 Version 3) Monitoring – Night Sky, Low Voltage Data acquisition system Acqiris Flash ADC parallel system, Data Format, Prog. Disc. , Delay Gen, Offset measurement Towards Automation for remote operation
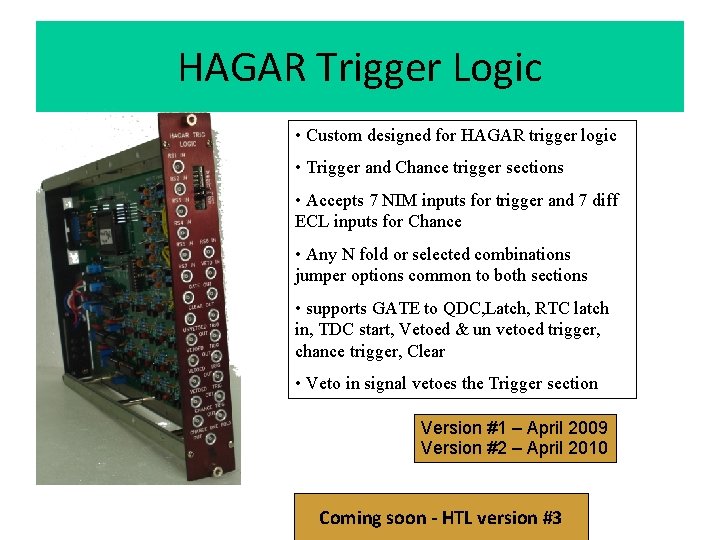
HAGAR Trigger Logic • Custom designed for HAGAR trigger logic • Trigger and Chance trigger sections • Accepts 7 NIM inputs for trigger and 7 diff ECL inputs for Chance • Any N fold or selected combinations jumper options common to both sections • supports GATE to QDC, Latch, RTC latch in, TDC start, Vetoed & un vetoed trigger, chance trigger, Clear • Veto in signal vetoes the Trigger section Version #1 – April 2009 Version #2 – April 2010 Coming soon - HTL version #3
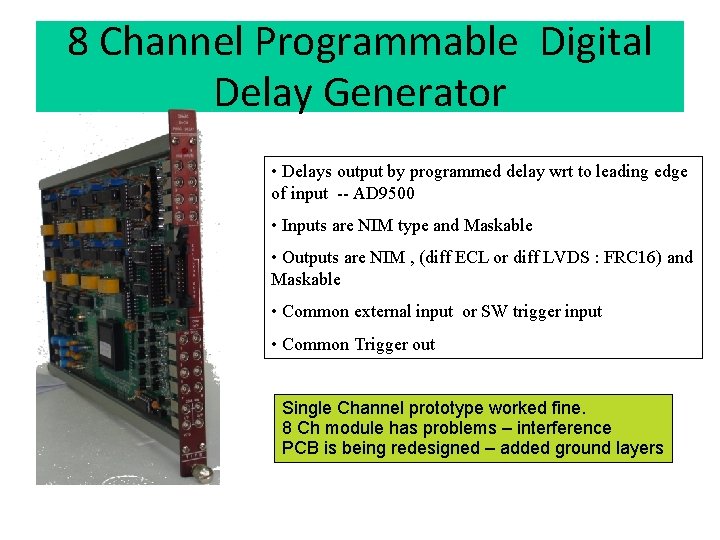
8 Channel Programmable Digital Delay Generator • Delays output by programmed delay wrt to leading edge of input -- AD 9500 • Inputs are NIM type and Maskable • Outputs are NIM , (diff ECL or diff LVDS : FRC 16) and Maskable • Common external input or SW trigger input • Common Trigger out Single Channel prototype worked fine. 8 Ch module has problems – interference PCB is being redesigned – added ground layers
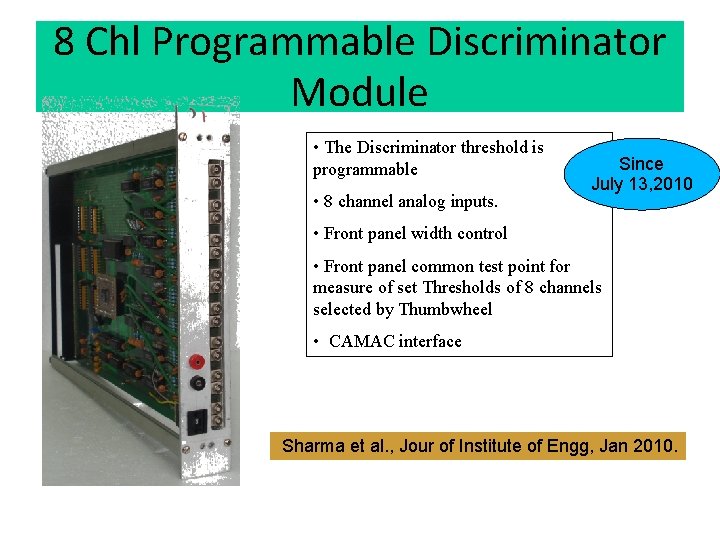
8 Chl Programmable Discriminator Module • The Discriminator threshold is programmable • 8 channel analog inputs. Since July 13, 2010 • Front panel width control • Front panel common test point for measure of set Thresholds of 8 channels selected by Thumbwheel • CAMAC interface Sharma et al. , Jour of Institute of Engg, Jan 2010.
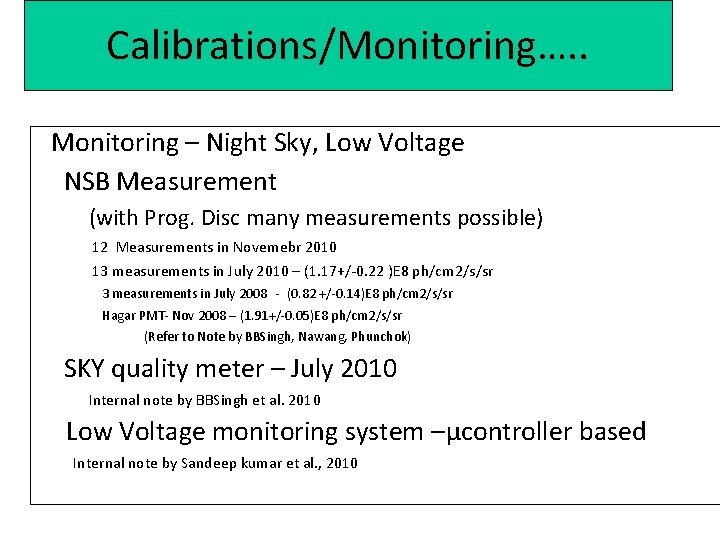
Calibrations/Monitoring…. . Monitoring – Night Sky, Low Voltage NSB Measurement (with Prog. Disc many measurements possible) 12 Measurements in Novemebr 2010 13 measurements in July 2010 – (1. 17+/-0. 22 )E 8 ph/cm 2/s/sr 3 measurements in July 2008 - (0. 82 +/-0. 14)E 8 ph/cm 2/s/sr Hagar PMT- Nov 2008 – (1. 91+/-0. 05)E 8 ph/cm 2/s/sr (Refer to Note by BBSingh, Nawang, Phunchok) SKY quality meter – July 2010 Internal note by BBSingh et al. 2010 Low Voltage monitoring system –μcontroller based Internal note by Sandeep kumar et al. , 2010
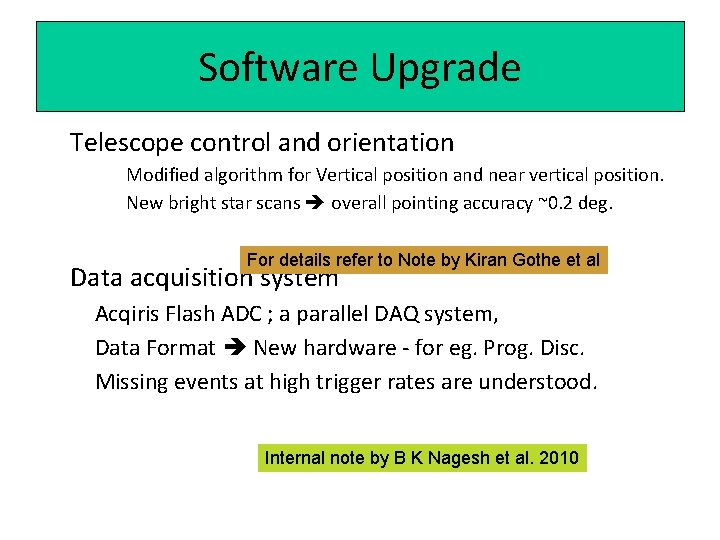
Software Upgrade Telescope control and orientation Modified algorithm for Vertical position and near vertical position. New bright star scans overall pointing accuracy ~0. 2 deg. For details refer to Note by Kiran Gothe et al Data acquisition system Acqiris Flash ADC ; a parallel DAQ system, Data Format New hardware - for eg. Prog. Disc. Missing events at high trigger rates are understood. Internal note by B K Nagesh et al. 2010
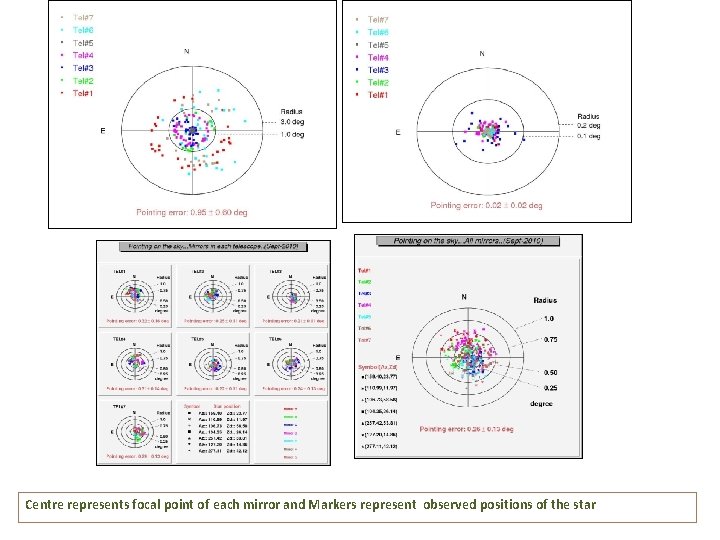
Centre represents focal point of each mirror and Markers represent observed positions of the star
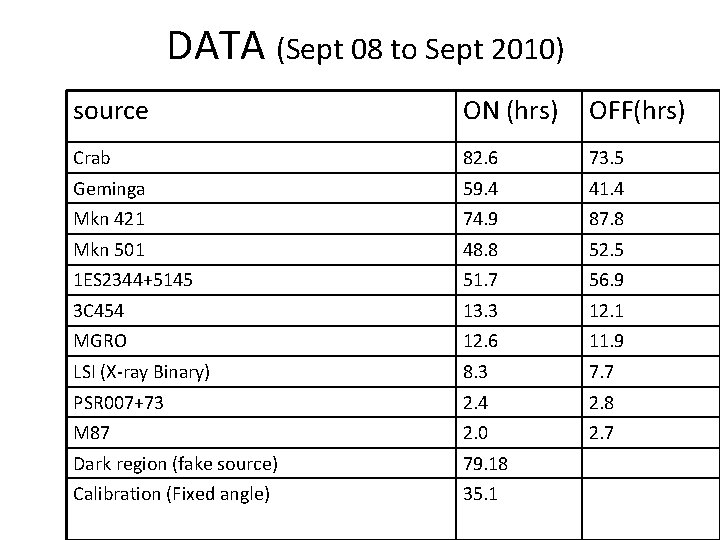
DATA (Sept 08 to Sept 2010) source ON (hrs) OFF(hrs) Crab 82. 6 73. 5 Geminga 59. 4 41. 4 Mkn 421 74. 9 87. 8 Mkn 501 48. 8 52. 5 1 ES 2344+5145 51. 7 56. 9 3 C 454 13. 3 12. 1 MGRO 12. 6 11. 9 LSI (X-ray Binary) 8. 3 7. 7 PSR 007+73 2. 4 2. 8 M 87 2. 0 2. 7 Dark region (fake source) 79. 18 Calibration (Fixed angle) 35. 1
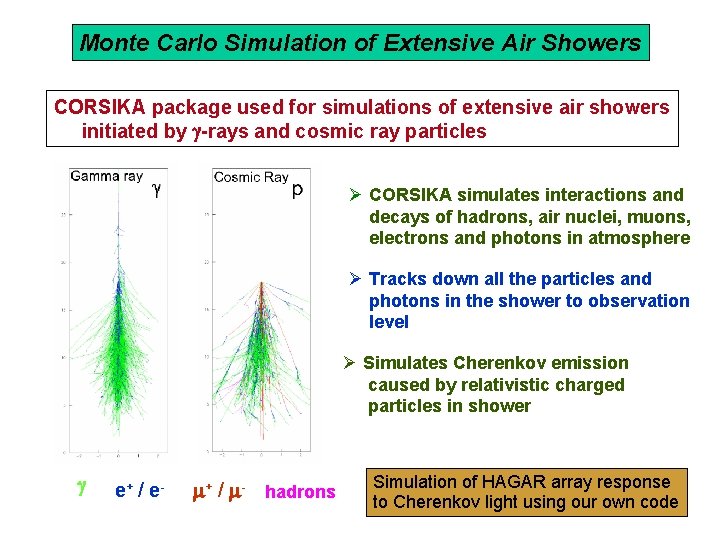
Monte Carlo Simulation of Extensive Air Showers CORSIKA package used for simulations of extensive air showers initiated by -rays and cosmic ray particles CORSIKA simulates interactions and decays of hadrons, air nuclei, muons, electrons and photons in atmosphere Tracks down all the particles and photons in the shower to observation level Simulates Cherenkov emission caused by relativistic charged particles in shower e+ / e- + / - hadrons Simulation of HAGAR array response to Cherenkov light using our own code
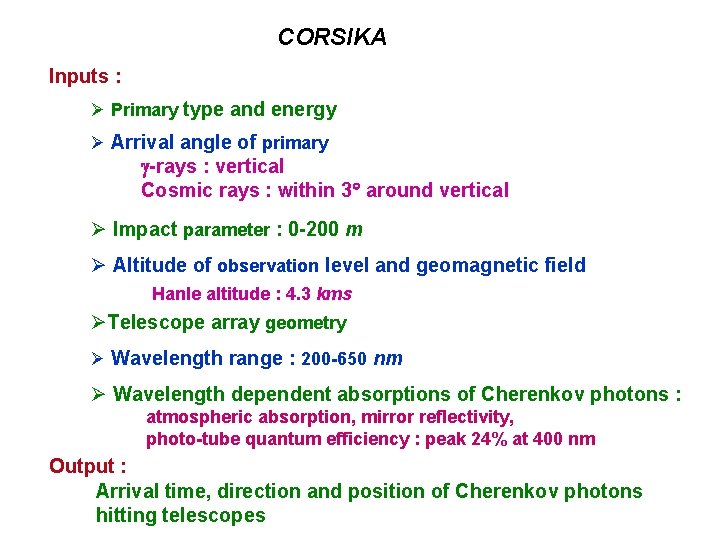
CORSIKA Inputs : Primary type and energy Arrival angle of primary -rays : vertical Cosmic rays : within 3 around vertical Impact parameter : 0 -200 m Altitude of observation level and geomagnetic field Hanle altitude : 4. 3 kms Telescope array geometry Wavelength range : 200 -650 nm Wavelength dependent absorptions of Cherenkov photons : atmospheric absorption, mirror reflectivity, photo-tube quantum efficiency : peak 24% at 400 nm Output : Arrival time, direction and position of Cherenkov photons hitting telescopes
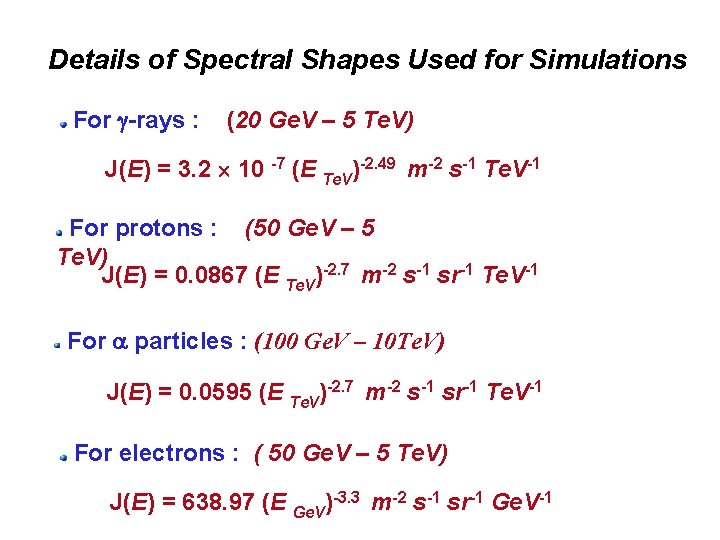
Details of Spectral Shapes Used for Simulations For -rays : (20 Ge. V – 5 Te. V) J(E) = 3. 2 10 -7 (E Te. V)-2. 49 m-2 s-1 Te. V-1 For protons : (50 Ge. V – 5 Te. V) J(E) = 0. 0867 (E Te. V)-2. 7 m-2 s-1 sr-1 Te. V-1 For particles : (100 Ge. V – 10 Te. V) J(E) = 0. 0595 (E Te. V)-2. 7 m-2 s-1 sr-1 Te. V-1 For electrons : ( 50 Ge. V – 5 Te. V) J(E) = 638. 97 (E Ge. V)-3. 3 m-2 s-1 sr-1 Ge. V-1
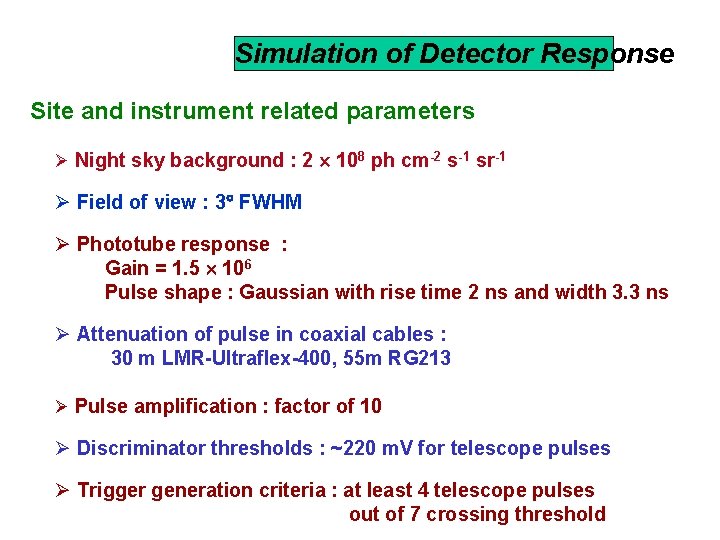
Simulation of Detector Response Site and instrument related parameters Night sky background : 2 108 ph cm-2 s-1 sr-1 Field of view : 3 FWHM Phototube response : Gain = 1. 5 106 Pulse shape : Gaussian with rise time 2 ns and width 3. 3 ns Attenuation of pulse in coaxial cables : 30 m LMR-Ultraflex-400, 55 m RG 213 Pulse amplification : factor of 10 Discriminator thresholds : ~220 m. V for telescope pulses Trigger generation criteria : at least 4 telescope pulses out of 7 crossing threshold
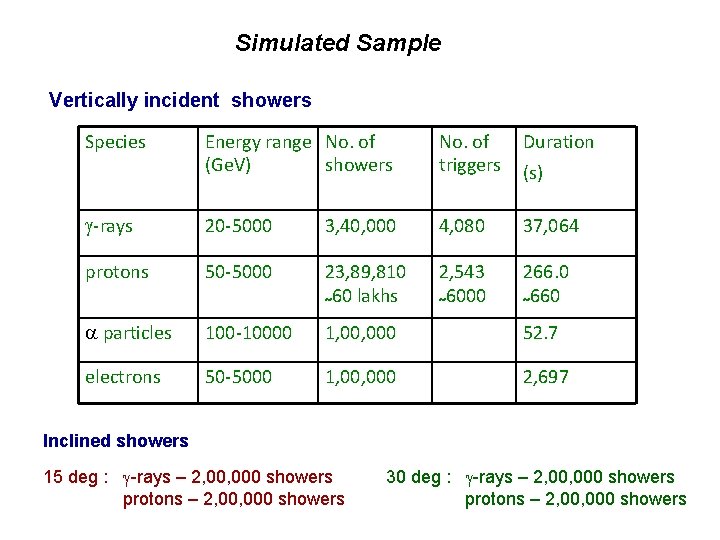
Simulated Sample Vertically incident showers Species Energy range No. of (Ge. V) showers No. of triggers Duration -rays 20 -5000 3, 40, 000 4, 080 37, 064 protons 50 -5000 23, 89, 810 ~60 lakhs 2, 543 ~6000 266. 0 ~660 a particles 100 -10000 1, 000 52. 7 electrons 50 -5000 1, 000 2, 697 (s) Inclined showers 15 deg : -rays – 2, 000 showers protons – 2, 000 showers 30 deg : -rays – 2, 000 showers protons – 2, 000 showers
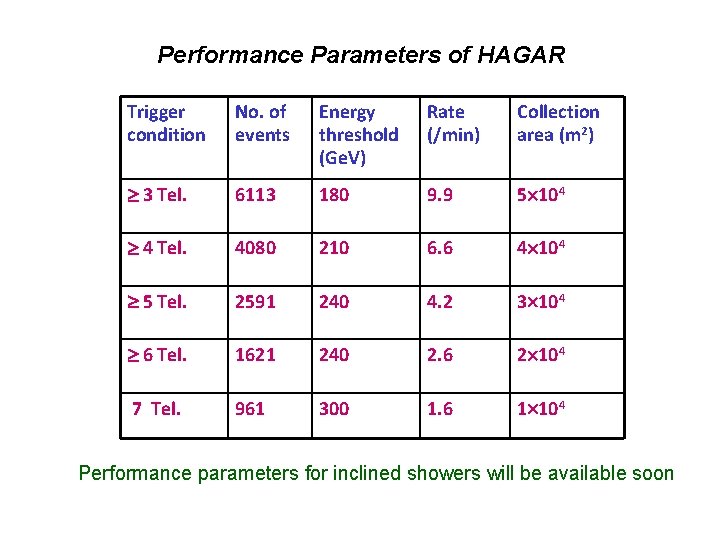
Performance Parameters of HAGAR Trigger condition No. of events Energy threshold (Ge. V) Rate (/min) Collection area (m 2) 3 Tel. 6113 180 9. 9 5 104 4 Tel. 4080 210 6. 6 4 104 5 Tel. 2591 240 4. 2 3 104 6 Tel. 1621 240 2. 6 2 104 7 Tel. 961 300 1. 6 1 104 Performance parameters for inclined showers will be available soon
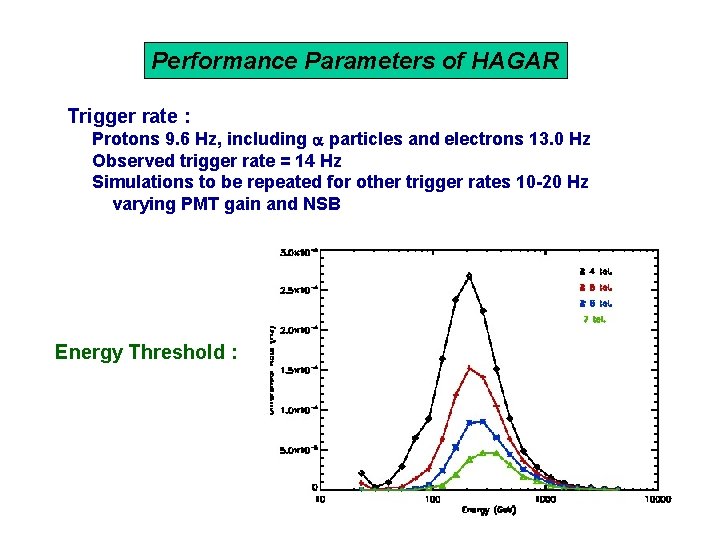
Performance Parameters of HAGAR Trigger rate : Protons 9. 6 Hz, including particles and electrons 13. 0 Hz Observed trigger rate = 14 Hz Simulations to be repeated for other trigger rates 10 -20 Hz varying PMT gain and NSB Energy Threshold :
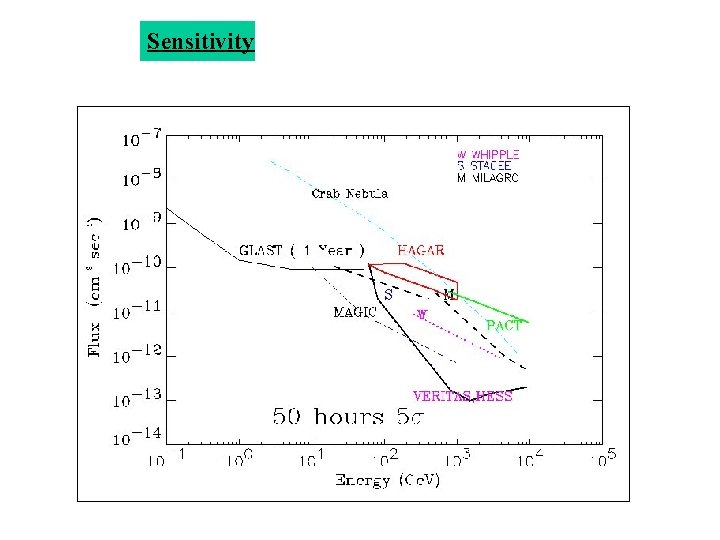
Sensitivity
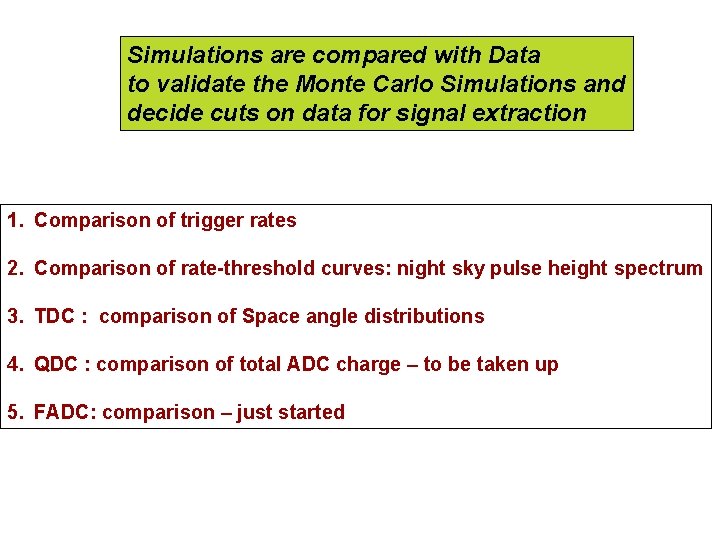
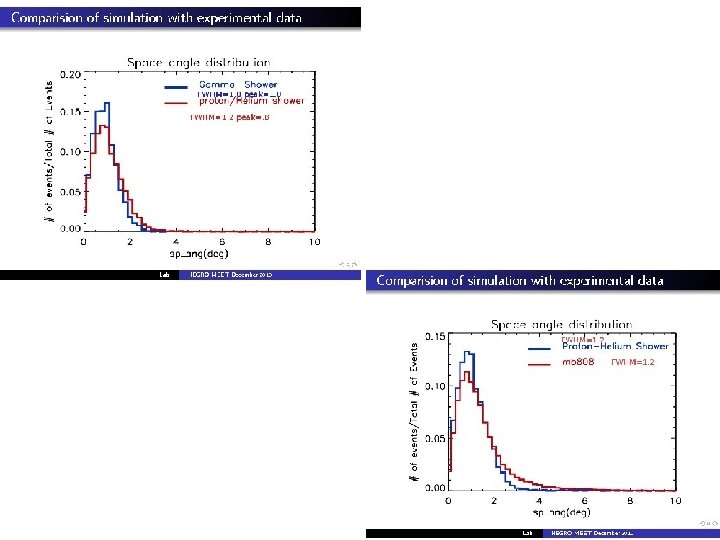
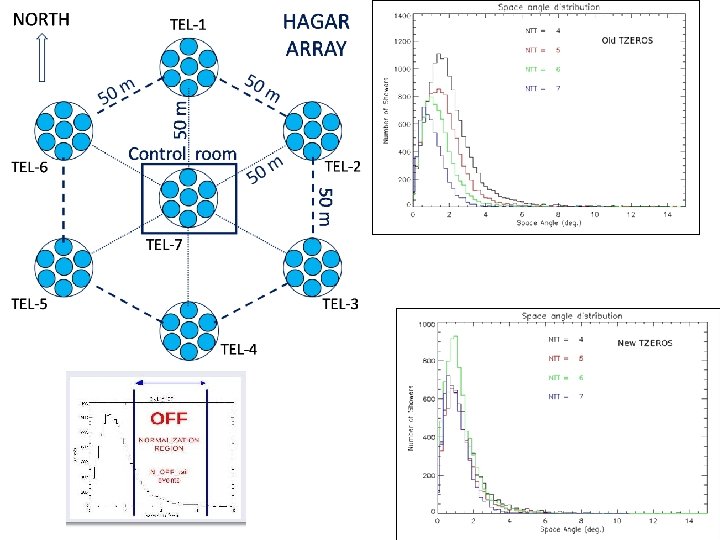
Simulations are compared with Data to validate the Monte Carlo Simulations and decide cuts on data for signal extraction 1. Comparison of trigger rates 2. Comparison of rate-threshold curves: night sky pulse height spectrum 3. TDC : comparison of Space angle distributions 4. QDC : comparison of total ADC charge – to be taken up 5. FADC: comparison – just started
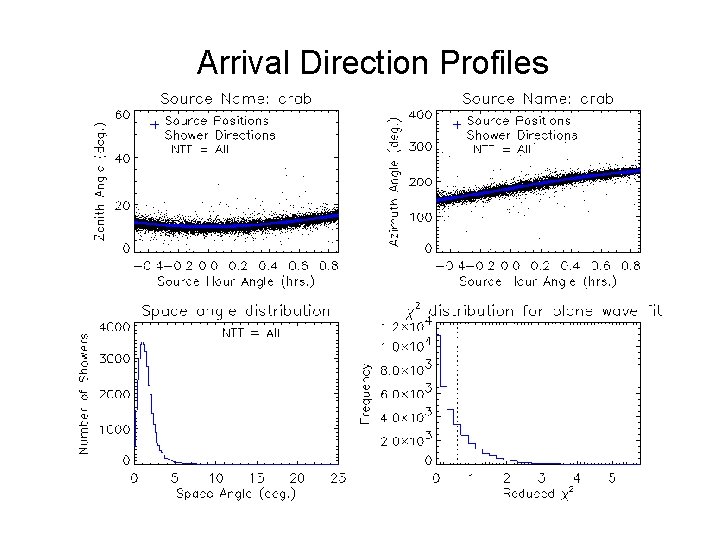
Arrival Direction Profiles
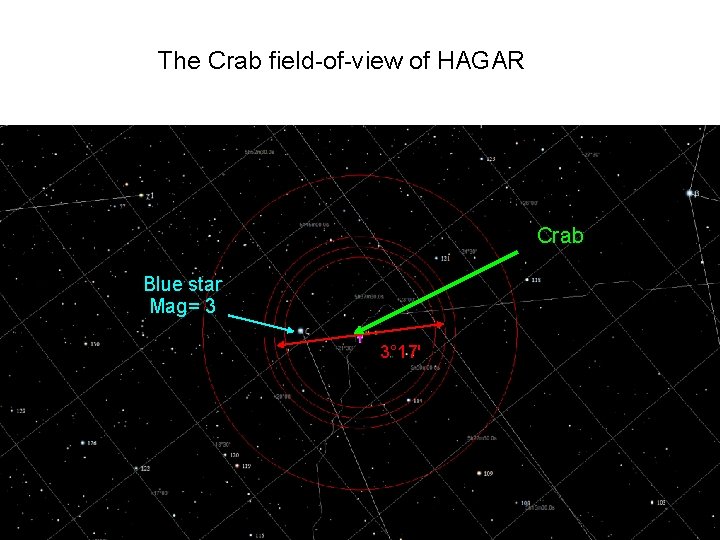
The Crab field-of-view of HAGAR Crab Blue star Mag= 3 3° 17'
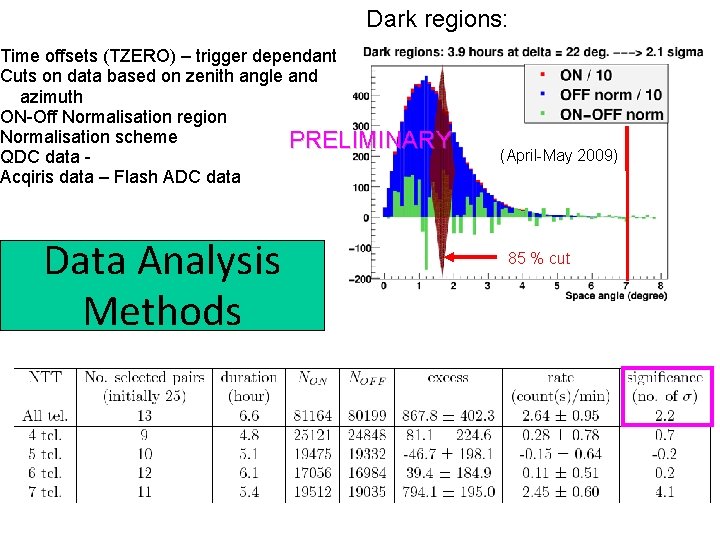
Dark regions: Time offsets (TZERO) – trigger dependant Cuts on data based on zenith angle and azimuth ON-Off Normalisation region Normalisation scheme PRELIMINARY QDC data Acqiris data – Flash ADC data Data Analysis Methods (April-May 2009) 85 % cut
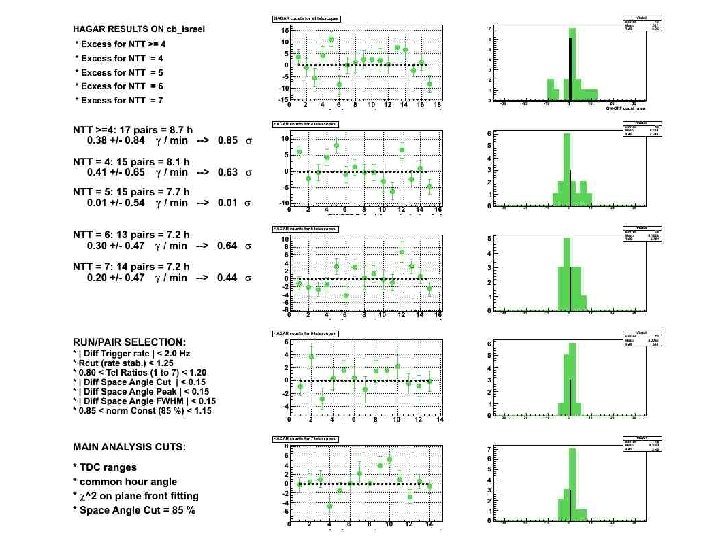
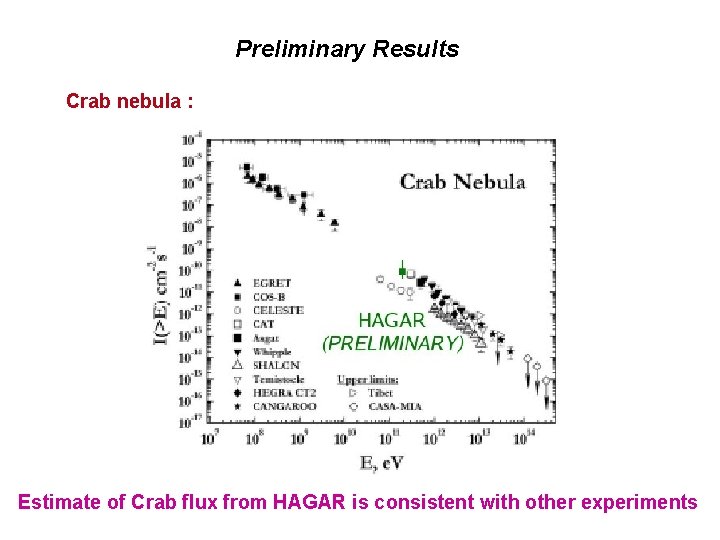
Preliminary Results Crab nebula : Estimate of Crab flux from HAGAR is consistent with other experiments
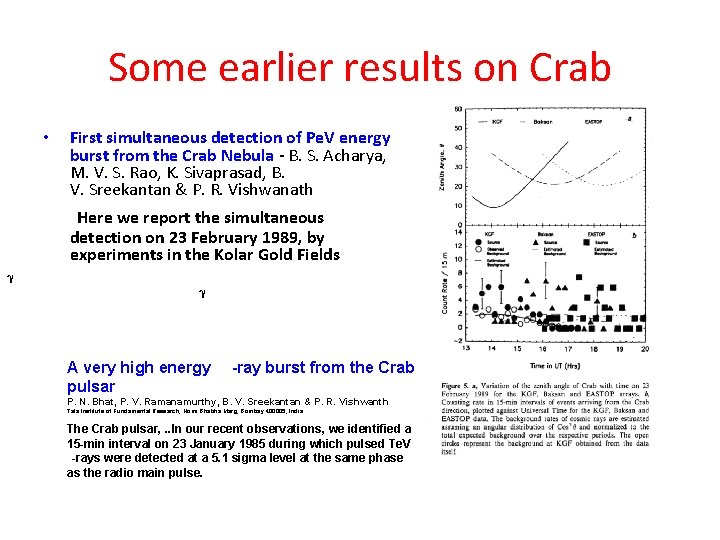
Some earlier results on Crab • First simultaneous detection of Pe. V energy burst from the Crab Nebula - B. S. Acharya, M. V. S. Rao, K. Sivaprasad, B. V. Sreekantan & P. R. Vishwanath Here we report the simultaneous detection on 23 February 1989, by experiments in the Kolar Gold Fields A very high energy -ray burst from the Crab pulsar P. N. Bhat, P. V. Ramanamurthy, B. V. Sreekantan & P. R. Vishwanth Tata Institute of Fundamental Research, Homi Bhabha Marg, Bombay 400005, India The Crab pulsar, . . In our recent observations, we identified a 15 -min interval on 23 January 1985 during which pulsed Te. V -rays were detected at a 5. 1 sigma level at the same phase as the radio main pulse.
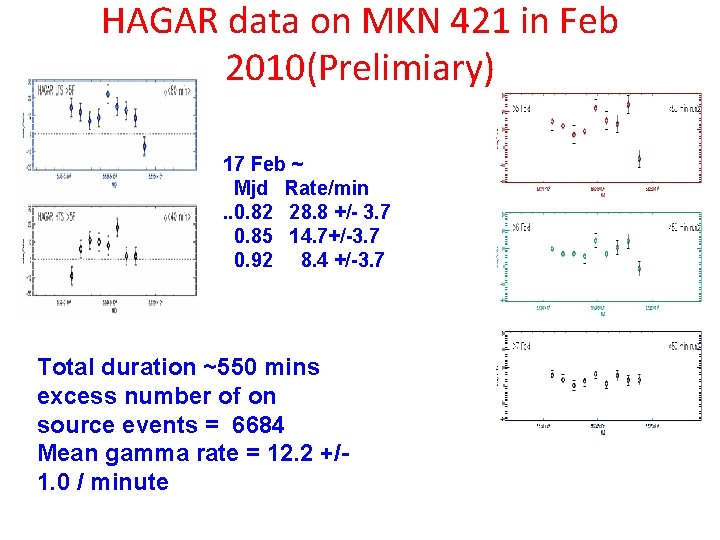
HAGAR data on MKN 421 in Feb 2010(Prelimiary) 17 Feb ~ Mjd Rate/min. . 0. 82 28. 8 +/- 3. 7 0. 85 14. 7+/-3. 7 0. 92 8. 4 +/-3. 7 Total duration ~550 mins excess number of on source events = 6684 Mean gamma rate = 12. 2 +/- 1. 0 / minute
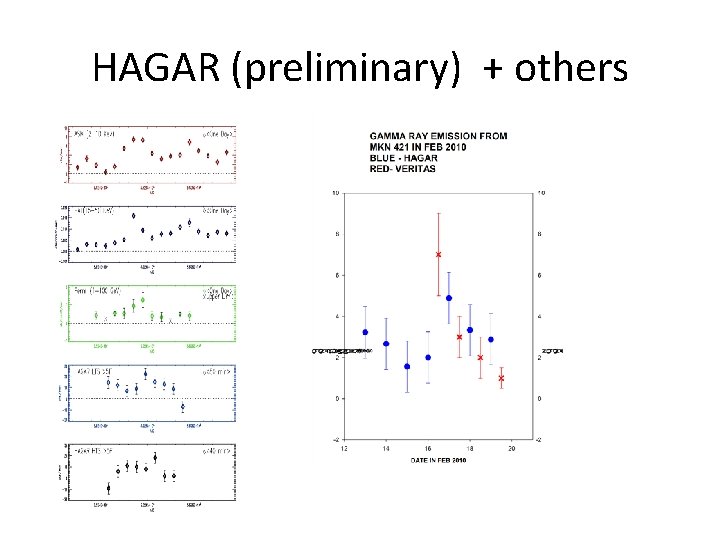
HAGAR (preliminary) + others
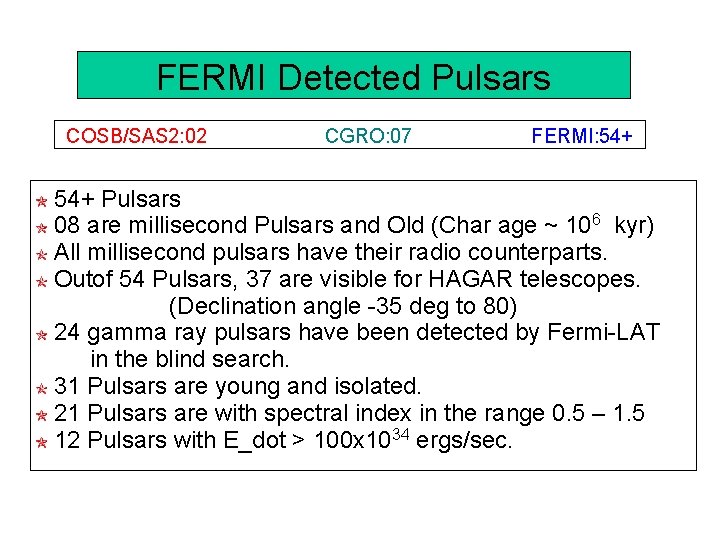
FERMI Detected Pulsars COSB/SAS 2: 02 CGRO: 07 FERMI: 54+ Pulsars 08 are millisecond Pulsars and Old (Char age ~ 106 kyr) All millisecond pulsars have their radio counterparts. Outof 54 Pulsars, 37 are visible for HAGAR telescopes. (Declination angle -35 deg to 80) 24 gamma ray pulsars have been detected by Fermi-LAT in the blind search. 31 Pulsars are young and isolated. 21 Pulsars are with spectral index in the range 0. 5 – 1. 5 12 Pulsars with E_dot > 100 x 1034 ergs/sec.
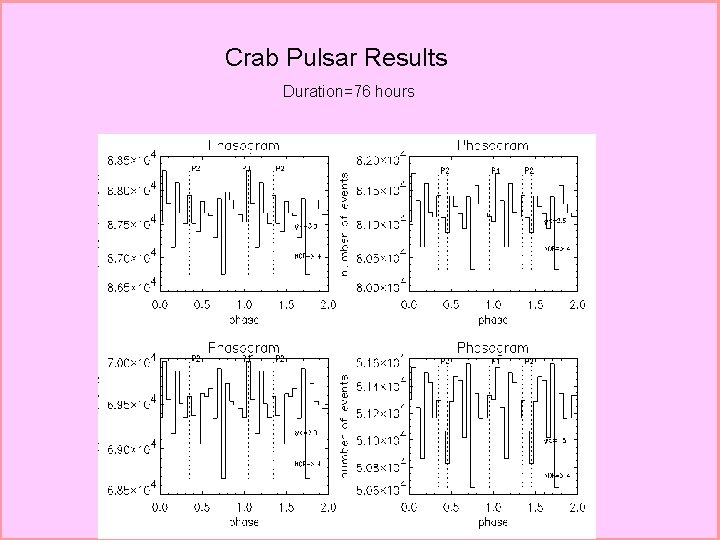
Crab Pulsar Results Duration=76 hours
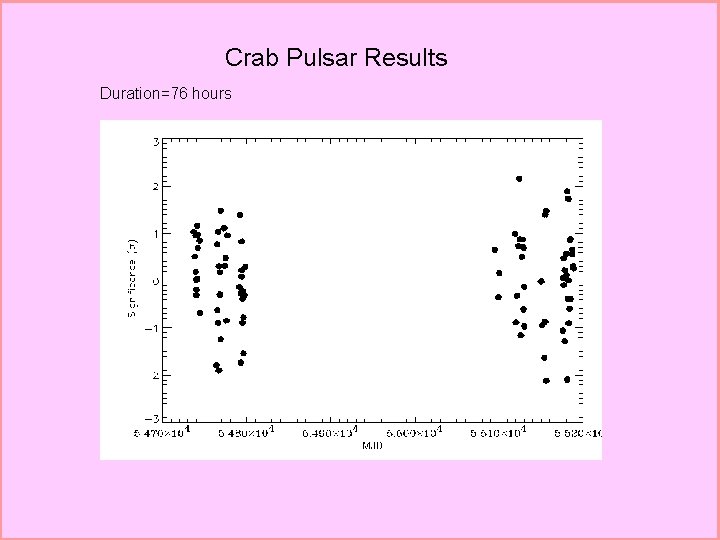
Crab Pulsar Results Duration=76 hours
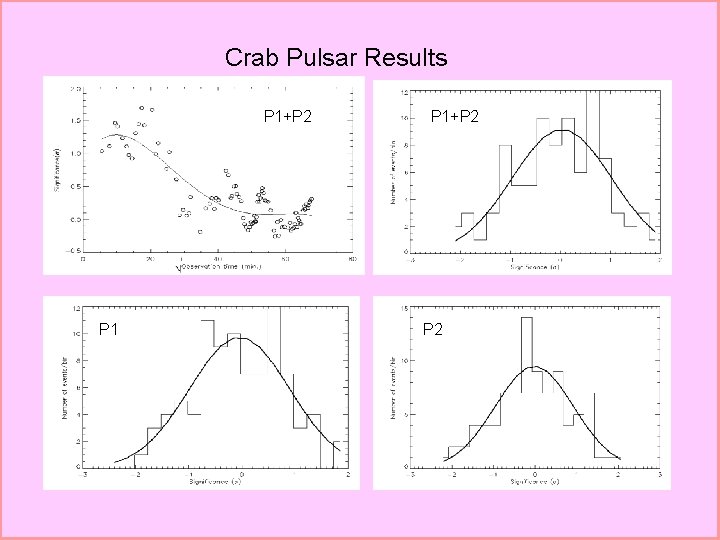
Crab Pulsar Results P 1+P 2
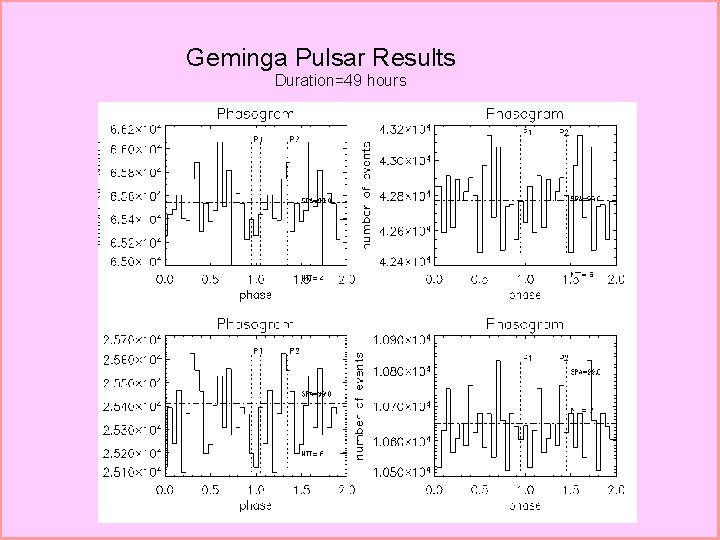
Geminga Pulsar Results Duration=49 hours
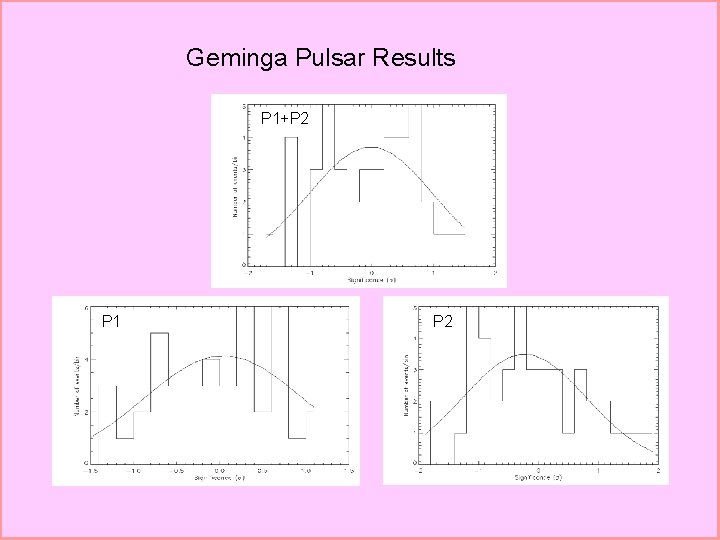
Geminga Pulsar Results P 1+P 2 P 1 P 2
Pair selection along with run selection More accuracy in data selection Doing space angle analysis after HA selection only Rejection factor known → efficiency of our cuts Not “disturbed” by bad events which are not in the common HA range Easier to compare with simulation BUT: - Hardware threshold different in ON and OFF - How to balance changes in HV → gains of PMTs. . . ?
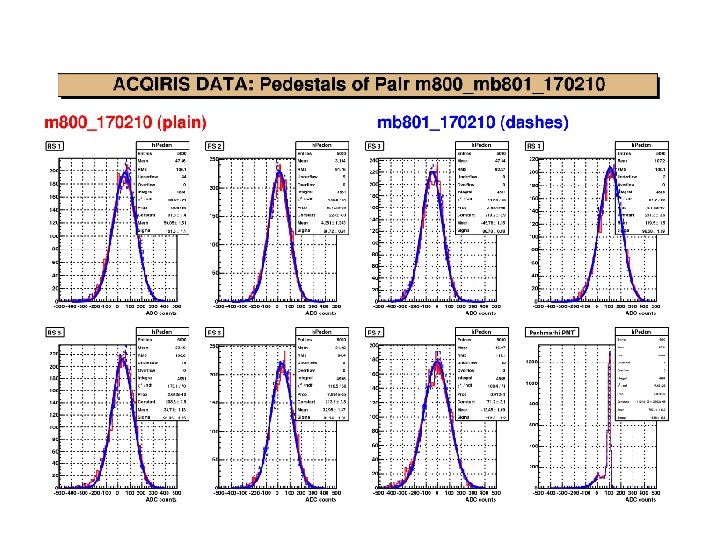
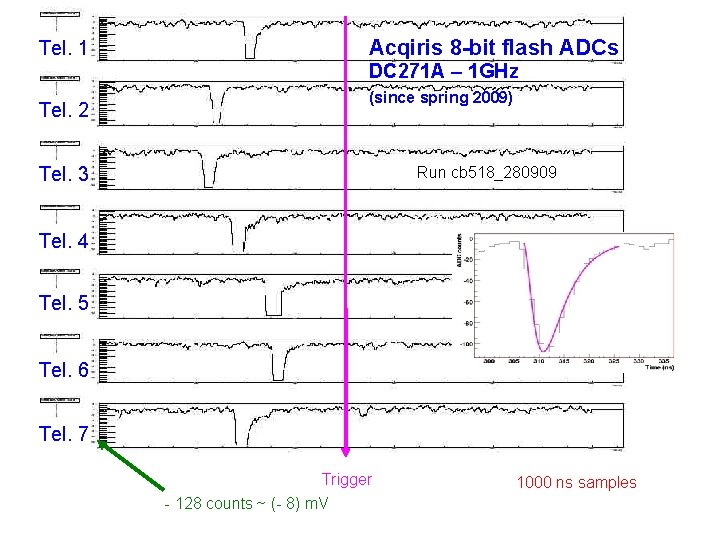
Tel. 1 Acqiris 8 -bit flash ADCs DC 271 A – 1 GHz Tel. 2 (since spring 2009) Tel. 3 Run cb 518_280909 Tel. 4 DC 271 A – 1 GHz) Tel. 5 Tel. 6 Tel. 7 Trigger - 128 counts ~ (- 8) m. V 1000 ns samples
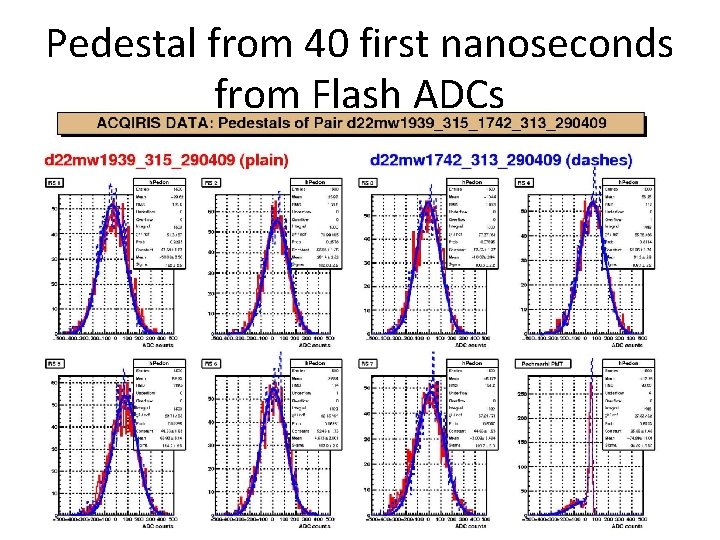
Pedestal from 40 first nanoseconds from Flash ADCs
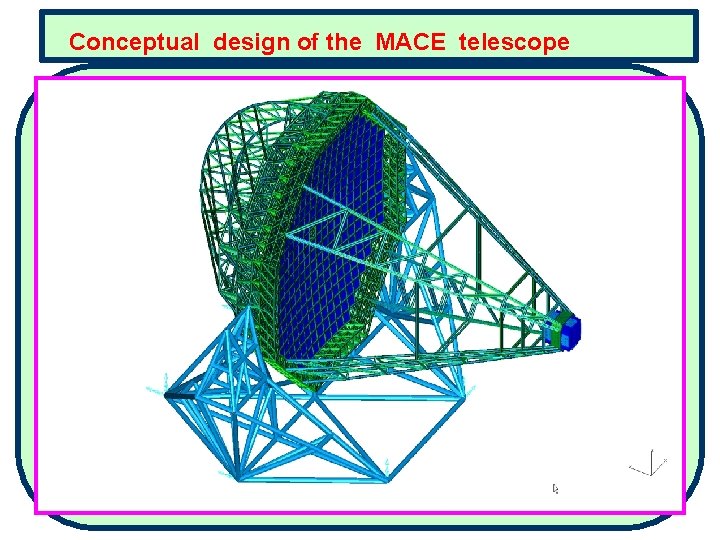
Conceptual design of the MACE telescope
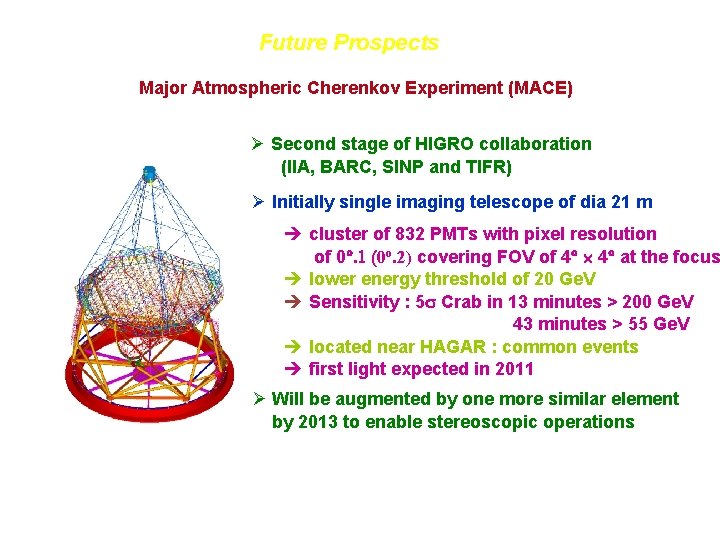
Future Prospects Major Atmospheric Cherenkov Experiment (MACE) Second stage of HIGRO collaboration (IIA, BARC, SINP and TIFR) Initially single imaging telescope of dia 21 m cluster of 832 PMTs with pixel resolution of 0. 1 (0 o. 2) covering FOV of 4 4 at the focus lower energy threshold of 20 Ge. V Sensitivity : 5 Crab in 13 minutes > 200 Ge. V 43 minutes > 55 Ge. V located near HAGAR : common events first light expected in 2011 Will be augmented by one more similar element by 2013 to enable stereoscopic operations
MACE Simulations Preliminary Results Nilay Bhatt on behalf of Simulation Team : • Abhas Mitra • Subir Bhattacharyya • Nilay Bhatt Astrophysical Sciences Division BARC, Mumbai HIGRO Collaboration Meeting, 01 – 03 December 2010
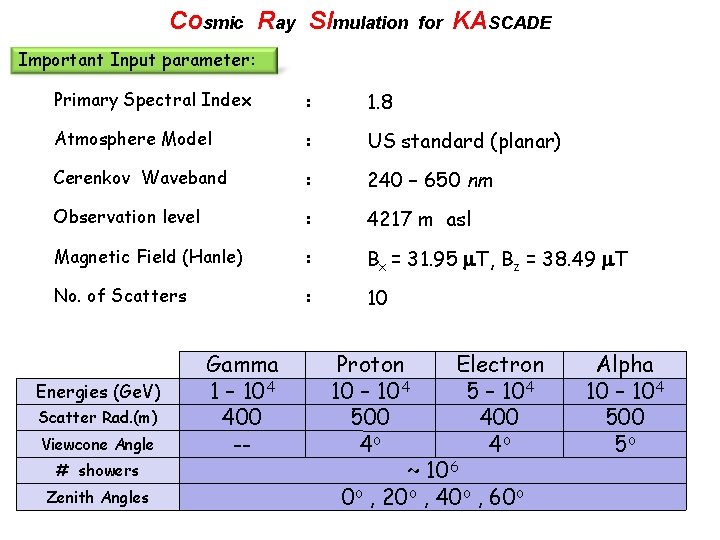
Cosmic Ray SImulation for KASCADE Important Input parameter: Primary Spectral Index : 1. 8 Atmosphere Model : US standard (planar) Cerenkov Waveband : 240 – 650 nm Observation level : 4217 m asl Magnetic Field (Hanle) : Bx = 31. 95 T, Bz = 38. 49 T No. of Scatters : 10 Energies (Ge. V) Scatter Rad. (m) Viewcone Angle # showers Zenith Angles Gamma 1 – 104 400 -- Proton Electron 10 – 104 500 4 o 4 o ~ 106 0 o , 20 o , 40 o , 60 o Alpha 10 – 104 500 5 o
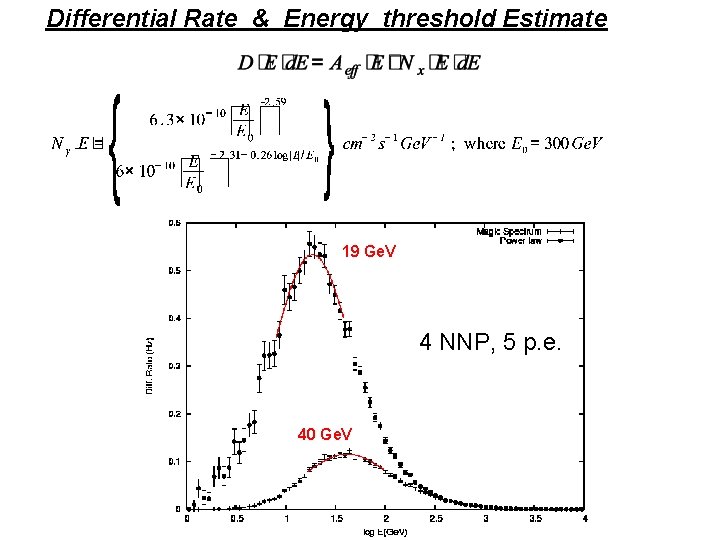
Differential Rate & Energy threshold Estimate 19 Ge. V 4 NNP, 5 p. e. 40 Ge. V
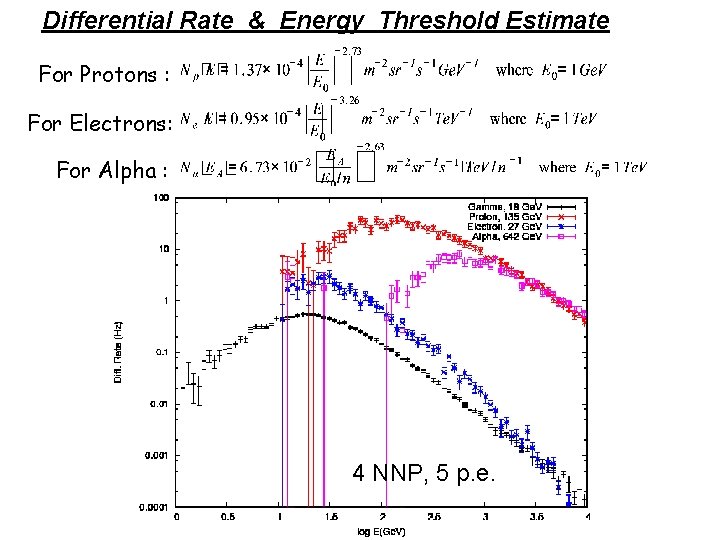
Differential Rate & Energy Threshold Estimate For Protons : For Electrons: For Alpha : 4 NNP, 5 p. e.
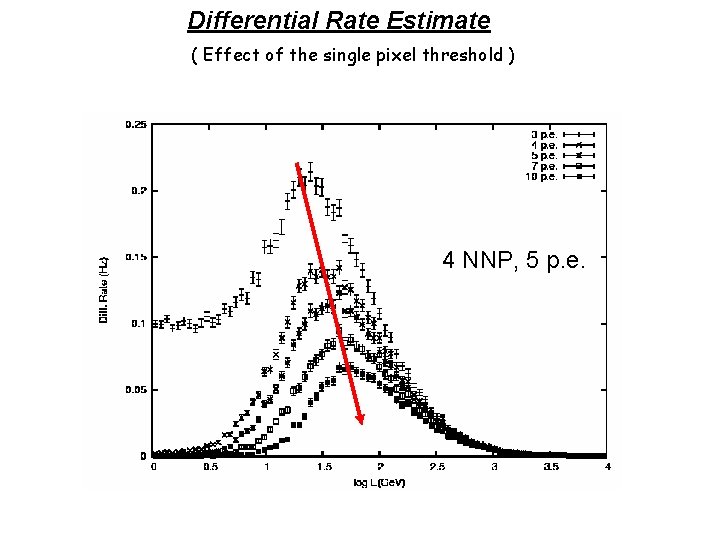
Differential Rate Estimate ( Effect of the single pixel threshold ) 4 NNP, 5 p. e.
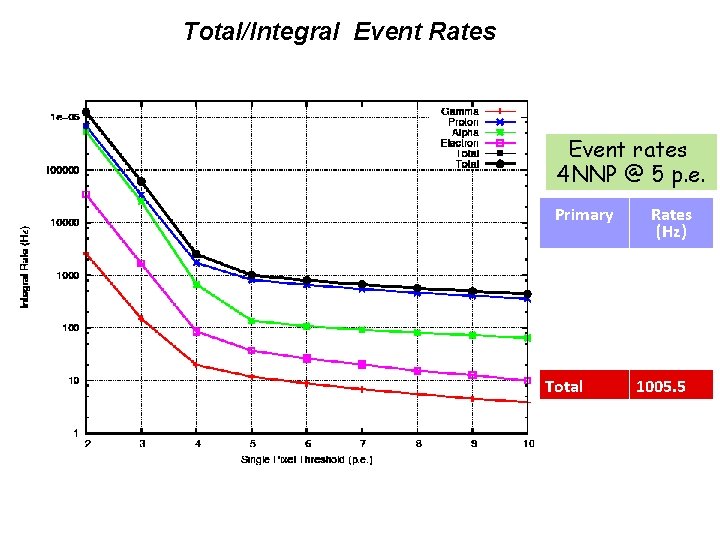
Total/Integral Event Rates Event rates 4 NNP @ 5 p. e. Primary Rates (Hz) Gamma 11. 86 Electron 37. 13 Alpha 137. 7 Proton 818. 8 Total 1005. 5
Thank you
- Slides: 56