
Stats 95 Two Branches Of Statistics Descriptive Inferential
Stats 95

Two Branches Of Statistics Descriptive Inferential • Organize • Summarize • Communicate … a body of observed data • Describe a Population or a Sample • Using sample data to make estimates of the rest of the population • Can infer only from a Sample to the Population
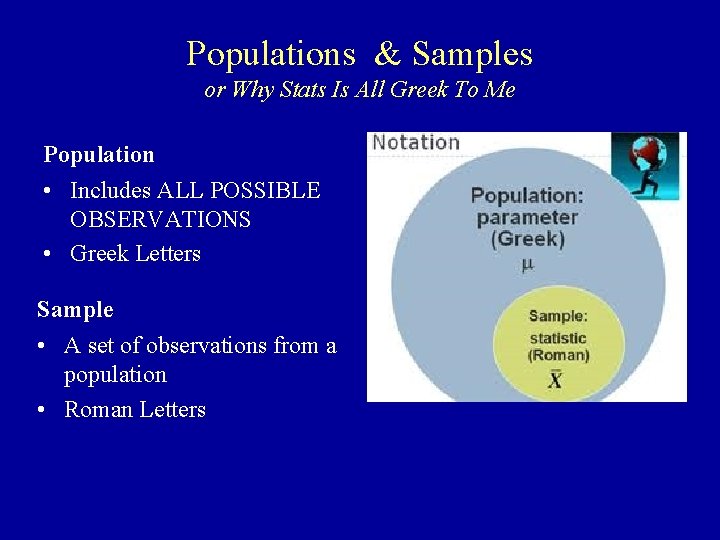
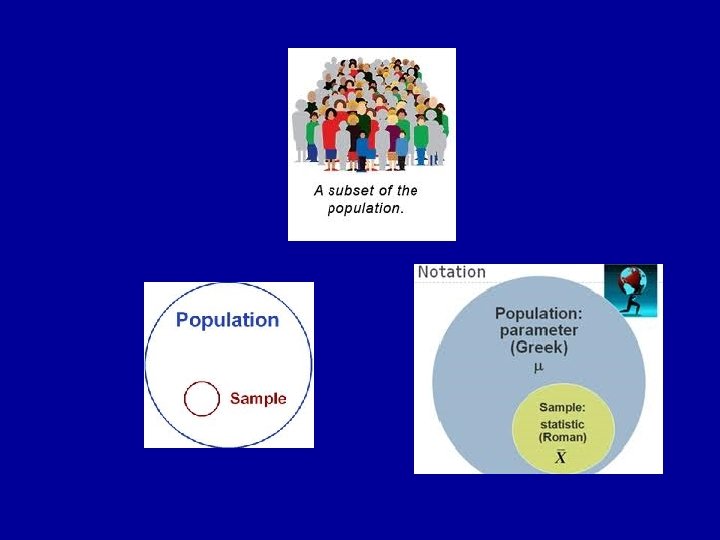
Populations & Samples or Why Stats Is All Greek To Me Population • Includes ALL POSSIBLE OBSERVATIONS • Greek Letters Sample • A set of observations from a population • Roman Letters
Data & Experimental Variables • Data Variables: Types of Data • Experimental Variables – – Independent Variable Dependent Variable Extraneous Variables Confounding Variable • Vary systematically with Independent Variable • E. g. , Income & Health, very often wealthy people are the healthy ones • Can (usually) solve by good design or by limiting scope of conclusion, or controlling statistically • http: //stattrek. com/experiments/experimental-design. aspx

Types of Variables: Overview Categorical nominal ordinal Quantitative Interval (Discrete or Continuous) Ratio (Discrete or Continuous)
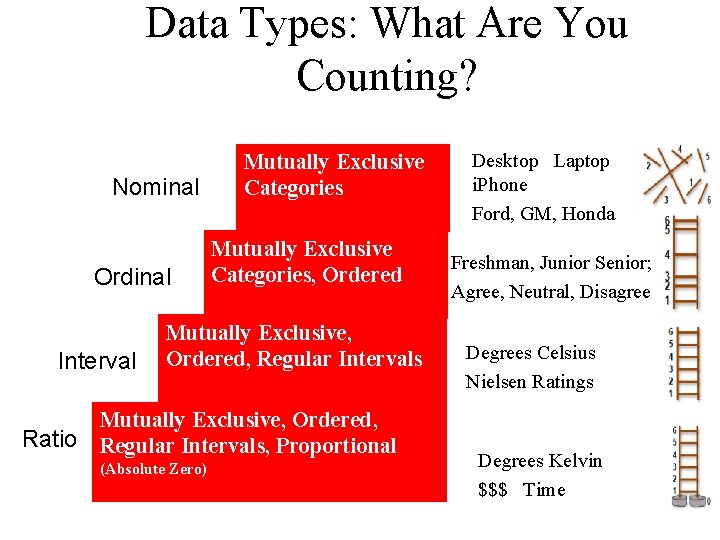
Data Types: What Are You Counting? Nominal Ordinal Interval Ratio Mutually Exclusive Categories, Ordered Mutually Exclusive, Ordered, Regular Intervals, Proportional (Absolute Zero) Desktop Laptop i. Phone Ford, GM, Honda Freshman, Junior Senior; Agree, Neutral, Disagree Degrees Celsius Nielsen Ratings Degrees Kelvin $$$ Time
Clinical Data Example • 1. Kline et al. (2002) – The researchers analyzed data from 934 emergency room patients with suspected pulmonary embolism (PE). Only about 1 in 5 actually had PE. The researchers wanted to know what clinical factors predicted PE. – I will use four variables from their dataset today: • • Pulmonary embolism (yes/no) Age (years) Shock index = heart rate/systolic BP Shock index categories = take shock index and divide it into 10 groups (lowest to highest shock index)
Categorical Variables • Nominal variables – Named categories Order doesn’t matter! • The blood type of a patient (O, A, B, AB) • Marital status • Occupation
Categorical Variables • Ordinal variable – Ordered categories. Order matters! • • • Staging in breast cancer as I, III, or IV Birth order— 1 st, 2 nd, 3 rd, etc. Letter grades (A, B, C, D, F) Ratings on a scale from 1 -5 Ratings on: always; usually; many times; once in a while; almost never; never • Age in categories (10 -20, 20 -30, etc. ) • Shock index categories (Kline et al. )
Quantitative Variables • Discrete Numbers – a limited set of distinct values, i. e. , whole numbers. • Number of new AIDS cases in CA in a year (counts) (ratio/interval) • Years of school completed (ratio) • The number of children in the family (cannot have a half a child!) (ratio) • The number of deaths in a defined time period (cannot have a partial death!) (ratio) • Roll of a die (Interval)
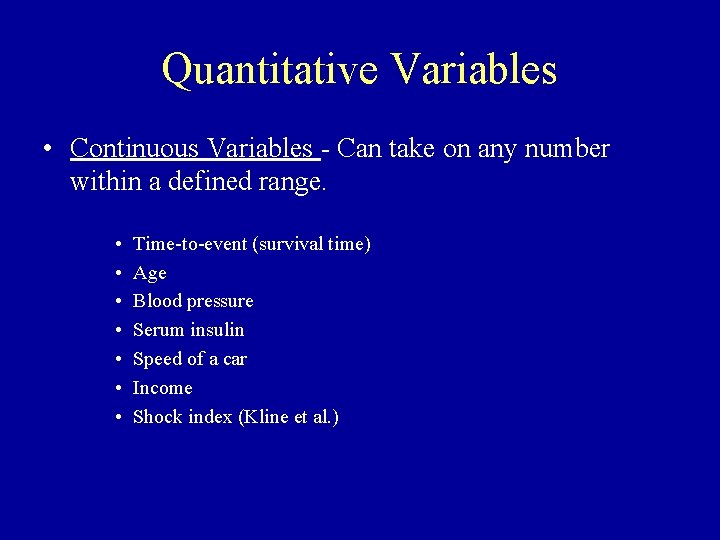
Quantitative Variables • Continuous Variables - Can take on any number within a defined range. • • Time-to-event (survival time) Age Blood pressure Serum insulin Speed of a car Income Shock index (Kline et al. )
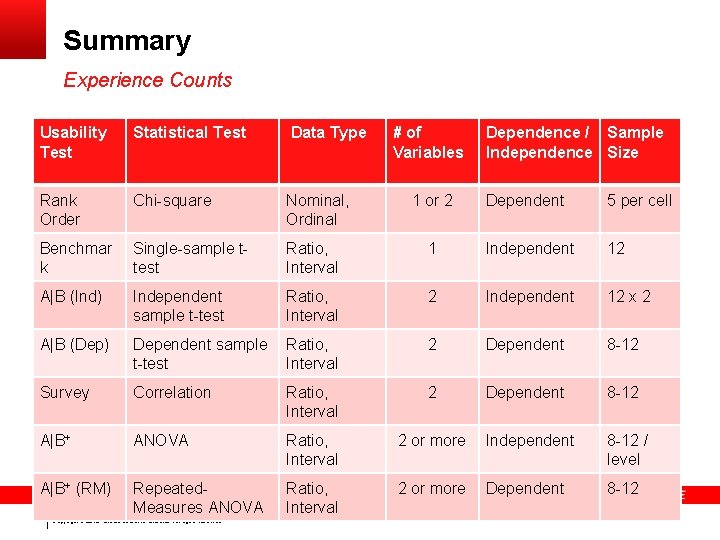
Summary Experience Counts Usability Test Statistical Test Data Type Rank Order Chi-square Nominal, Ordinal Benchmar k Single-sample ttest Ratio, Interval A|B (Ind) Independent sample t-test A|B (Dep) # of Variables Dependent 5 per cell 1 Independent 12 Ratio, Interval 2 Independent 12 x 2 Dependent sample t-test Ratio, Interval 2 Dependent 8 -12 Survey Correlation Ratio, Interval 2 Dependent 8 -12 A|B+ ANOVA Ratio, Interval 2 or more Independent 8 -12 / level A|B+ (RM) Repeated. Measures ANOVA Ratio, Interval 2 or more Dependent 8 -12 12 Copyright © 2013, Oracle and/or its affiliates. All rights reserved. 1 or 2 Dependence / Sample Independence Size
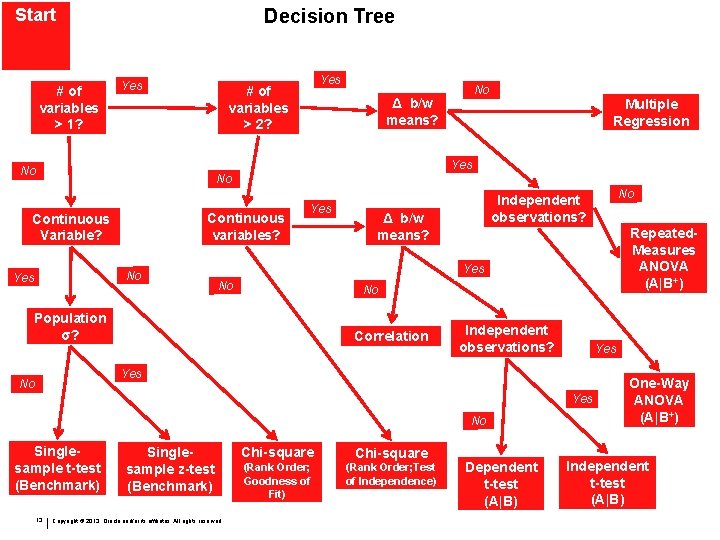
Decision Tree Start # of variables > 1? Yes # of variables > 2? No Δ b/w means? Multiple Regression Yes No No Continuous variables? Continuous Variable? No Yes Δ b/w means? Repeated. Measures ANOVA (A|B+) Yes No No Population σ? Correlation Independent observations? Yes No Singlesample t-test (Benchmark) 13 No Independent observations? Singlesample z-test (Benchmark) Copyright © 2013, Oracle and/or its affiliates. All rights reserved. Chi-square (Rank Order; Goodness of Fit) (Rank Order; Test of Independence) Dependent t-test (A|B) One-Way ANOVA (A|B+) Independent t-test (A|B)
The End • Next week: Bring a Bag of Chocolate Chip Cookies! • Back Up Slides
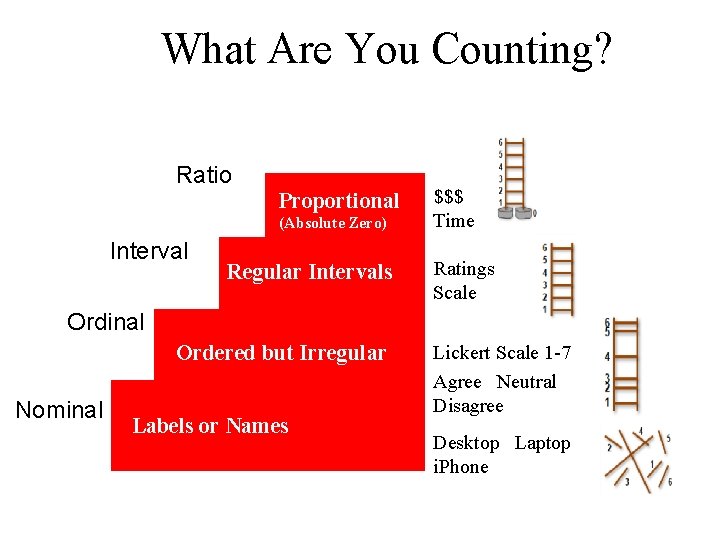
What Are You Counting? • Types of Data (“Quantitative Variables”) Ratio Proportional (Absolute Zero) Interval Regular Intervals $$$ Time Ratings Scale Ordinal Ordered but Irregular Nominal Labels or Names Lickert Scale 1 -7 Agree Neutral Disagree Desktop Laptop i. Phone
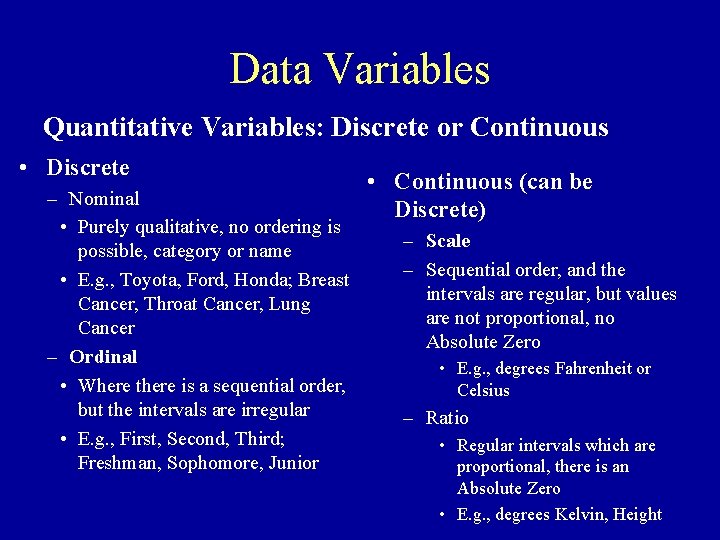
Data Variables Quantitative Variables: Discrete or Continuous • Discrete – Nominal • Purely qualitative, no ordering is possible, category or name • E. g. , Toyota, Ford, Honda; Breast Cancer, Throat Cancer, Lung Cancer – Ordinal • Where there is a sequential order, but the intervals are irregular • E. g. , First, Second, Third; Freshman, Sophomore, Junior • Continuous (can be Discrete) – Scale – Sequential order, and the intervals are regular, but values are not proportional, no Absolute Zero • E. g. , degrees Fahrenheit or Celsius – Ratio • Regular intervals which are proportional, there is an Absolute Zero • E. g. , degrees Kelvin, Height
Where Does Data Come From? • • • Case Studies Experiments Naturalistic / quasi-experimental Longitudinal Cross-sectional Surveys
The Science of Observation • Theory: Statement of relationship – Amongst events otherwise unrelated – For which there is already supportive data (a theory is more than an idea) • Hypothesis: Statement of possible relationship between variables which follow logically (but sometimes unexpectedly!) from theory
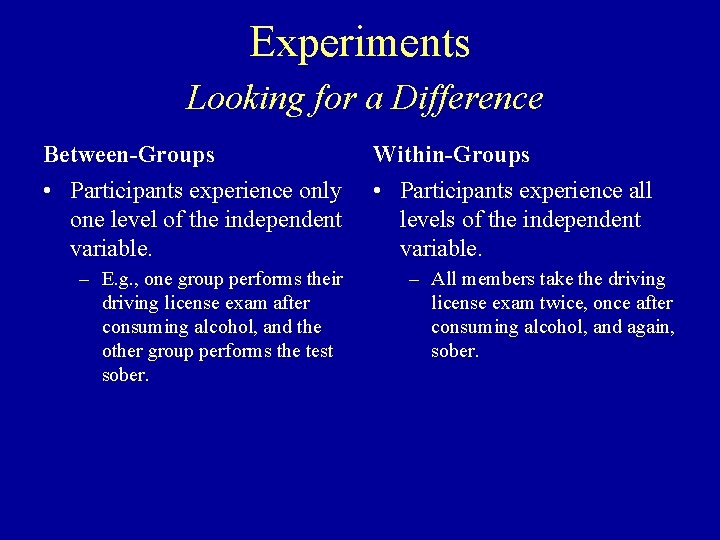
Experiments Looking for a Difference Between-Groups Within-Groups • Participants experience only one level of the independent variable. • Participants experience all levels of the independent variable. – E. g. , one group performs their driving license exam after consuming alcohol, and the other group performs the test sober. – All members take the driving license exam twice, once after consuming alcohol, and again, sober.
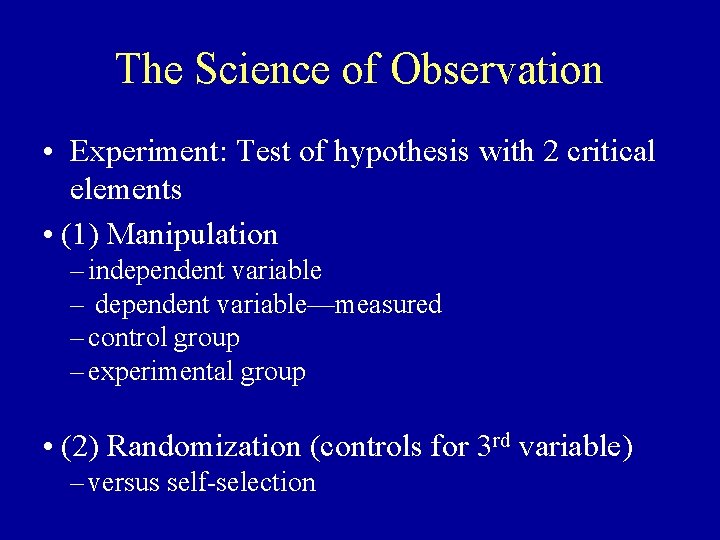
The Science of Observation • Experiment: Test of hypothesis with 2 critical elements • (1) Manipulation – independent variable – dependent variable—measured – control group – experimental group • (2) Randomization (controls for 3 rd variable) – versus self-selection
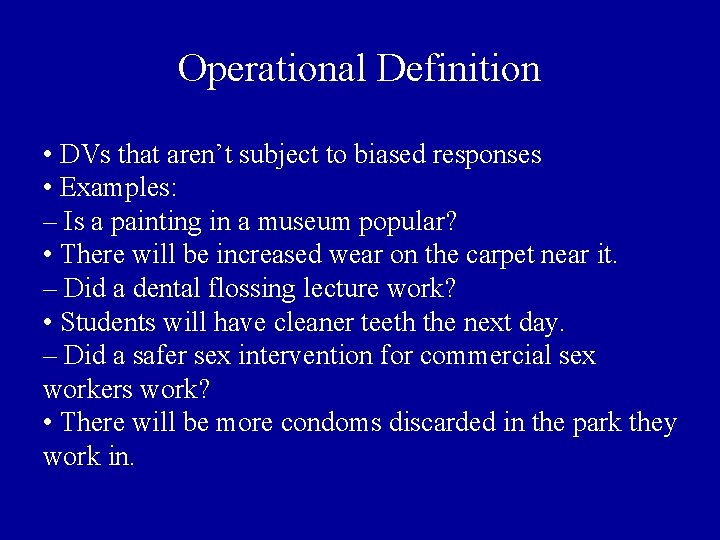
Operational Definition • DVs that aren’t subject to biased responses • Examples: – Is a painting in a museum popular? • There will be increased wear on the carpet near it. – Did a dental flossing lecture work? • Students will have cleaner teeth the next day. – Did a safer sex intervention for commercial sex workers work? • There will be more condoms discarded in the park they work in.
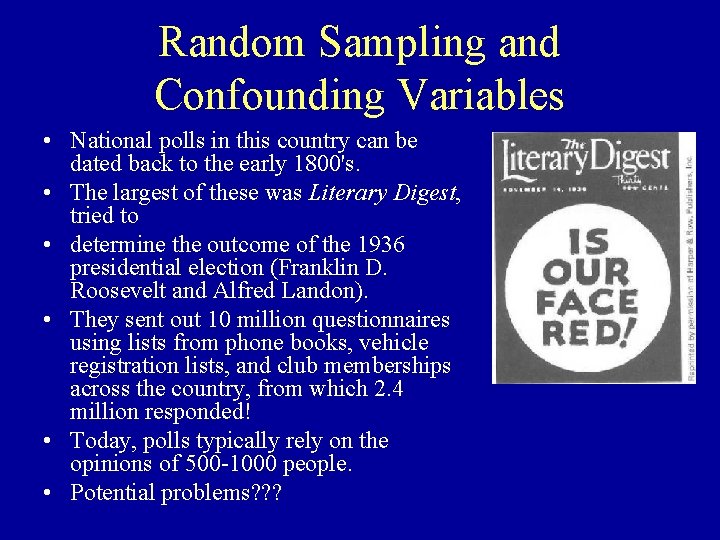
Random Sampling and Confounding Variables • National polls in this country can be dated back to the early 1800's. • The largest of these was Literary Digest, tried to • determine the outcome of the 1936 presidential election (Franklin D. Roosevelt and Alfred Landon). • They sent out 10 million questionnaires using lists from phone books, vehicle registration lists, and club memberships across the country, from which 2. 4 million responded! • Today, polls typically rely on the opinions of 500 -1000 people. • Potential problems? ? ?
Correlation Looking for a Relationship • Correlation measures the strength of a relationship between two variables, and the direction of the relationship, positive or negative.
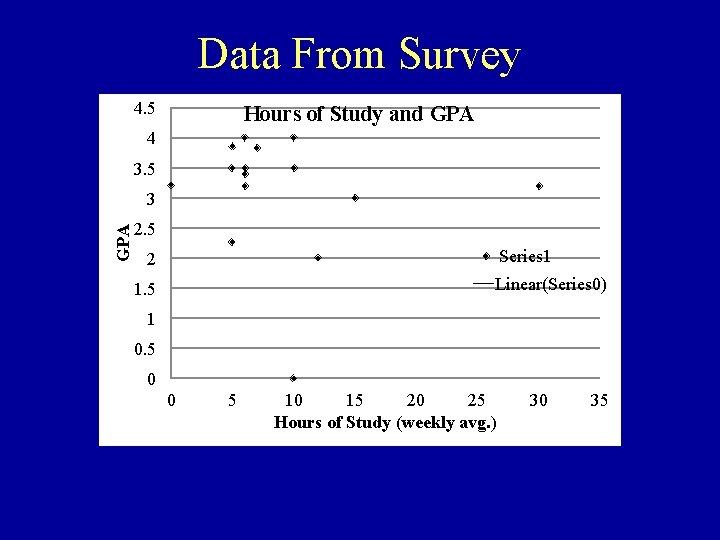
Data From Survey 4. 5 Hours of Study and GPA 4 3. 5 GPA 3 R 2 = 0. 013 2. 5 Series 1 2 Linear(Series 0) 1. 5 1 0. 5 0 0 5 10 15 20 25 Hours of Study (weekly avg. ) 30 35
The Science of Observation • Validity—able to draw accurate inferences – construct validity: e. g. , describing what intelligence is and is not, “construct” refers to the “theory” – predictive validity: over time you find X predicts Y • Reliability—same result each time? 25

Data From Survey 14 12 8 Hours of Study Per Week & Sex Hours of Working Out & Sex 7 6 10 5 8 Total 6 4 Total 3 4 2 2 1 0 Female 14 0 Male Female 12 10 8 Average of GPA 6 Average of Study 4 2 0 Female Male
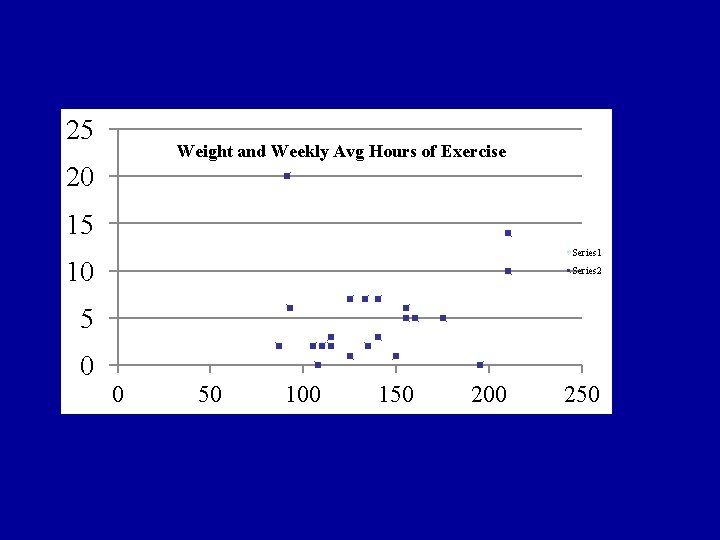
25 Weight and Weekly Avg Hours of Exercise 20 15 Series 1 10 Series 2 5 0 0 50 100 150 200 250
- Slides: 28