
STATS 361 Software Packages UNIT 3 Emmanuel Harris


- Slides: 52
STATS 361 Software Packages UNIT 3 Emmanuel Harris emmaharris 2002@yahoo. com // 020 2470867 Feb 2016
UNIT 3 • CONTINUOUS DISTRIBUTION 1. NORMAL DISTRIBUTION 2. UNIFORM DISTRIBUTION 3. EXPONENTIAL DISTRIBUTION 1
CONTINUOUS DISTRIBUTIONS A probability distribution for a continuous random variable X is function that specifies the probability associated with some continuous values within an interval. Distributions include; § Normal § Uniform § Exponential 2
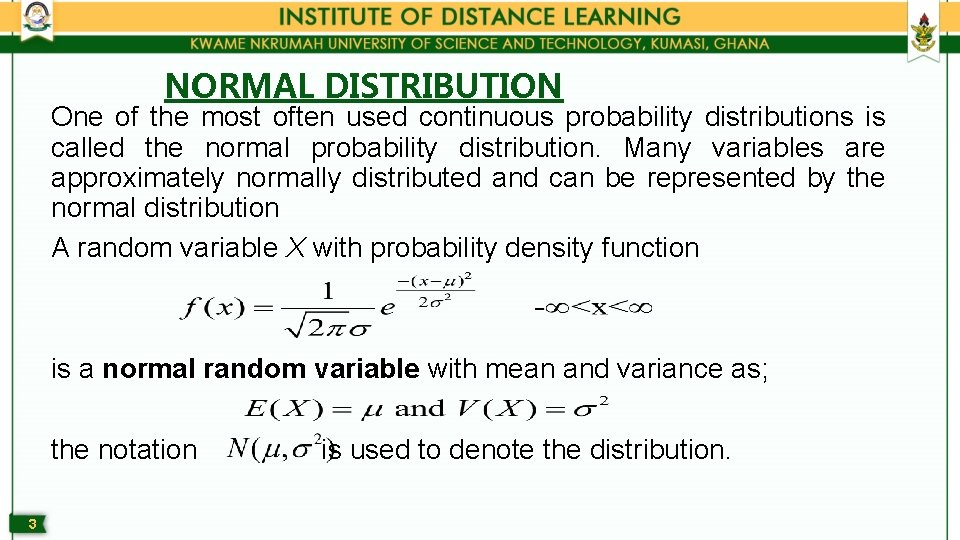
NORMAL DISTRIBUTION One of the most often used continuous probability distributions is called the normal probability distribution. Many variables are approximately normally distributed and can be represented by the normal distribution A random variable X with probability density function is a normal random variable with mean and variance as; the notation is used to denote the distribution. 3
PROPERTIES • It is bell-shaped. • The mean, median, and mode are at the center of the distribution. • It is symmetric about the mean. (This means that it is a reflection of itself if a mean was placed at the center. ) • It is continuous; i. e. , there are no gaps. • It never touches the x axis. • The total area under the curve is 1 or 100%. 4
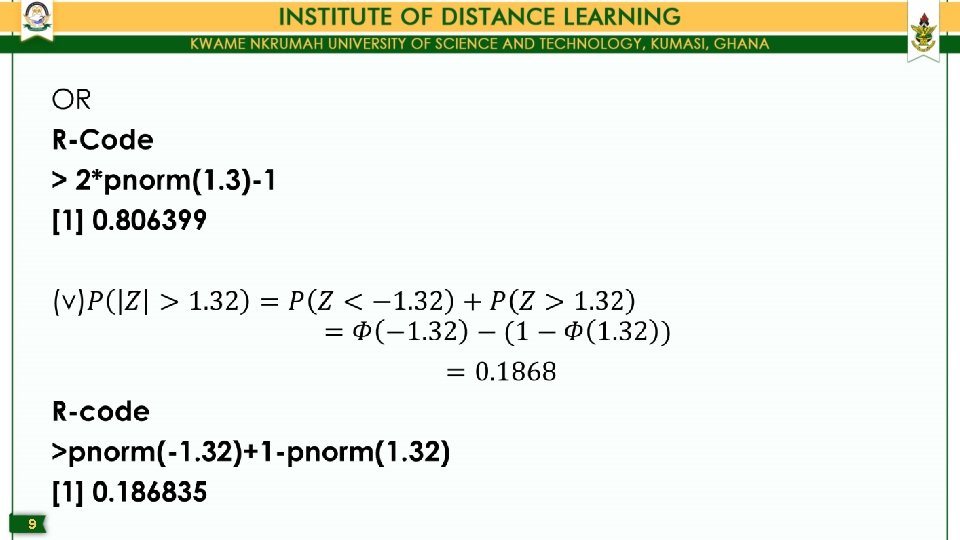
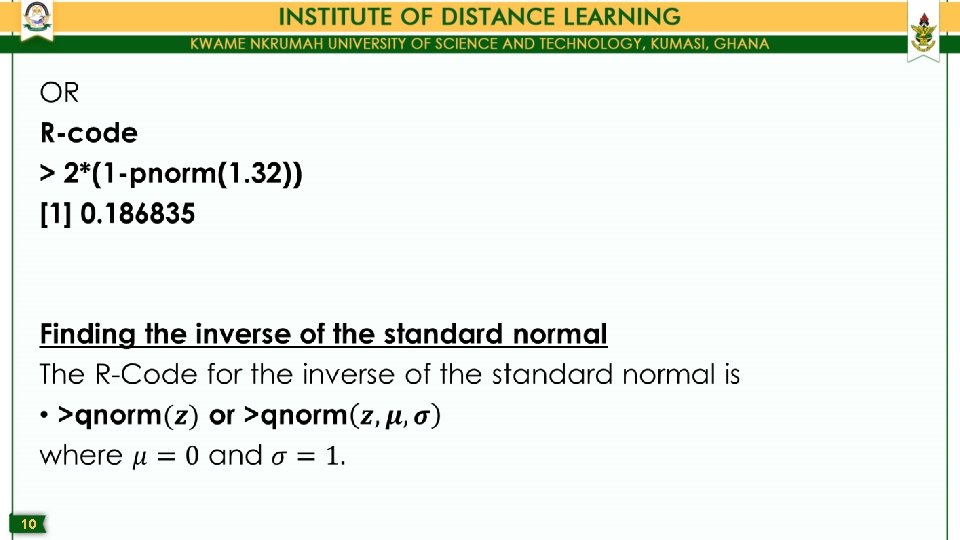
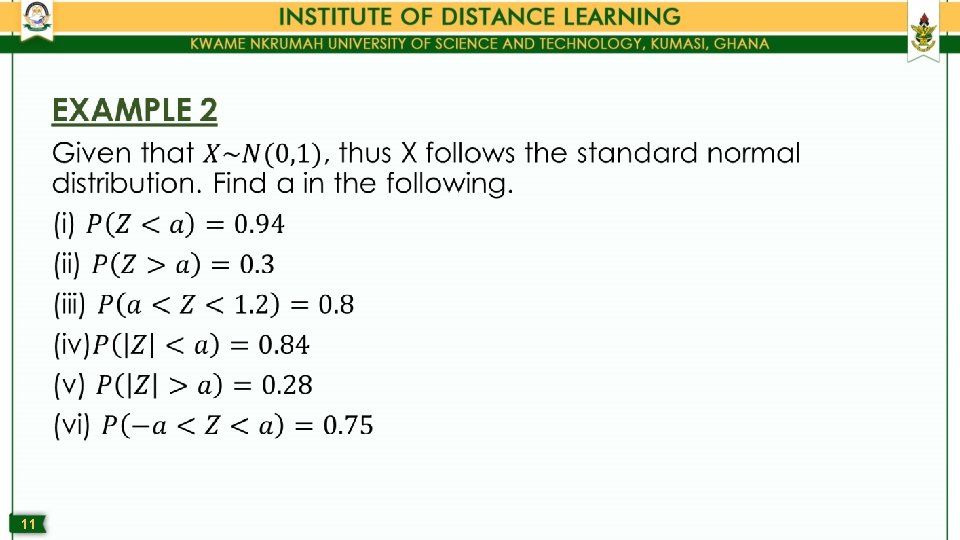
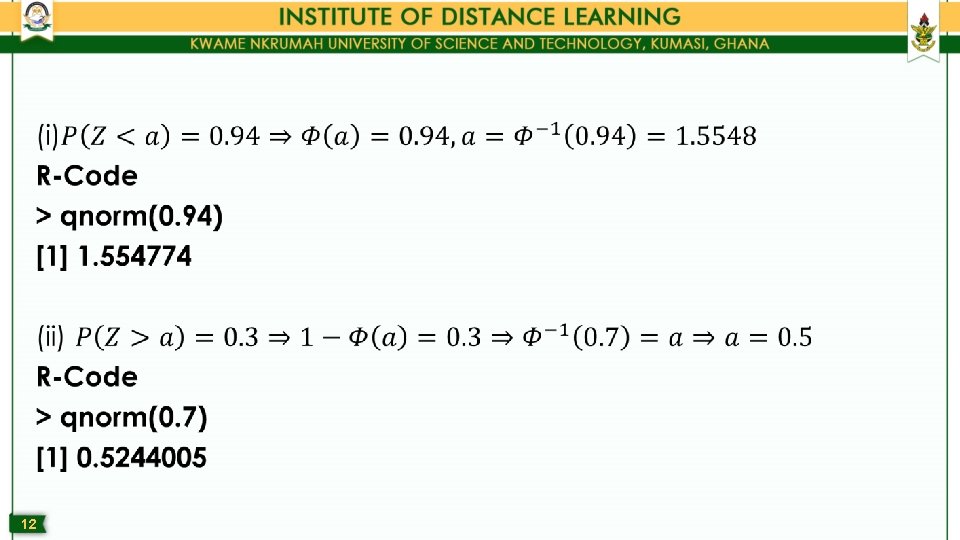
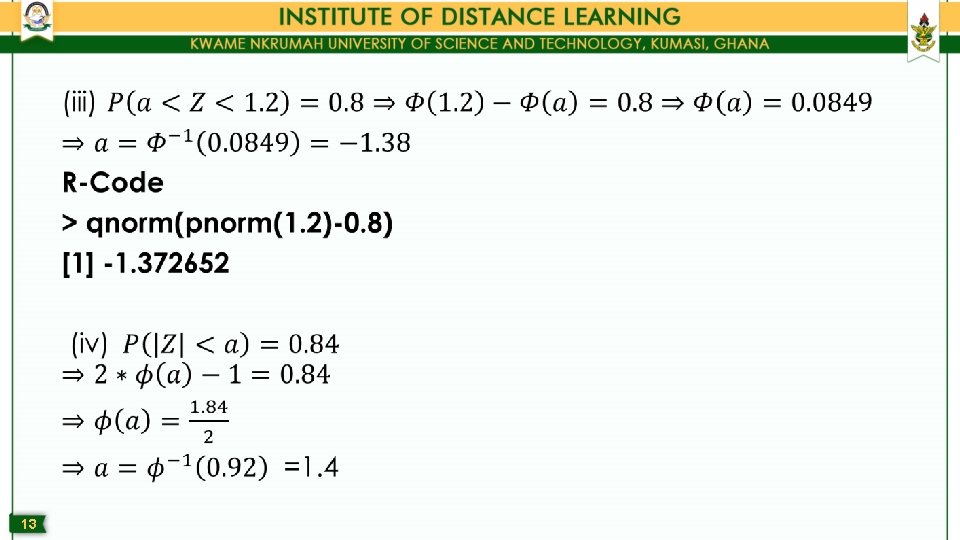
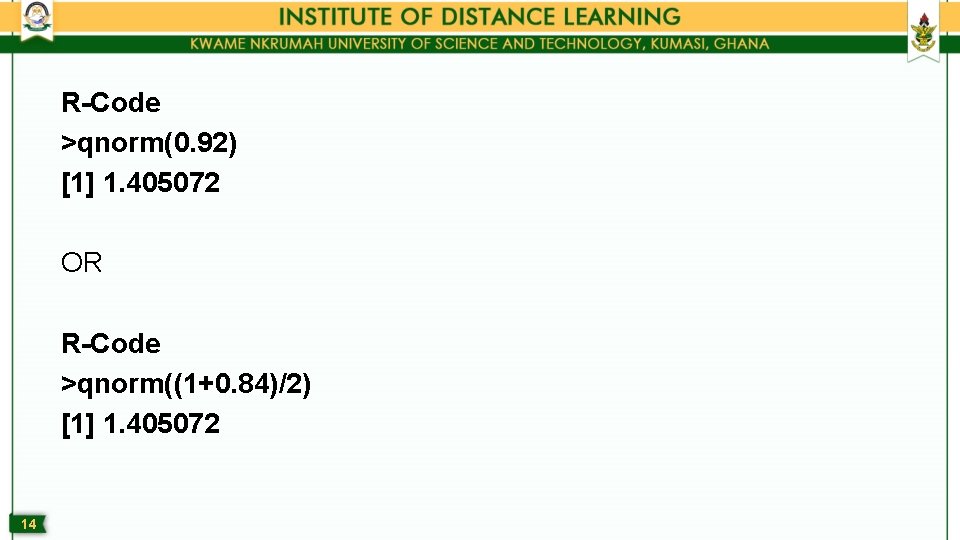
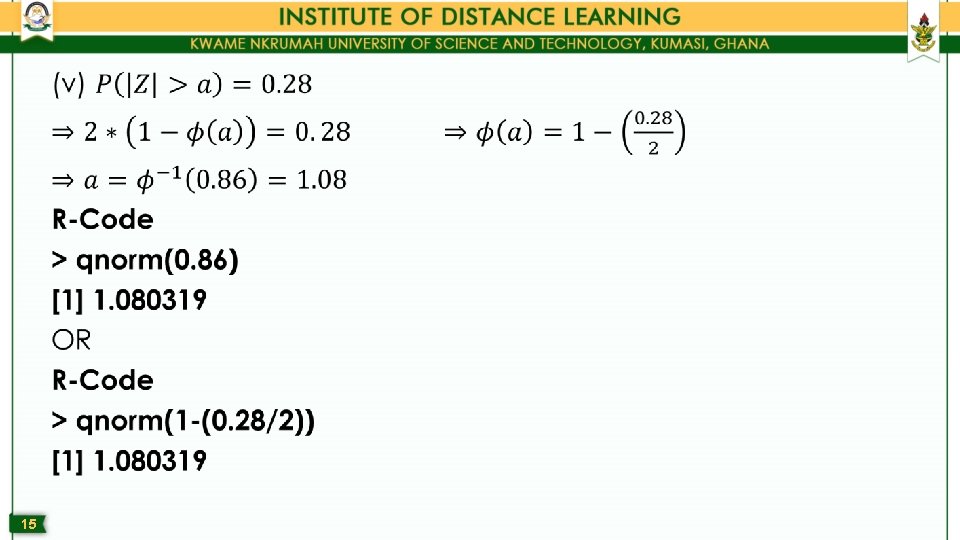
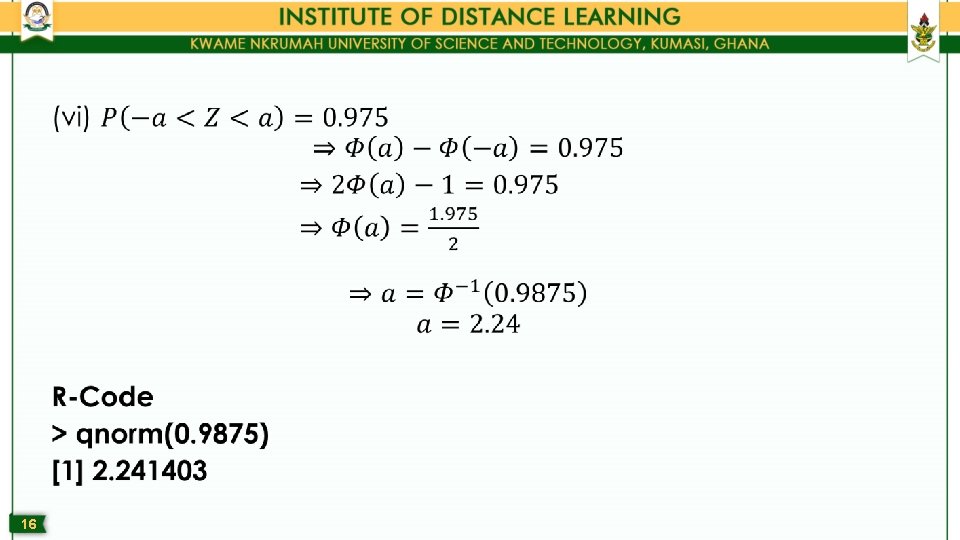
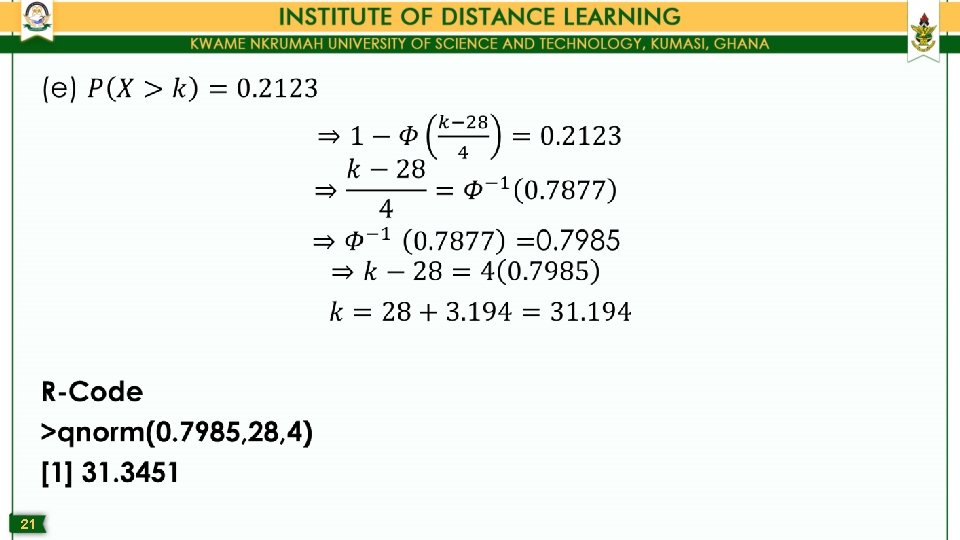
R-Code >qnorm(0. 92) [1] 1. 405072 OR R-Code >qnorm((1+0. 84)/2) [1] 1. 405072 14
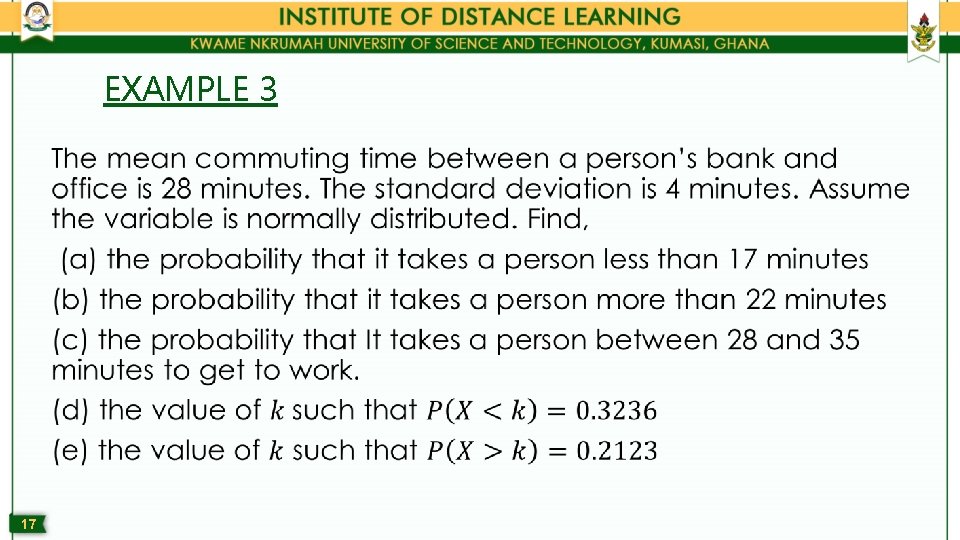
EXAMPLE 3 • 17
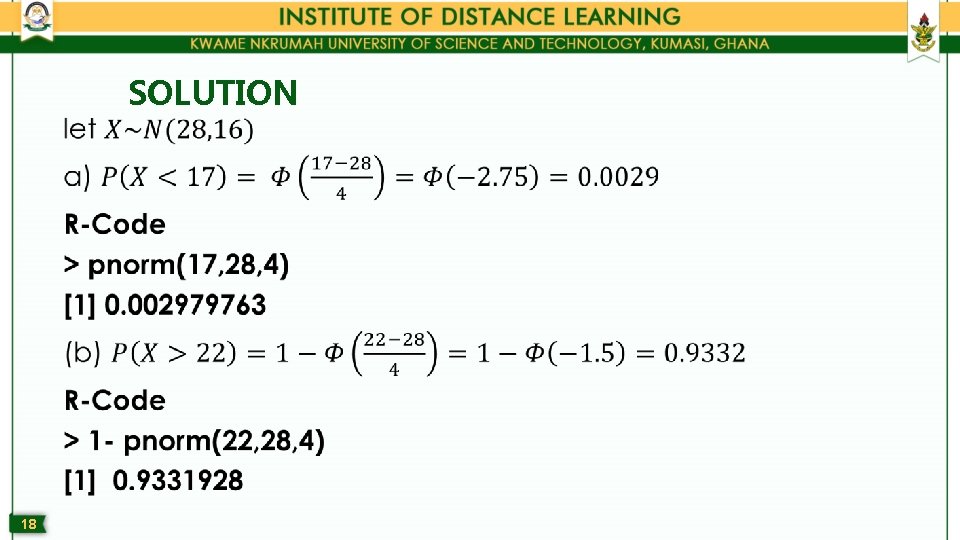
• 18 SOLUTION
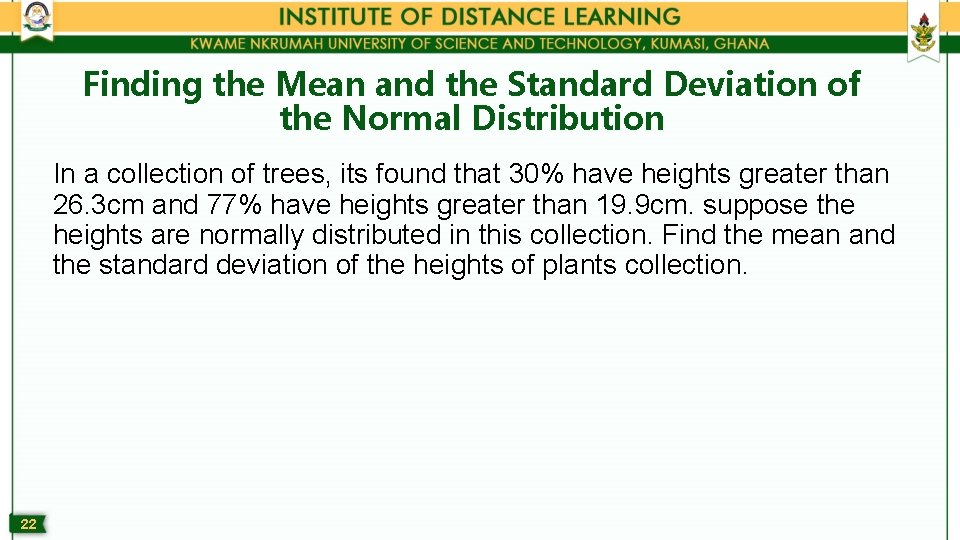
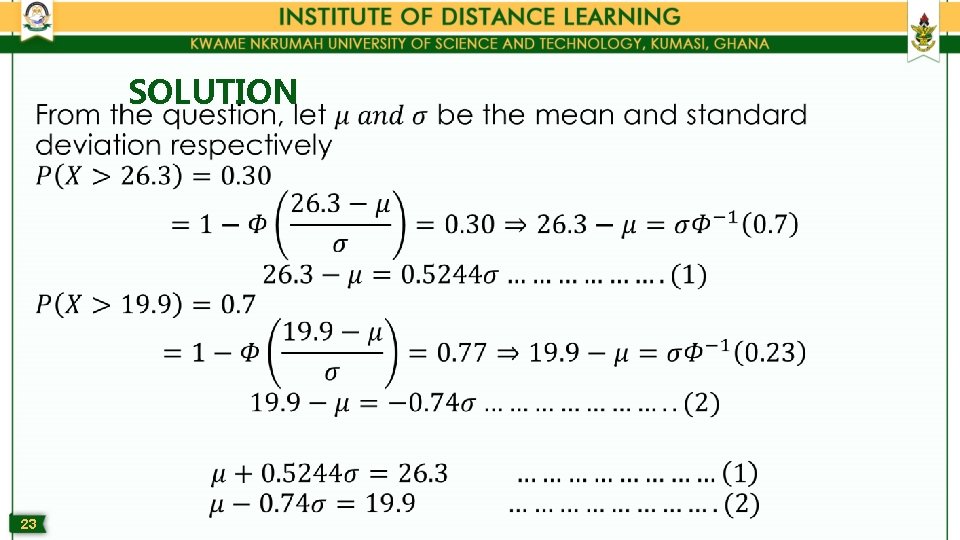
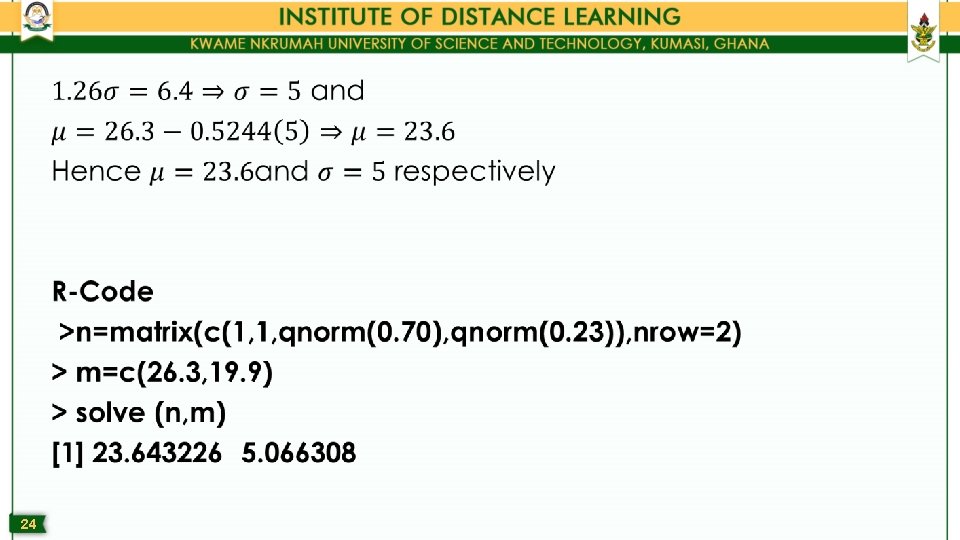
Finding the Mean and the Standard Deviation of the Normal Distribution In a collection of trees, its found that 30% have heights greater than 26. 3 cm and 77% have heights greater than 19. 9 cm. suppose the heights are normally distributed in this collection. Find the mean and the standard deviation of the heights of plants collection. 22
• 23 SOLUTION
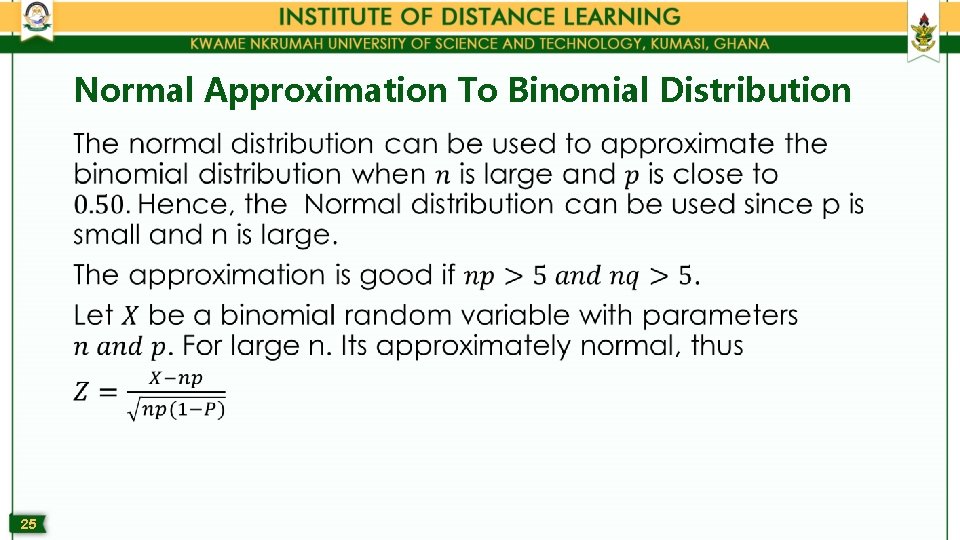
Normal Approximation To Binomial Distribution • 25
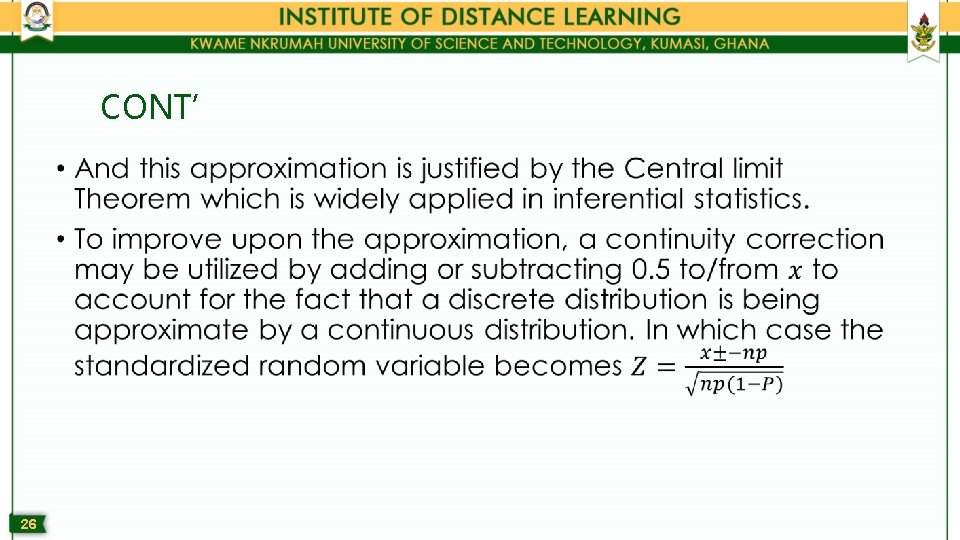
CONT’ • 26
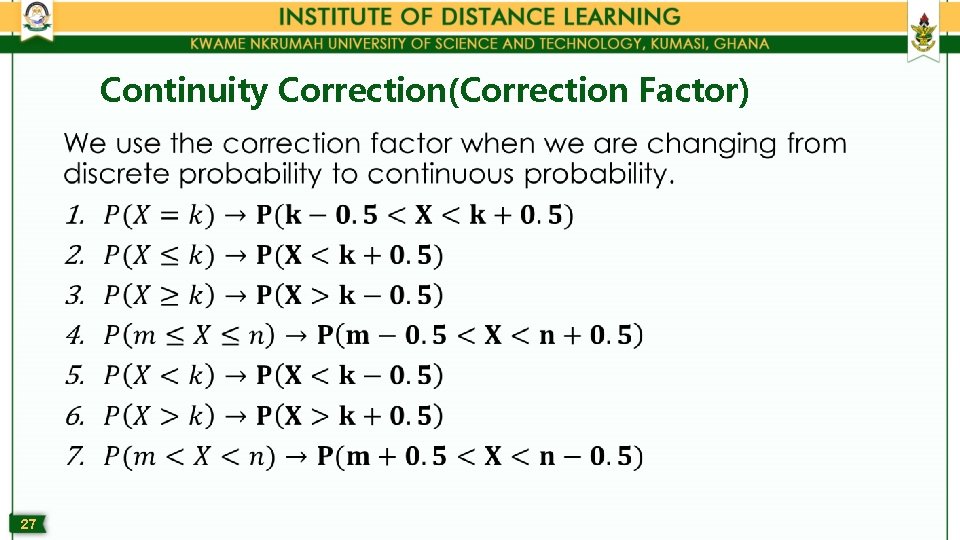
Continuity Correction(Correction Factor) • 27
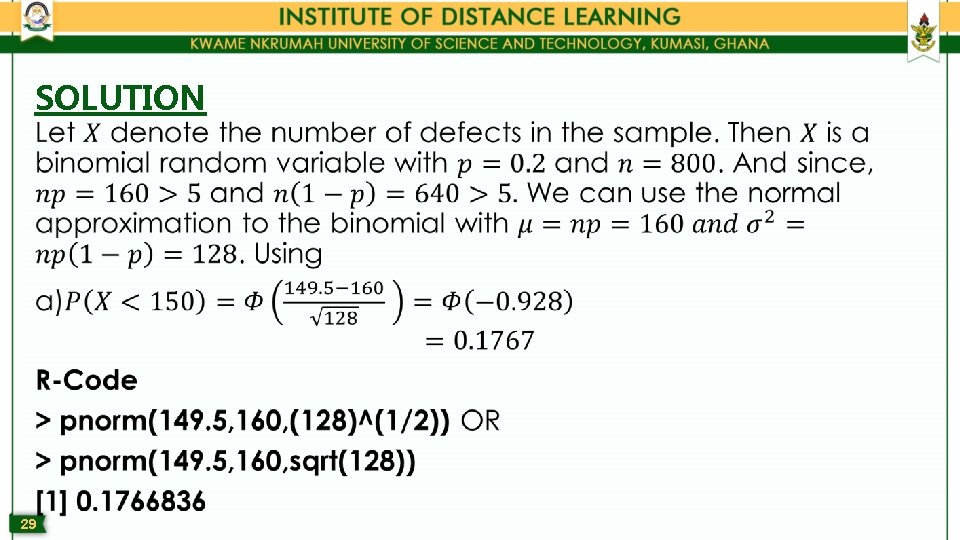
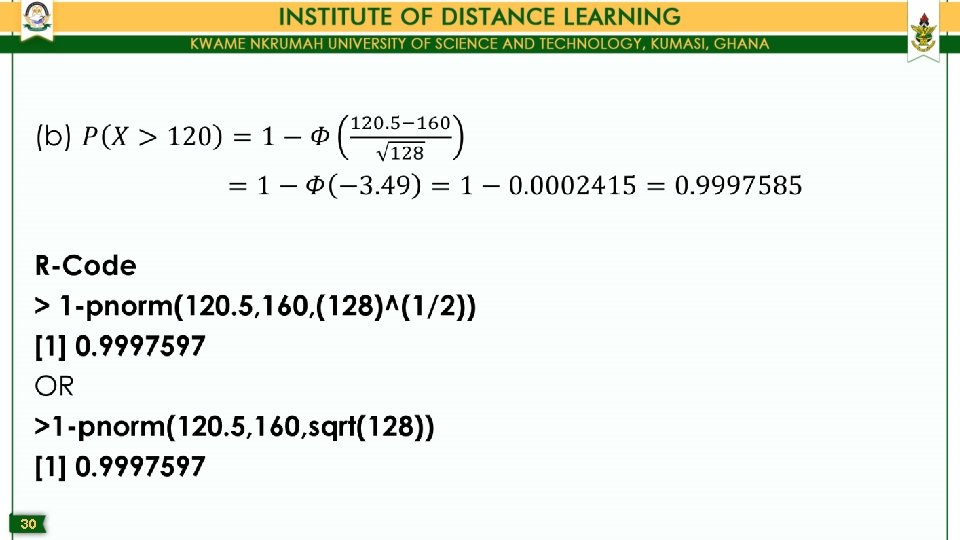
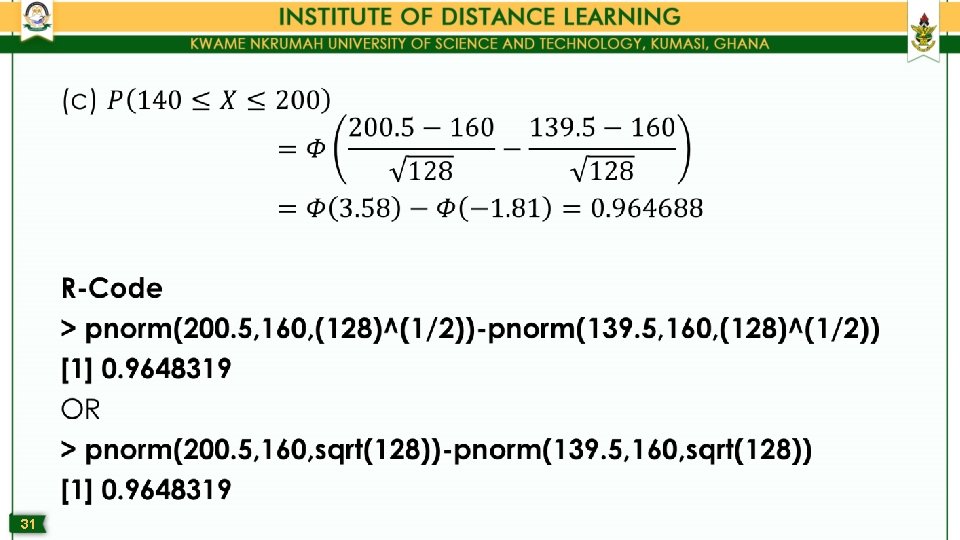
SOLUTION • 29
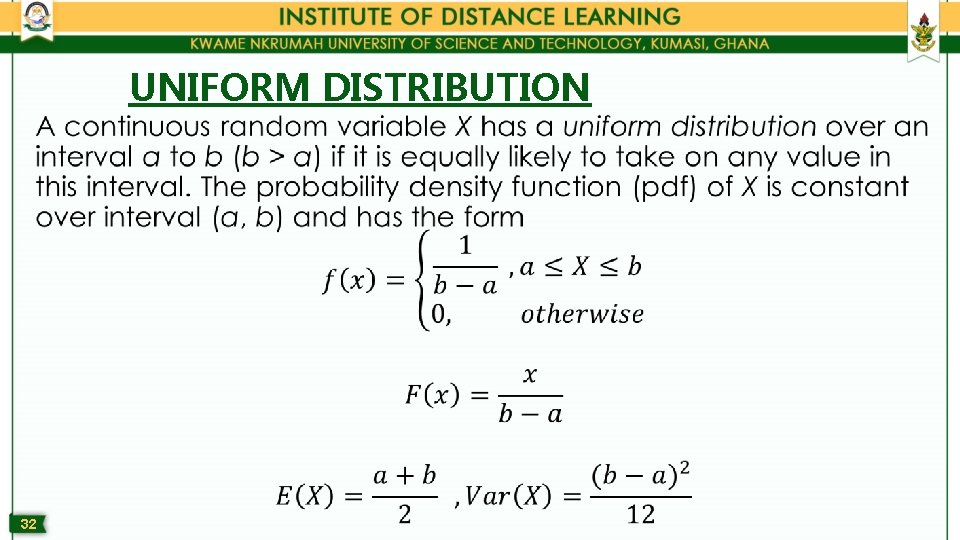
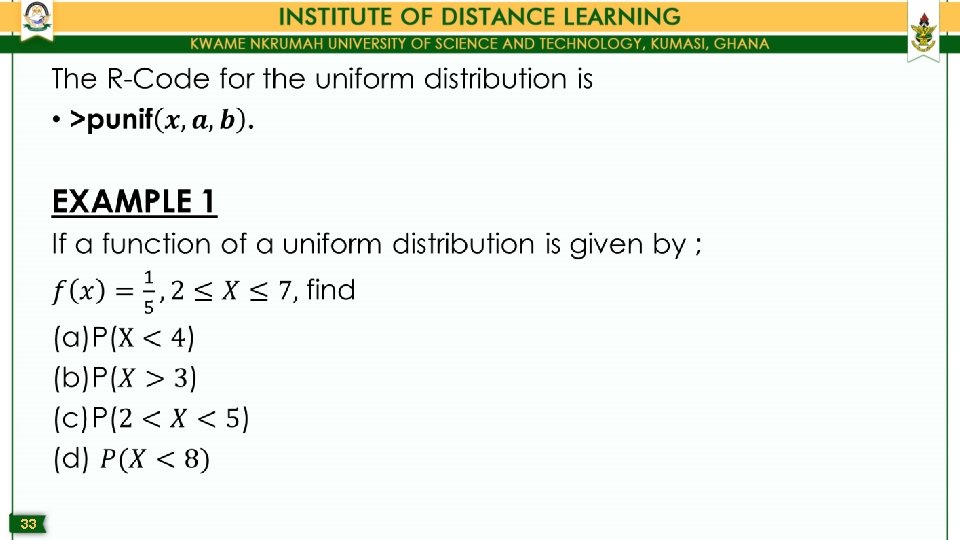
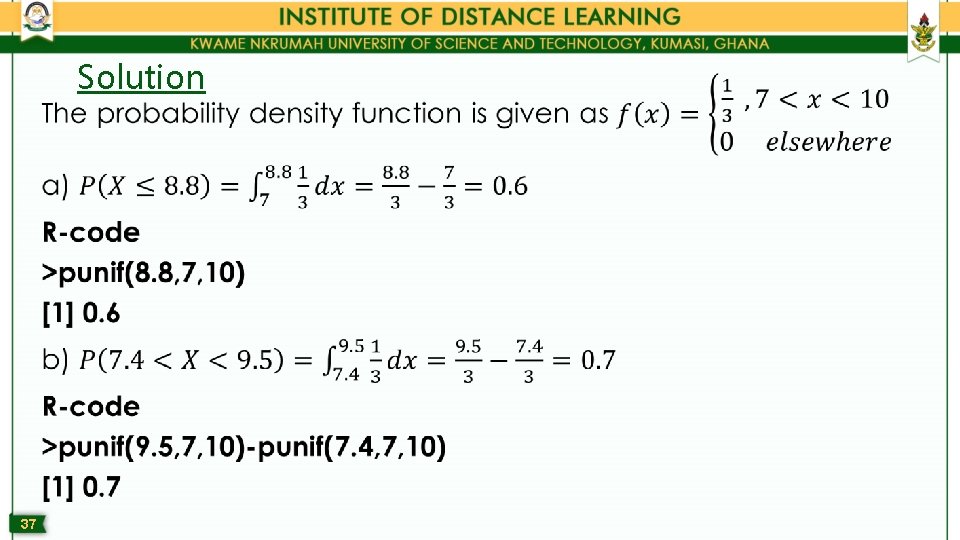
• 32 UNIFORM DISTRIBUTION
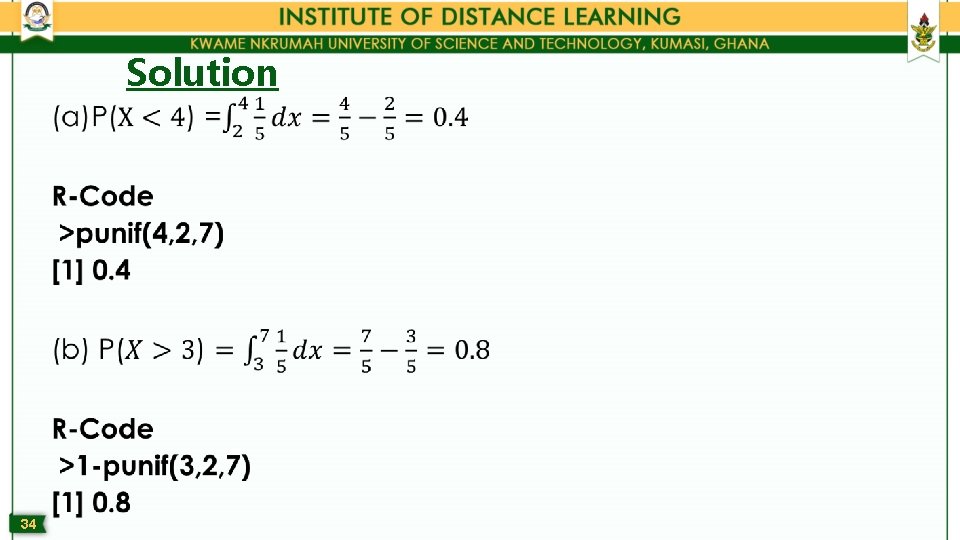
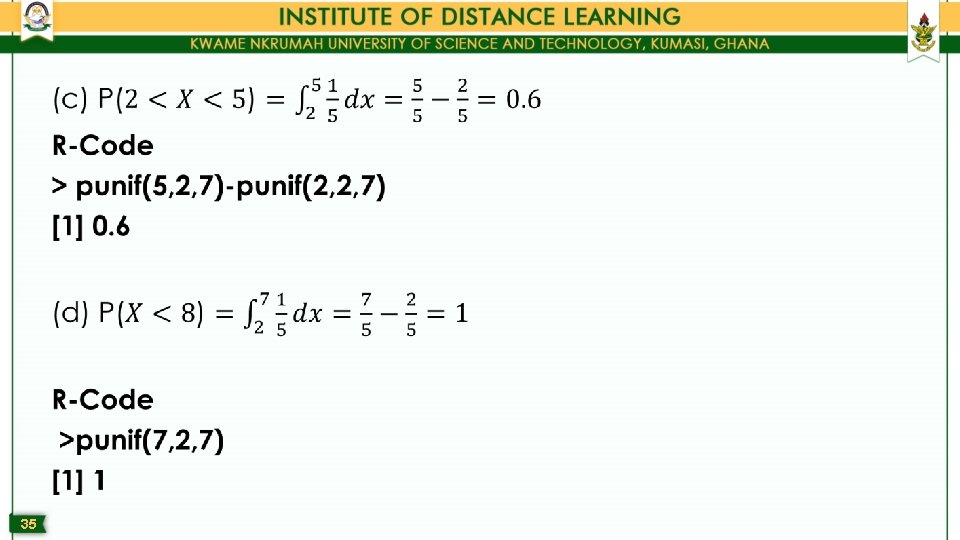
Solution • 34
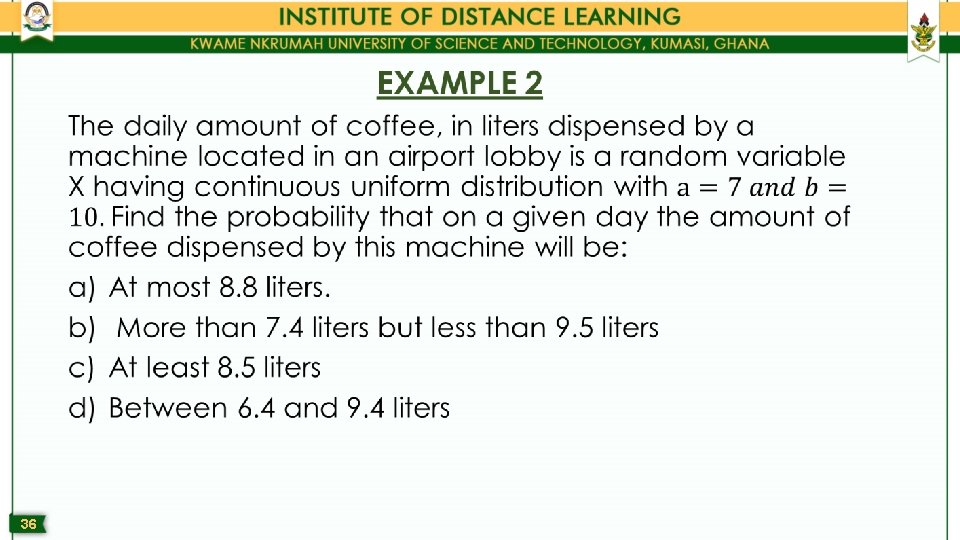
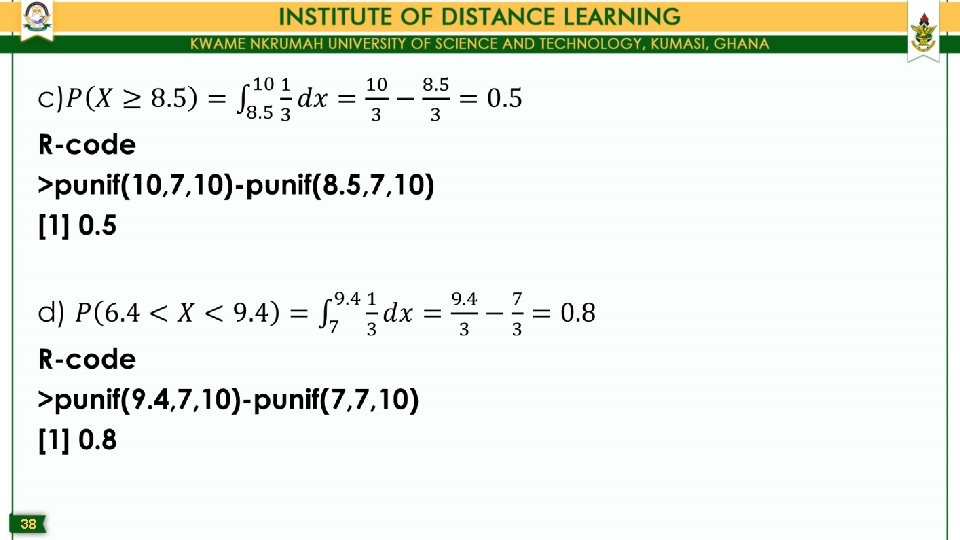
• Solution 37
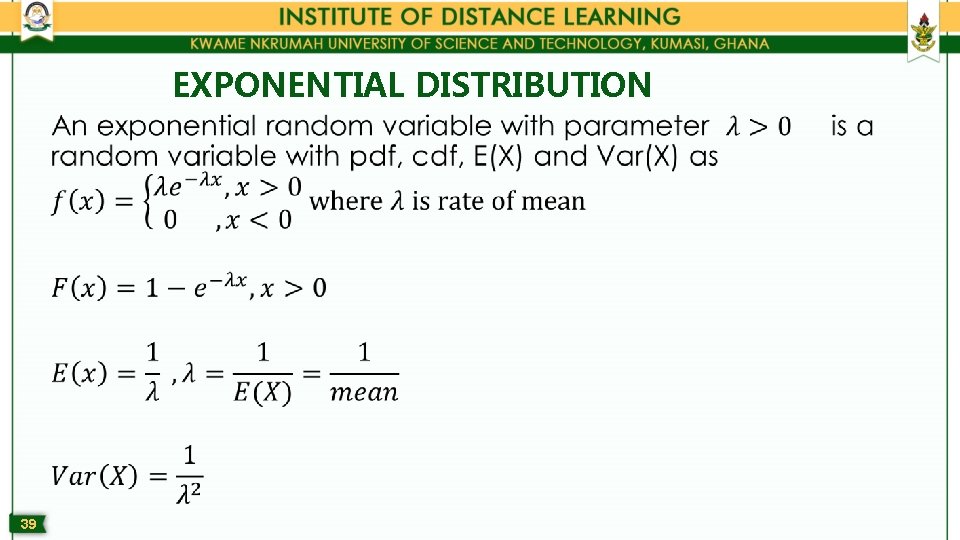
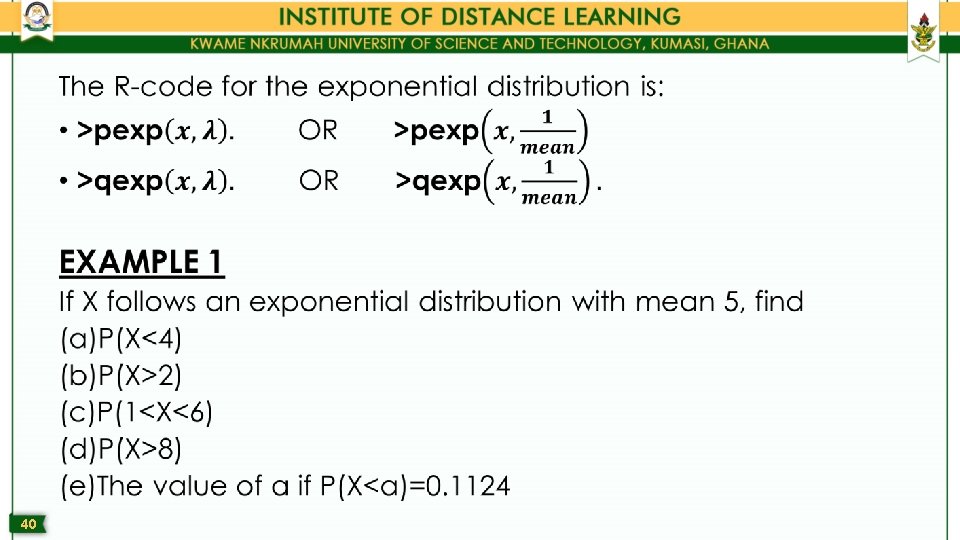
EXPONENTIAL DISTRIBUTION • 39
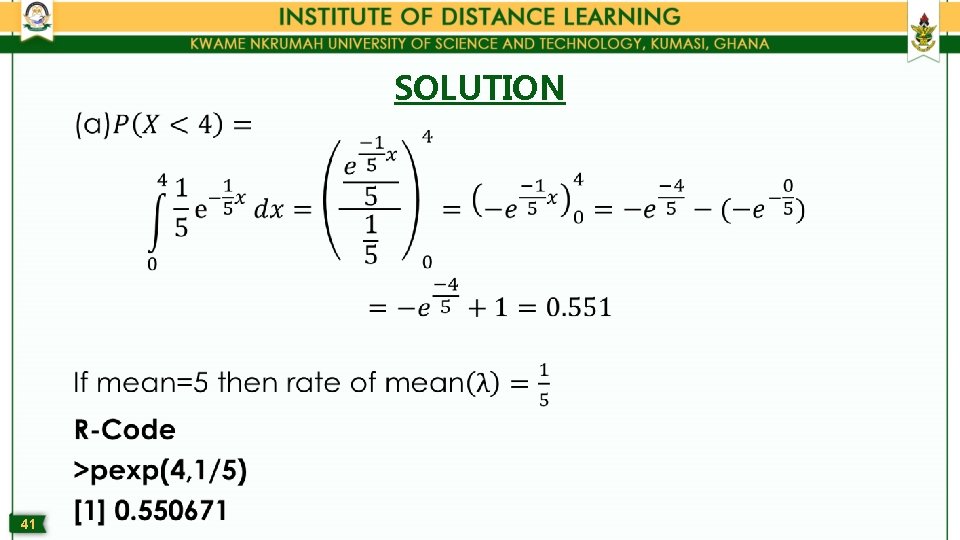
• 41 SOLUTION
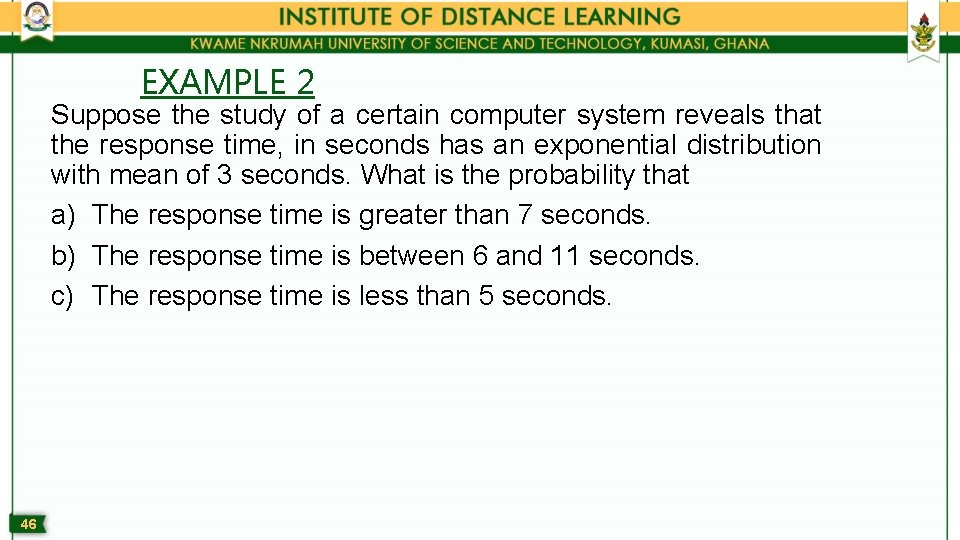
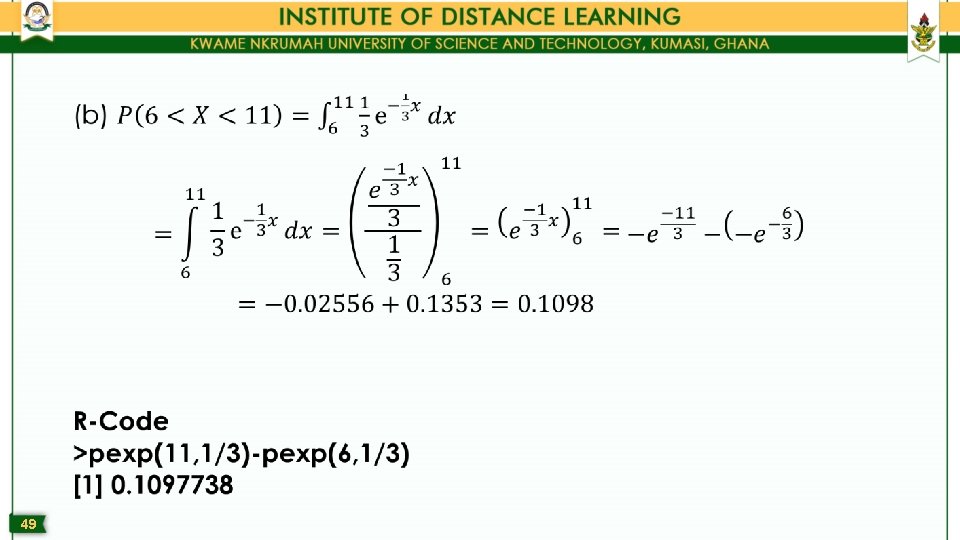
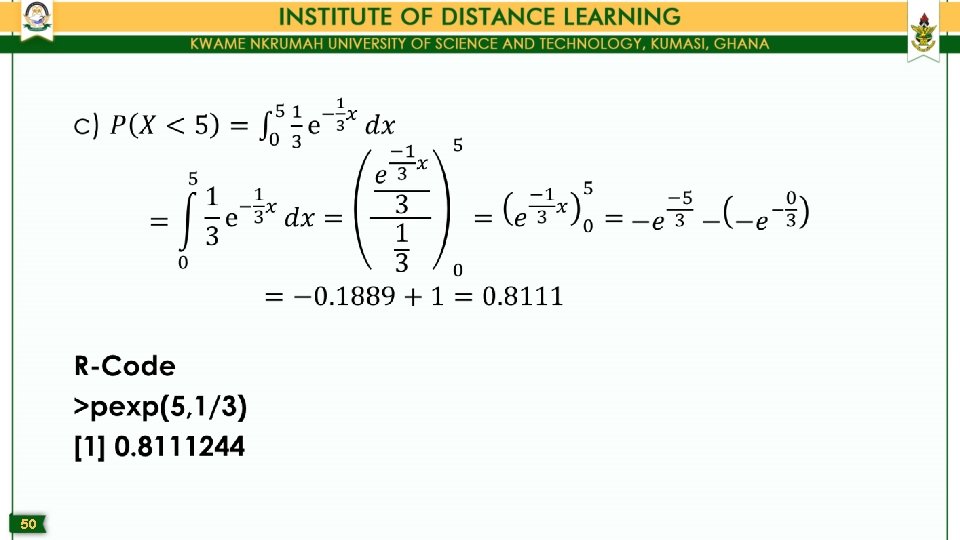
EXAMPLE 2 Suppose the study of a certain computer system reveals that the response time, in seconds has an exponential distribution with mean of 3 seconds. What is the probability that a) The response time is greater than 7 seconds. b) The response time is between 6 and 11 seconds. c) The response time is less than 5 seconds. 46
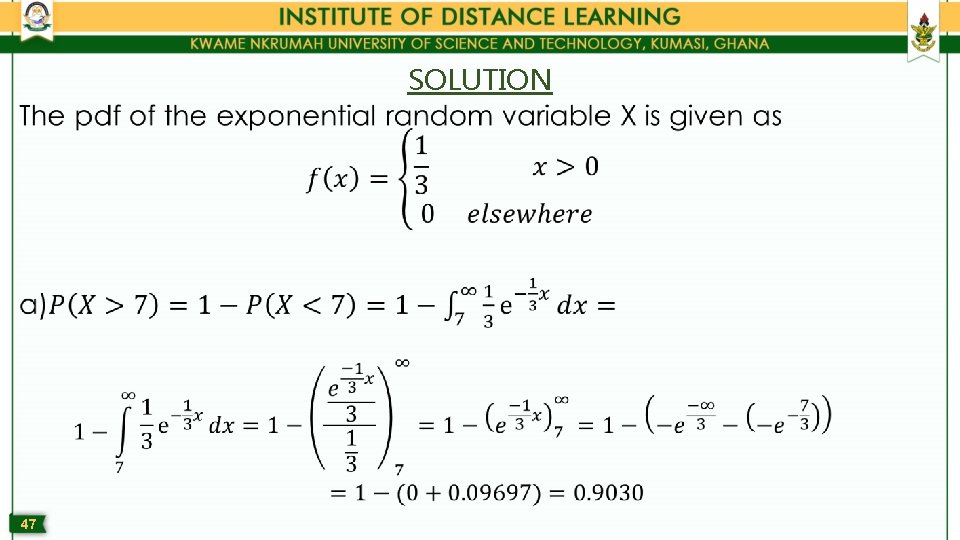
SOLUTION • 47
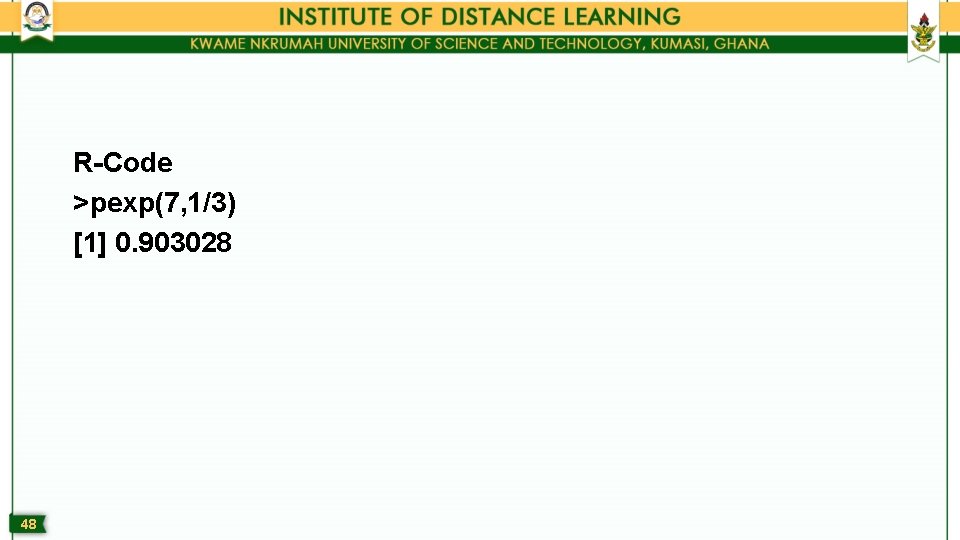
R-Code >pexp(7, 1/3) [1] 0. 903028 48
Thank You For any concerns, please contact elearning@knust. edu. gh elearningknust@gmail. com 0322 191132 Feb 2016