Statistics without the pain Lisa Cornish Strategic Initiatives
 Lisa Cornish, Strategic Initiatives Manager VCA & MCM")


")


 = STDEV() Relationships =CORREL() Action")

 100 Uo. M students responded to a survey that asked")
 A sample of 400 payroll records has been checked. The mean overpayment has")
 You have utilised excel to assess the correlation between student volumes in B-Com")
- Slides: 34
Statistics (without the pain) Lisa Cornish, Strategic Initiatives Manager VCA & MCM
Confidence Relationships Action
Confidence
9. 6 cm 9. 2 cm 9. 6 cm 10. 3 cm
20 cm
Standard Error •
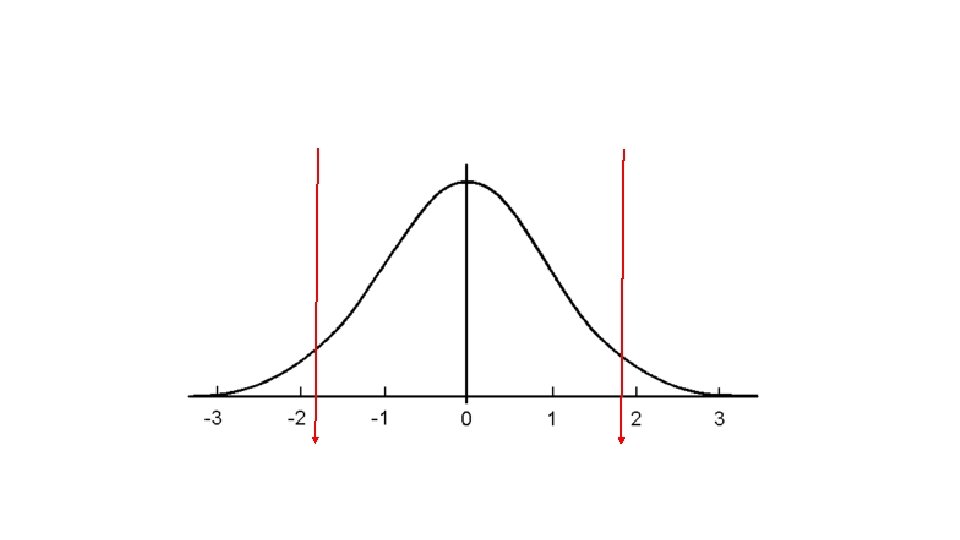
Normal Distribution
95% Confidence = 1. 96
99% Confidence = 2. 58
• Population Mean Sample Mean Z Score Standard Error
Example: A sample of 50 trolls was taken resulting in a sample mean of 10. 2 cm and a standard error of 0. 46. At a 95% confidence interval, what range is the population mean likely to lie between? •
Shortcut Tricks There are lots of online calculators that will calculate a confidence interval for you. They usually ask for; Sample size Sample mean -Calculate in excel first =AVERAGE(XX: XX) Standard deviation -Calculate in excel first =STDEV(XX: XX) If you are using this shortcut, make sure the calculator adjusts for small sample sizes or make sure your sample is larger than 30.
Extra Tricks The same theory can be used in reverse to figure out how big a sample size would need to be to obtain a result with a certain confidence interval. There are online calculators that will do this for you also. These are extremely useful to use in advance of planning a survey if you want to make sure that your approach is designed to get the respondent volume you need to base decisions from.
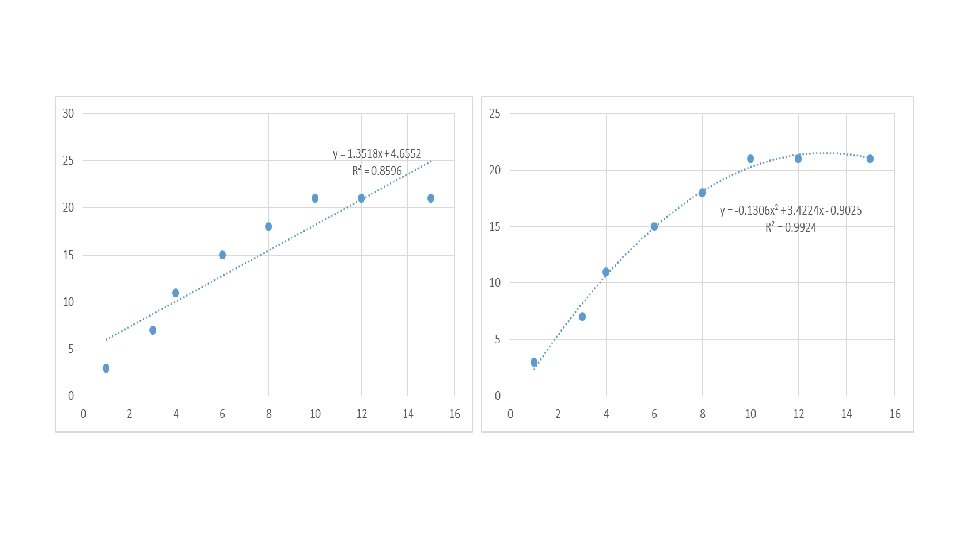
Relationships
600 500 400 300 200 100 0 0 2 4 6 8 10 12 14 16 18 20
1200 1000 800 600 400 200 0 0 5 10 15 20 25
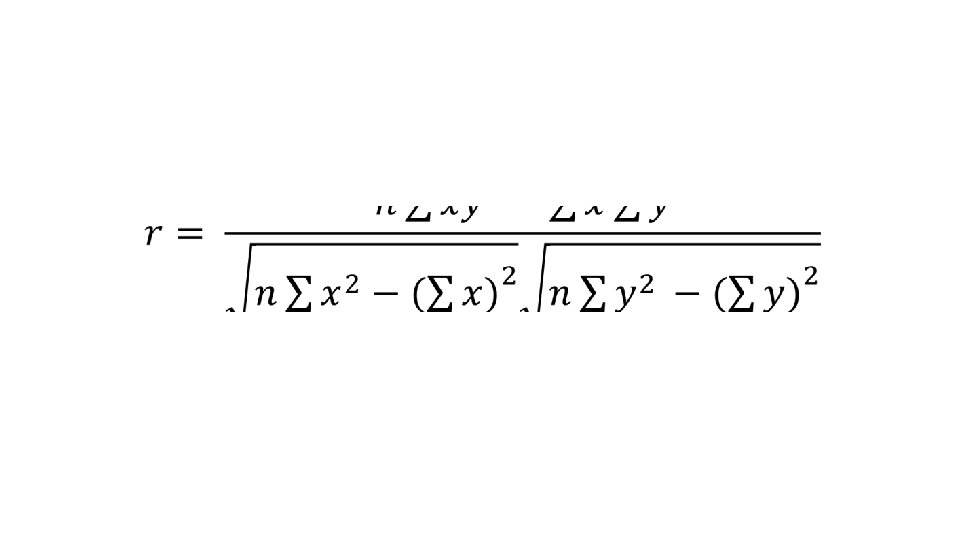
=CORREL(XX: XX)
10 10 10 8 8 8 6 6 6 4 4 4 2 2 2 0 0 5 -1 10 0 5 0 10 0 5 +1 10
Shortcut Tricks
Action
Sources of Help • Local Analysts • https: //unimelb. service-now. com/it • https: //staff. unimelb. edu. au/about/university-services/businessintelligence-reporting • http: //www. scc. ms. unimelb. edu. au/
Confidence = AVERAGE() = STDEV() Relationships =CORREL() Action
Discussion Activities On your table, brainstorm… • Different ways you could apply confidence intervals and correlation to add value to data you are already collecting and using. • Data you have previously or are currently collecting but are not taking any action on. Review this list and determine what action you could be taking or whether you should stop or reduce the resources going into this data collation.
Questions To Try: 1) 100 Uo. M students responded to a survey that asked them to score their satisfaction with their course out of 50. The mean score was 35. 2 with a standard deviation of 4. 1. Use an online calculator to calculate the confidence interval at 95% and 99%. 2) A colleague has suggested that 100 students was not enough. If the total population of students is 47, 000. Use an online calculator to determine how many students would you have needed to respond to be 95% confident with a confidence interval of 2% in either direction of the mean score? What would this decrease to if you were happy for the confidence interval to be 5% in either direction?
3) A sample of 400 payroll records has been checked. The mean overpayment has been calculated as $11, 000 per annum, with a standard deviation of $6, 000. At 95% confidence what conclusion can you draw about overpayments? What if the sample mean had been $19, 500? 4) The Co-op takes a sample of 100 customers and finds the average amount they spend is $25. 68 with a standard deviation of $5. 42. Using a 95% confidence interval, estimate the daily revenue if the store has 1, 200 customers per day.
5) You have utilised excel to assess the correlation between student volumes in B-Com and student volumes in a breadth subject “Painting Techniques”. Excel has produced a r value of 0. 23. Is this a strong correlation? Can you rely on this to forecast next years numbers? 6) You have utilised excel to assess the correlation between grant submissions and % grants successful. Excel has produced a r value of -0. 89. Is this a strong correlation? What might the data suggest?