Statistics Variability Descriptive Statistics Averages tell where the

Statistics Variability

Descriptive Statistics Averages tell where the data tends to pile up

Descriptive Statistics Another good way to describe data is how spread out it is

Descriptive Statistics Suppose you are using the mean “ 5” to describe each of the observations in your sample

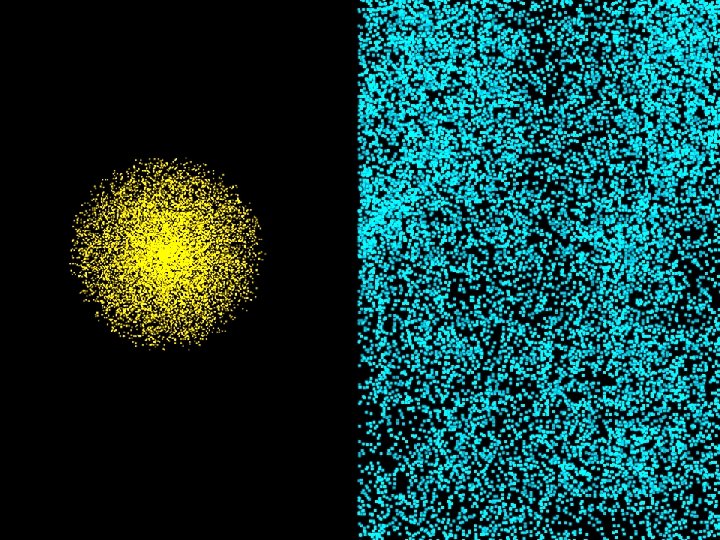
VARIABILITY IN-CLASS PROBLEM For which sample would “ 5” be closer to the actual data values?

VARIABILITY IN-CLASS PROBLEM In other words, for which of the two sets of data would the mean be a better descriptor?

VARIABILITY IN-CLASS PROBLEM For which of the two sets of data would the mean be a better descriptor?

Variability Numbers telling how spread out our data values are called “Measures of Variability”

Variability The variability tells how close to the “average” the sample data tend to be

Variability Just like measures of central tendency, there are several measures of variability

Variability Range = R = max – min
 s 2 =")
Variability Variance (symbolized s 2) s 2 =

Variability

Variability In algebra, the absolute value of “deviations” are a measure of distance

Variability We square them because it gets rid of the “+” “-” problem and has mathematical advantages over taking absolute values

Variability Sums of squared deviations are used in the formula for a circle: r 2 = (x-h)2 + (y-k)2 where r is the radius of the circle and (h, k) is its center

Variability OK… so if its sort of an arithmetic mean, howcum is it divided by “n-1” not “n”?

Variability Every time we estimate something in the population using our sample we have used up a bit of the “luck” that we had in getting a (hopefully) representative sample

Variability To make up for that, we give a little edge to the opposing side of the story

Variability Since a small variability means our sample arithmetic mean is a better estimate of the population mean than a large variability is, we bump up our estimate of variability a tad to make up for it

Variability Dividing by “n” would give us a smaller variance than dividing by “n-1”, so we use that

Variability Why not “n-2”?

Variability

Variability

Variability Trust me…

Variability

Variability

Variability The range and standard deviation are in the same units as the original data (a good thing) The variance is in squared units (which can be confusing…)

Variability Naturally, the measure of variability used most often is the hard-to-calculate one…

Variability Naturally, the measure of variability used most often is the hard-to-calculate one… … the standard deviation

Variability Statisticians like it because it is an average distance of all of the data from the center – the arithmetic mean

Variability

Questions?

Variability

VARIABILITY IN-CLASS PROBLEM

VARIABILITY IN-CLASS PROBLEM Min Max

VARIABILITY IN-CLASS PROBLEM

VARIABILITY IN-CLASS PROBLEM

VARIABILITY IN-CLASS PROBLEM

VARIABILITY IN-CLASS PROBLEM

VARIABILITY IN-CLASS PROBLEM

Variability What do you get if you add up all of the deviations? Data: 1 1 2 2 3 3 Dev: 1 -2=-1 2 -2=0 3 -2=1

Variability Zero!

Variability Zero! That’s true for ALL deviations everywhere in all times!

Variability Zero! That’s true for ALL deviations everywhere in all times! That’s why they are squared in the sum of squares!

VARIABILITY IN-CLASS PROBLEM

VARIABILITY IN-CLASS PROBLEM

VARIABILITY IN-CLASS PROBLEM

YAY!

VARIABILITY IN-CLASS PROBLEM

VARIABILITY IN-CLASS PROBLEM

VARIABILITY IN-CLASS PROBLEM

Variability Aren’t you glad Excel does all this for you? ? ?

Questions?

Variability

Variability Naturally, these are going to have funny Greek-y symbols just like the averages …

Variability The population variance 2 is “σ ” called “sigma-squared” The population standard deviation is “σ” called “sigma”

Variability Again, the sample statistics s 2 and s values estimate population parameters σ2 and σ (which are unknown)

Variability

Variability s sq “s 2” vs sigma sq “σ2”

Variability s 2 is divided by “n-1” σ2 is divided by “N”

Questions?

Standard Deviation What does standard deviation mean?

STANDARD DEVIATION IN-CLASS PROBLEM Suppose we have two pizza delivery drivers We’re going to give one a raise But who?

STANDARD DEVIATION IN-CLASS PROBLEM Both have the same mean delivery time of 15 minutes but Amanda’s standard deviation of delivery times = 2. 6 minutes while Bethany’s standard deviation of delivery times = 8. 4 minutes.

STANDARD DEVIATION IN-CLASS PROBLEM Who should get the raise?

STANDARD DEVIATION IN-CLASS PROBLEM What are the advantages of having a data set that has a small standard deviation?

Questions?

Variability Outliers! They can really affect your statistics!

OUTLIERS IN-CLASS PROBLEM Suppose 1 1 2 we 3 originally had data: 5 now have data: 741 Is the mode affected?

OUTLIERS IN-CLASS PROBLEM Suppose 1 1 2 we 3 originally had data: 5 now have data: 741 Original mode: 1 New mode: 1

OUTLIERS IN-CLASS PROBLEM Suppose 1 1 2 we 3 originally had data: 5 now have data: 741 Is the median affected?

OUTLIERS IN-CLASS PROBLEM Suppose 1 1 2 we 3 originally had data: 5 now have data: 741 Original median: 2 New median: 2

OUTLIERS IN-CLASS PROBLEM Suppose 1 1 2 we 3 originally had data: 5 now have data: 741 Is the mean affected?

OUTLIERS IN-CLASS PROBLEM Suppose 1 1 2 we 3 originally had data: 5 now have data: 741 Original mean: 2. 4 New mean: 149. 6

Outliers! How about measures of variability?

OUTLIERS IN-CLASS PROBLEM Suppose 1 1 2 we 3 originally had data: 5 now have data: 741 Is the range affected?

OUTLIERS IN-CLASS PROBLEM Suppose 1 1 2 we 3 originally had data: 5 now have data: 741 Original range: 4 New range: 740

OUTLIERS IN-CLASS PROBLEM Suppose 1 1 2 we 3 originally had data: 5 now have data: 741 Is the standard deviation affected?

OUTLIERS IN-CLASS PROBLEM Suppose 1 1 2 we 3 originally had data: 5 now have data: 741 Original s: ≈1. 7 New s: ≈330. 6

STANDARD DEVIATION IN-CLASS PROBLEM What advantages does the standard deviation have over the range?

Questions?

Multiple Comparison Graph There is a useful graph you can do in Excel that includes both an average and a measure of dispersion

Multiple Comparison Graph I use the Hi/Low/Close chart in Excel to make a Multiple Comparison graph

Multiple Comparison Graph First you need to do the Descriptive Statistics

Multiple Comparison Graph Create a new table using Max, Min and Mean

Multiple Comparison Graph It must be in this order

Multiple Comparison Graph Make a High-Low. Close chart

Multiple Comparison Graph Huh?

Multiple Comparison Graph Make it purty…

Multiple Comparison Graph Right click on any of the tops of the lines

Multiple Comparison Graph Insert a marker

Multiple Comparison Graph This gives you a marker for the Maximum in the legend

Multiple Comparison Graph Do the same for the bottoms of the lines

Multiple Comparison Graph What does this graph show?

MULTIPLE COMPARISON GRAPH IN-CLASS PROBLEM What does this graph show?

MULTIPLE COMPARISON GRAPH IN-CLASS PROBLEM What does this graph show?

Questions?
- Slides: 99