Statistics Use of mathematics to ORGANIZE SUMMARIZE and


- Slides: 15
Statistics Use of mathematics to ORGANIZE, SUMMARIZE and INTERPRET numerical data. Needed to help psychologists draw conclusions.
Descriptive v. Inferential Statistics Descriptive- organize and summarize data Central tendency and variation Histogram- bar graph depicting frequency distribution *Have to read the vertical scales and note range Inferential- interpret the data and draw conclusions
Descriptive Statistics Measures of Central Tendency: Mean-Arithmetic average Add all and divide by # of scores Most useful but very sensitive to extremes Median- Middle score in a distribution Put in order from lowest to highest Mode- Most frequently occurring score
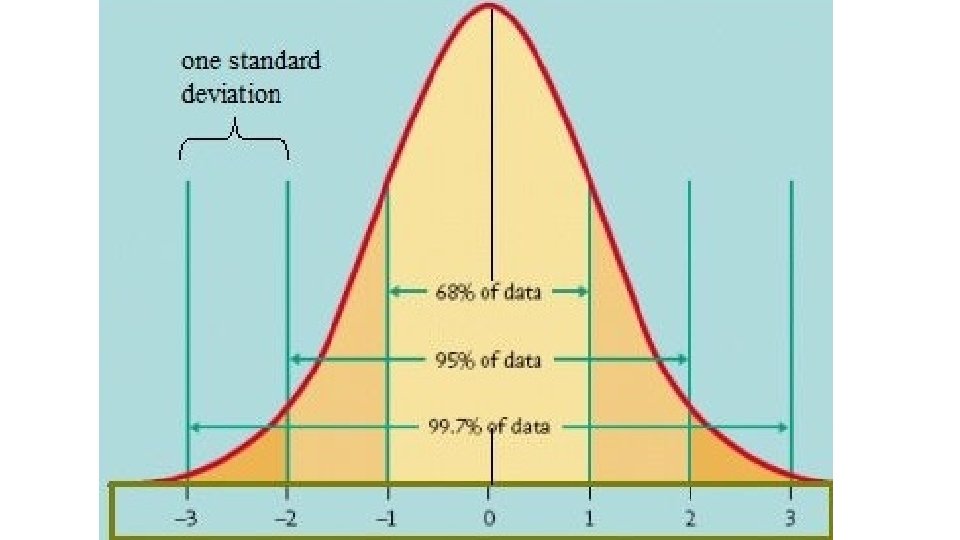
Descriptive Statistics Variability- how much the scores in a data set very from each other (range) and from the mean Standard Deviation- index of the amount of variability in a set of data
Find the mean, median, mode, range! 5, 10, 8, 5, 12, 19, 2, 3, 7, 5
Descriptive Statistics Correlation- exists when two variables are related to each other CORRELATION DOES NOT EQUAL CAUSATION!!!! Correlation coefficient- numerical index of the degree of relationship between two variables (-1. 00 to +1. 00) Scatterplots Direction (+/-) and strength
Descriptive Statistics Positive Correlation- 2 variables co-vary in the same direction High scores on variable X are associated with high scores on variable Y Negative Correlation- 2 variables co-vary in the same direction High scores on variable X are associated with low scores on variable Y
Descriptive Statistics 0= NO relationship -1. 00 or +1. 00= perfect As correlation increases in strength, the ability to predict 1 variable based on knowledge of other variable increases
Practice AP Exam Question Which of the following correlation coefficients most likely represents the relationship between the length of sleep deprivation and level of alertness? A. 1. 35 B. . 85 C. . 01 D. -0. 4 E. -1. 25
Inferential Statistics Statistically significant- indicates that research results are NOT likely due to chance. The pattern found in a sample likely generalizes to the broader population of interest that is being studied. Probability that the observed findings are due to chance is very LOW p <. 05
A researcher studying the effect of noise level on concentration randomly assigns student participants to either a noisy room or a quiet room to take a problem solving test. The researcher subsequently compares the two groups’ test scores and concludes p=05. The researcher’s conclusion that p=. 05 most likely indicates A that the difference in the two groups’ scores is likely due to chance B that a loss of concentration is common among students C the presence of a confounding variable D that the difference between the two groups is statistically significant E that noise has no effect on concentration
Evaluating Research is not 100% free from error Need replication to help identify and purge errors Sampling Bias- Sample is not representative of population (Random, Stratified) Placebo effect- participants expectation leads them to experience some change even when receiving fake, empty or ineffectual treatment Self-Report Bias- Subjects verbal accounts can show distortion Social desirability bias- tendency to give socially approved answers Misunderstanding questions, wording, memory error, response set Experimenter Bias- researchers expectations/preferences about outcome influence the results (unintentionally) Double Blind Procedure- experimenter and subjects in the dark about which subjects are experimental or control group
Correlation
Homework! 1 - Read 55 -64 if you did not already 2 - Look over my PPT on my website “Statistics” Take notes! 3 - Complete handout