STATISTICS PREPARED BY JOANA MAE ANTONIO JESSA LACUESTA

STATISTICS PREPARED BY: JOANA MAE ANTONIO JESSA LACUESTA EDMELYN OBISPO CLARISSA TOLENTINO

STATISTICS It is a science that deals with the collection, presentation, analysis, and interpretation of data. It is concerned not only with summarizing data but also with making inferences, which helps in predicting future outcomes.

TWO AREAS OF STATISTICS: DESCRIPTIVE STATISTICS - Deals with the methods of organizing, summarizing, and presenting a mass of data in order to yield meaningful information. INFERENTIAL STATISTICS - Deals with the methods concerned with the analysis of data, which allows making inferences or predictions about a body of data. Note that only a part of the data gathered is examined.

POPULATION - Refers to a group of individuals or entities that the researcher is interested to gather information or draw conclusions from.

SAMPLE - It is a part of a population or is a sub collection of elements drawn from a population.
:")
Variable: a characteristic about each individual element of a population or sample. Data (singular): the value of the variable associated with one element of a population or sample. This value may be a number, a word, or a symbol. Data (plural): the set of values collected for the variable from each of the elements belonging to the sample. Experiment: a planned activity whose results yield a set of data. Parameter: a numerical value summarizing all the data of an entire population. Statistic: a numerical value summarizing the sample data.

Example: A college dean is interested in learning about the average of faculty. . The population is all the faculty members at the college. A sample is any subset of that population. For example, we might select 10 faculty members and determine their age. The variable is the “age” of each faculty member. One data would be the age of a specific faculty member. The data would be the set of values in the sample. The experiment would be the method used to select the ages forming the sample and determining the actual age of each faculty member in the sample. The parameter of interest is the “average” age of all faculty at the college. The statistic is the “average” age for all faculty in the sample.

TWO KINDS OF VARIABLE: Qualitative, or Attribute, or Categorical, Variable: A variable that categorizes or describes an element of a population. Note: Arithmetic operations, such as addition and averaging, are not meaningful for data resulting from a qualitative variable. Quantitative, or Numerical, Variable: A variable that quantifies an element of a population. Note: Arithmetic operations such as addition and averaging, are meaningful for data resulting from a quantitative variable.
 or numerical (quantitative) variables.")
Example: Identify each of the following examples as attribute (qualitative) or numerical (quantitative) variables. 1. The residence hall for each student in a statistics class. (Attribute) 2. The amount of gasoline pumped by the next 10 customers at the local Unimart. (Numerical) 3. The amount of radon in the basement of each of 25 homes in a new development. (Numerical) 4. The color of the baseball cap worn by each of 20 students. (Attribute) 5. The length of time to complete a mathematics homework assignment. (Numerical) 6. The state in which each truck is registered when stopped and inspected at a weigh station. (Attribute)

Qualitative and quantitative variables may be further subdivided: Nominal Qualitative Ordinal Variable Discrete Quantitative Continuous
 an element of")
Nominal Variable: A qualitative variable that categorizes (or describes, or names) an element of a population. Ordinal Variable: A qualitative variable that incorporates an ordered position, or ranking. Discrete Variable: A quantitative variable that can assume a countable number of values. Intuitively, a discrete variable can assume values corresponding to isolated points along a line interval. That is, there is a gap between any two values. Continuous Variable: A quantitative variable that can assume an uncountable number of values. Intuitively, a continuous variable can assume any value along a line interval, including every possible value between any two values.

Note: 1. In many cases, a discrete and continuous variable may be distinguished by determining whether the variables are related to a count or a measurement. 2. Discrete variables are usually associated with counting. If the variable cannot be further subdivided, it is a clue that you are probably dealing with a discrete variable. 3. Continuous variables are usually associated with measurements. The values of discrete variables are only limited by your ability to measure them.

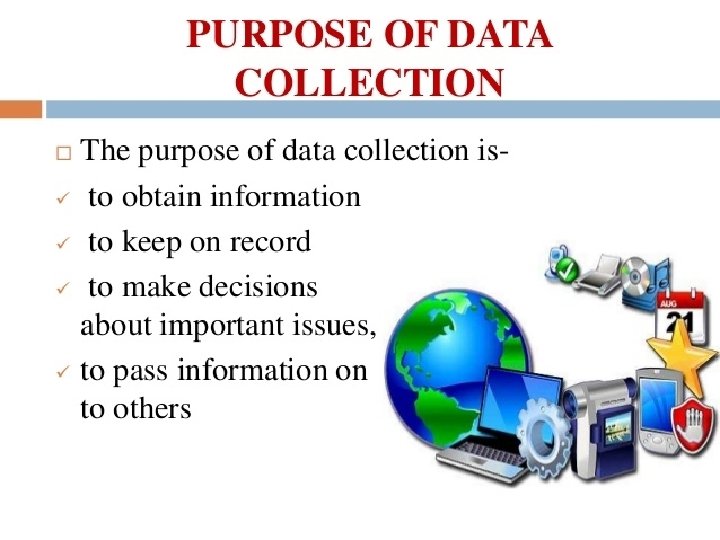
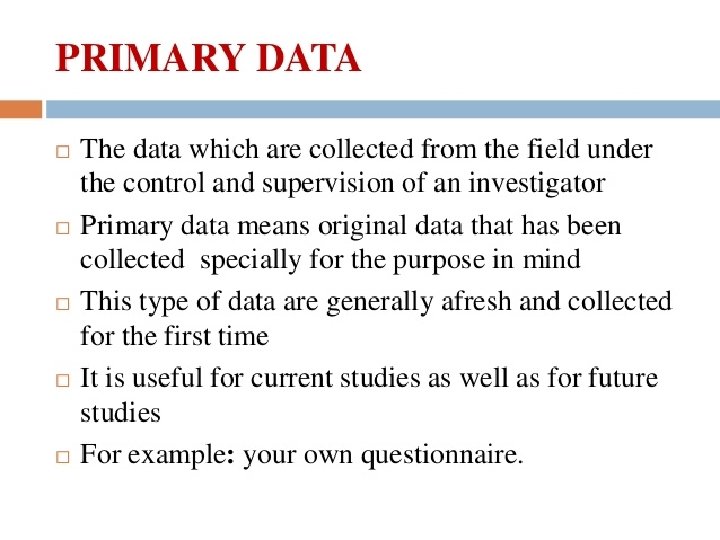
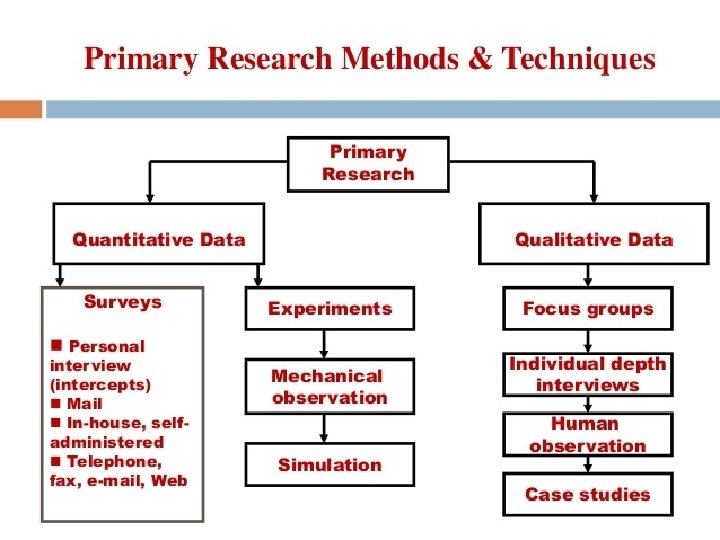
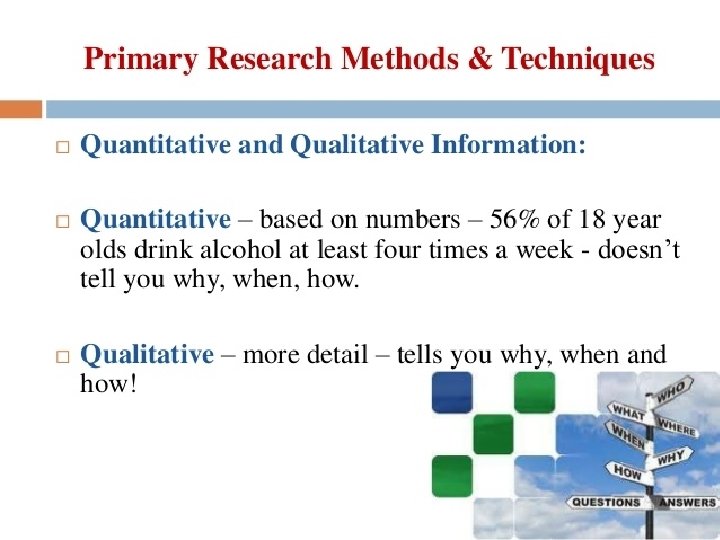
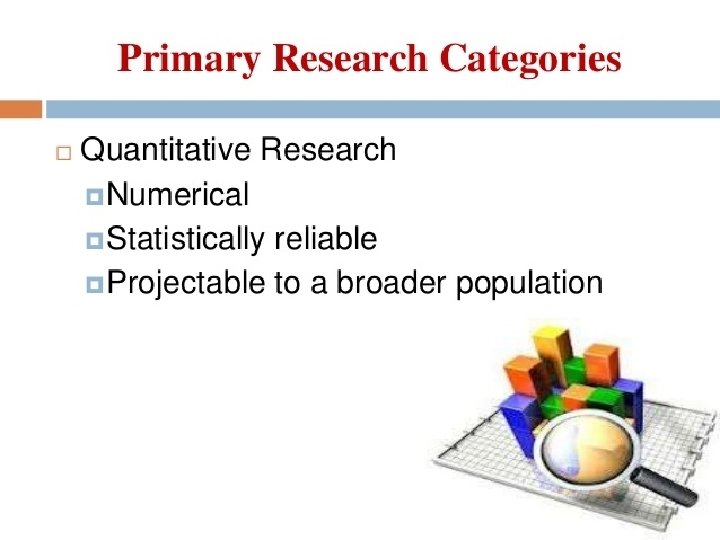
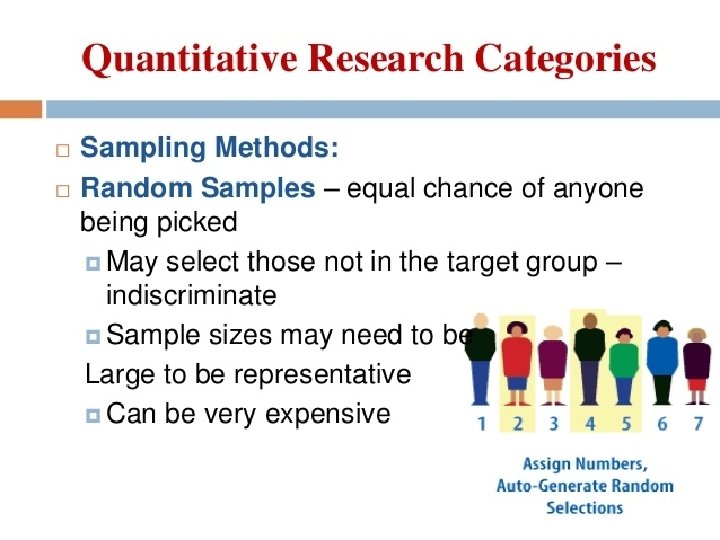
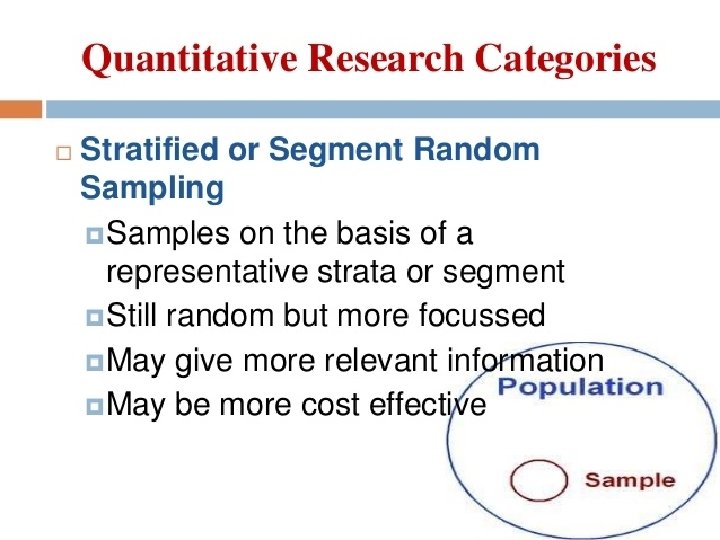
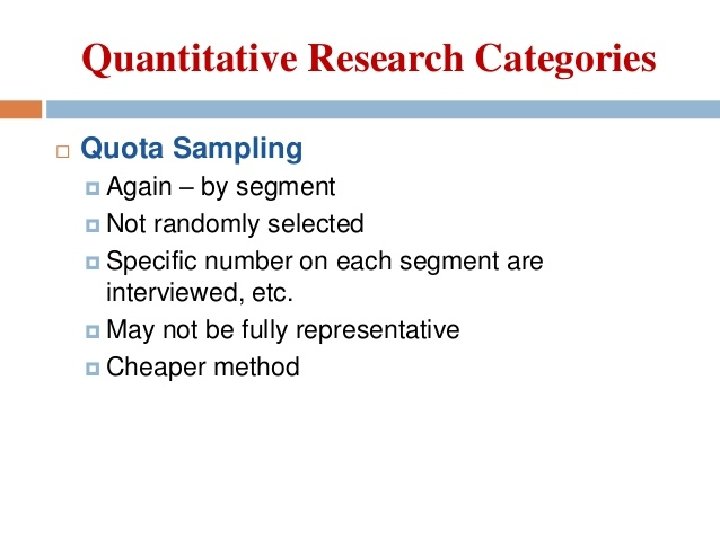
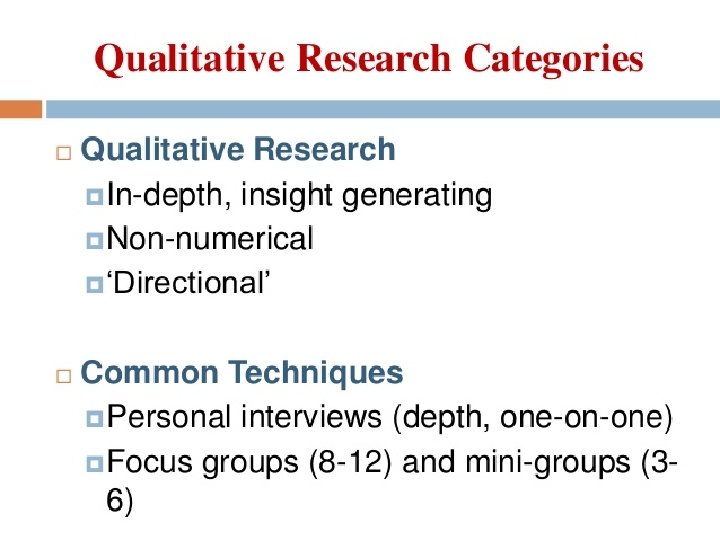
DATA COLLECTION

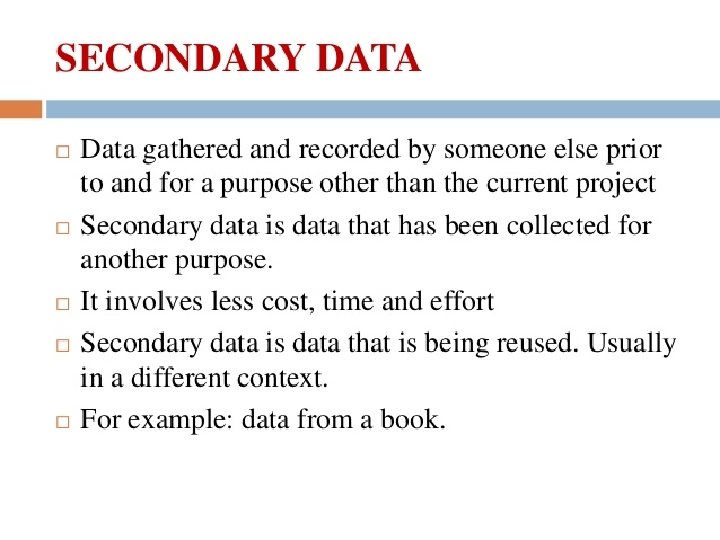


DISADVANTAGES OF SECONDARY DATA

THANK YOU FOR LISTENING! GOD BLESS
- Slides: 30