Statistics PepTalk for Senior Thesis Bill Menke Sept

Statistics Pep-Talk for Senior Thesis Bill Menke Sept 21, 2017

What would you conclude from this graph?
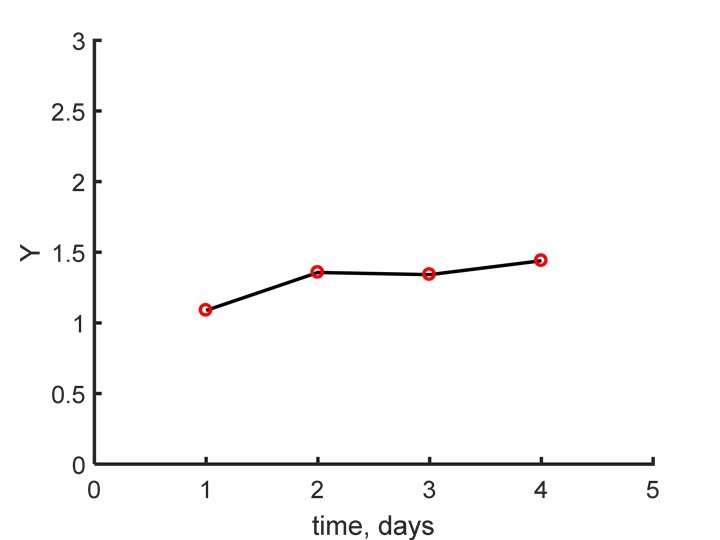

y l l a r e n ge d n e r t g n i increas

How about from this one?
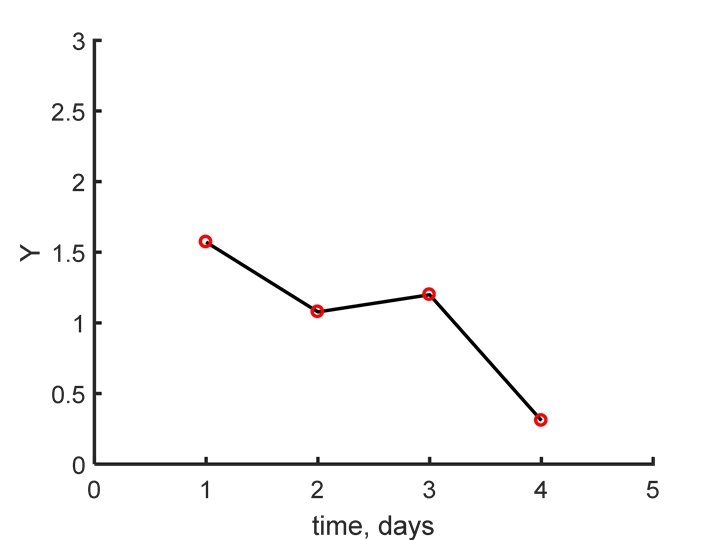

gen era lly d ecr e asi n g tr end

And this one?
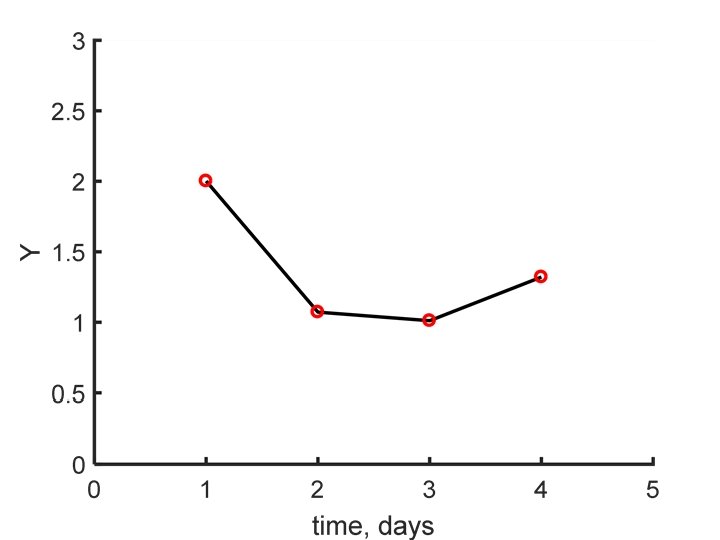

… wn do a a b nd p u ck

Actually these are just random data points with a mean value of 1 Here’s 20 realizations:
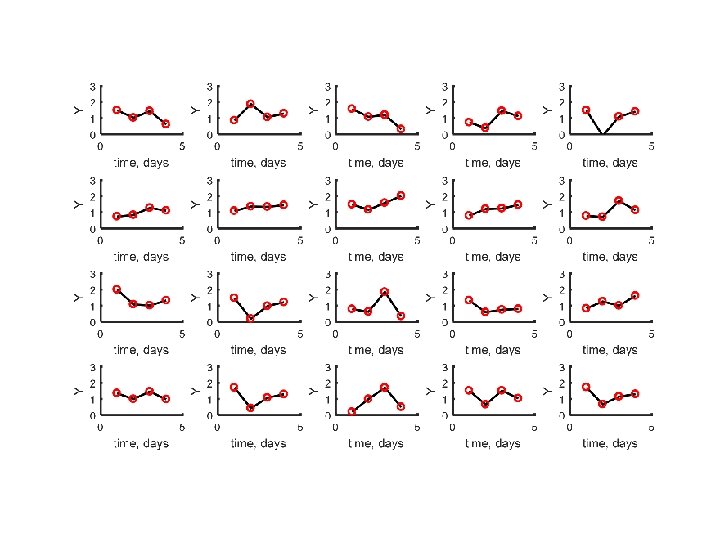

these are three I showed you

note that the “trends” are within the error bars always be cautious when the “trend” is within the error bar!

Y error bar

V the one measurement that I made

V had I made the measurement 100 times, about 95 of them would have fallen in this range

V probabiuity of measurement 95% V

95% confidence The minimum standard in science particle physicists use 99. 98%

A Worst Case Scenario
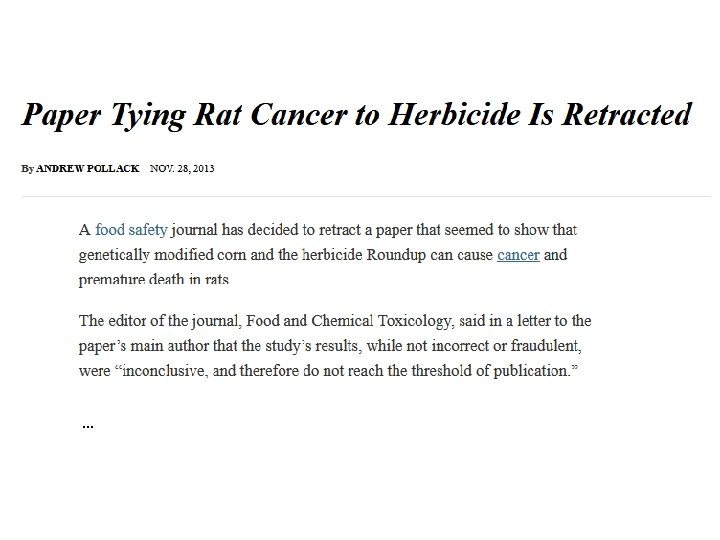

the scientists said: genetically modified corn and the herbicide Roundup can cause cancer and premature death in rats

the editor said: inconclusive, and therefore do not reach the threshold of publication

The Experiment* Experimental Group 10 Rats Control Group 10 Rats Fed GMO Corn Fed “Organic” Corn *somewhat simplified, actual experiment had several experimental groups

The Observations Experimental Group 10 Rats Control Group 10 Rats 7 Developed Large Tumors 3 Developed Large Tumors

Reality Check Control Group 10 Rats Does something here strike you as a bit odd? 3 Developed Large Tumors

Reality Check normal rats eating healthy food develop tumors at a much lower rate than this! Control Group 10 Rats 3 Developed Large Tumors

Reality Check The scientists used rats that were genetically modified to be especially predisposed to develop tumors Control Group 10 Rats 3 Developed Large Tumors

Reality Check kind of ironic Control Group 10 Rats using genetically modified rats to study geneticcally modified food! 3 Developed Large Tumors

rate data analysis: the rat “counts” were used to estimate a “rate” of tumors that a larger population might experience: 3 rats in 10 → 30% 7 rats in 10 → 70% 100% 50% 0%

rate Conclusion: Rate of developing Tumors much higher in the experimental group! 100% 50% 0%

Rate of developing Tumors much higher in the experimental group! rate Is this conclusion warranted? 100% experimental group 50% control group 0%

rate What is this plot missing? 100% experimental group 50% control group 0%
 100% experimental group 50% control group 0%")
Confidence Intervals! rate (= error bars) 100% experimental group 50% control group 0%

rate Confidence Intervals! 100% experimental group 50% note that the error bars overlap control group 0%

rate Confidence Intervals! 100% experimental group 50% control group 0% always be cautious when the error bars overlap!

Experimental Hypothesis The Experimental Group has a higher rate of developing tumors than the Control Group

Null Hypothesis Both Experimental and Control Groups have Equal Rates of 50%

Obtaining Knowledge show that the Null Hypothesis is unlikely

What is the probability that the difference in the number of rats with tumors between the two groups will be greater than or equal to 4 when the true rate is for both groups is 50%

Statistical Test Answer: 10%

Statistical Test Answer: p-value = 10% the probability, under the null hypothesis, of obtaining a result equal to or more extreme than what was actually observed

Null Hypothesis Cannot be rejected to 95% or greater confidence since 10% of the time, the null hypothesis leads to differences >= 4

Null Hypothesis So the experiment does not prove that Eating GMO corn increases the rate of tumors (it doesn’t disprove it, either)
 Discuss accuracy of measurements (B) Develop confidence intervals for all primary")
Thesis Goals (A) Discuss accuracy of measurements (B) Develop confidence intervals for all primary measurements Error on graphs! value ± error (95%) in text & tables! (C) Develop confidence intervals for all derived values (C) clearly stated experimental hypothesis and null hypothesis (D) p-value for null hypothesis (E) discussion of significance
 Accuracy of measurements understand where your error comes from analytic accuracy un-modeled physical")
(A) Accuracy of measurements understand where your error comes from analytic accuracy un-modeled physical processes un-modeled annual counting statistics fluctuations
 Confidence intervals for all derived values (in this case the warming trend) Error")
(B) Confidence intervals for all derived values (in this case the warming trend) Error in data -> Error in Trend warming trend 0. 05 ± 0. 01 (95%) deg/year
 clearly stated experimental and null hypothesis don’t assume the reader can figure them")
(C) clearly stated experimental and null hypothesis don’t assume the reader can figure them out! experimental hypothesis should be guided by the goals of your thesis the significance of your results can depend on using correct null hypothesis consider possibilities thoughtfully
 p-value for null hypothesis many possible statistical tests available seek help for choosing")
(D) p-value for null hypothesis many possible statistical tests available seek help for choosing the right one colleagues, fellow students statistics help desk books, the web
 discussion of significance what have you learned that you can be really certain")
(E) discussion of significance what have you learned that you can be really certain about what might be ‘suggestive’ but not ‘proven’ (might warrant later follow-up)
- Slides: 50