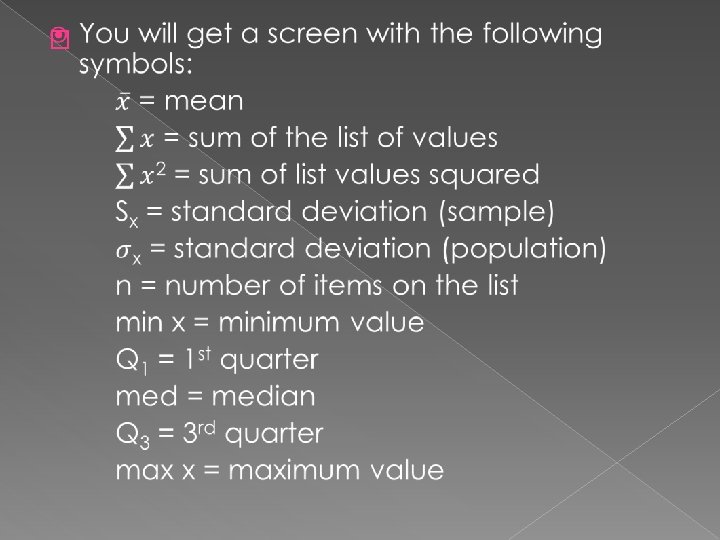
STATISTICS Mean and Standard Deviation 1 This is


 This is where all your given values go 4) Square your 2 nd")


 Scores below → Shade. Norm (-E 99, score)")


- Slides: 23
STATISTICS
Mean and Standard Deviation �
1) This is where all your given values go 4) Square your 2 nd column values 3) Take each value in column #1 and subtract the mean 2) Add up all your values and divide by the total number 5) Add up your 3 rd column values
ex: The marks for five tests in Math class were as follows. Find the mean and standard deviation. 94 56 89 67 84 94 16 256 56 -22 484 89 11 121 67 -11 121 84 6 36 78 1018
� An easier way to do the table is by using a function in your calculator. � To do this we simply plug in the values given into L 1 and then go STAT → CALC → 1 varsstats → enter → 2 nd 1 → enter.
� Stand. Dev. = 10. 94
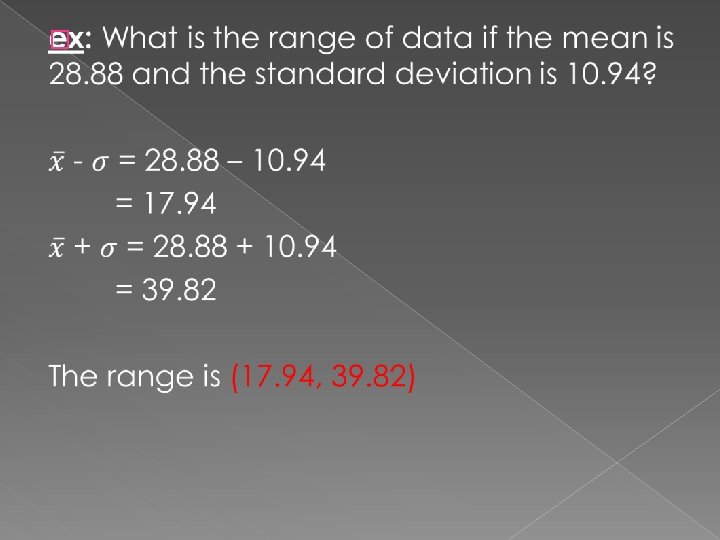
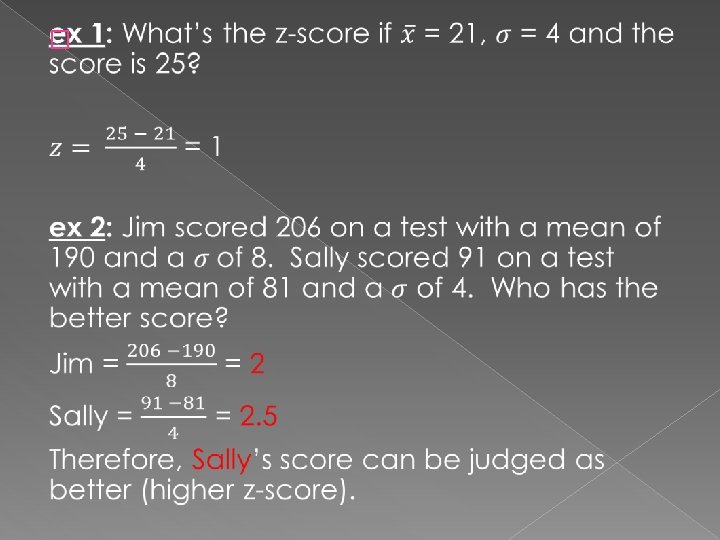
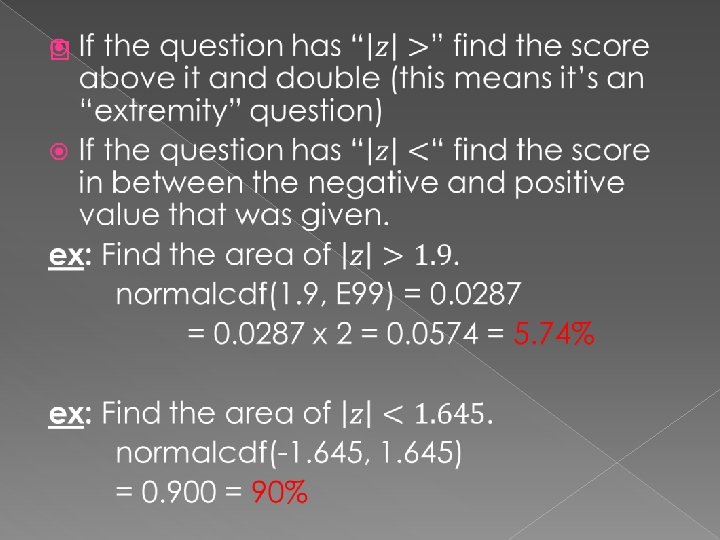
Ranges and Standardized Scores �
� Use when solving for a z-score Use when given a z-score
The Normal Curve � 68% 95% 99%
� On your calculator, you can draw normal curves using “Shade Norm” 2 nd Vars → Draw → 1: Shade Norm � Our window settings must be at xmin = -5, xmax = 5, ymin = -0. 5, ymax = 1, yscl = 0. 1 � Your calculator will then give you a picture that is shaded an area value. � The area tells you the percent of scores that fall within the boundaries you set � x = 0 is your mean.
� To use Shade Norm: a) Scores below → Shade. Norm (-E 99, score) b) Scores above → Shade. Norm (score, E 99) c) Scores between → Shade. Norm (low score, high score) ex: What % of score lie below 1. 1? Sketch a diagram Shade. Norm (-E 99, 1. 1) Area = 0. 8643 = 86. 43%
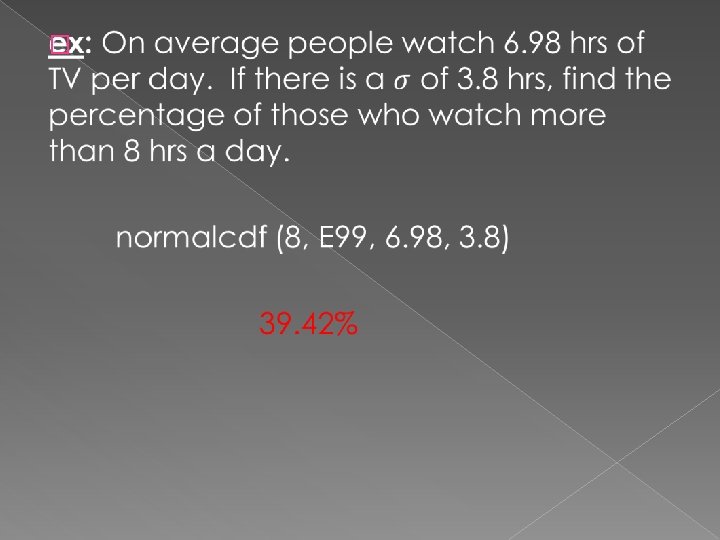
� If you don’t need to sketch, you can use 2 nd Vars → 2: normal cdf
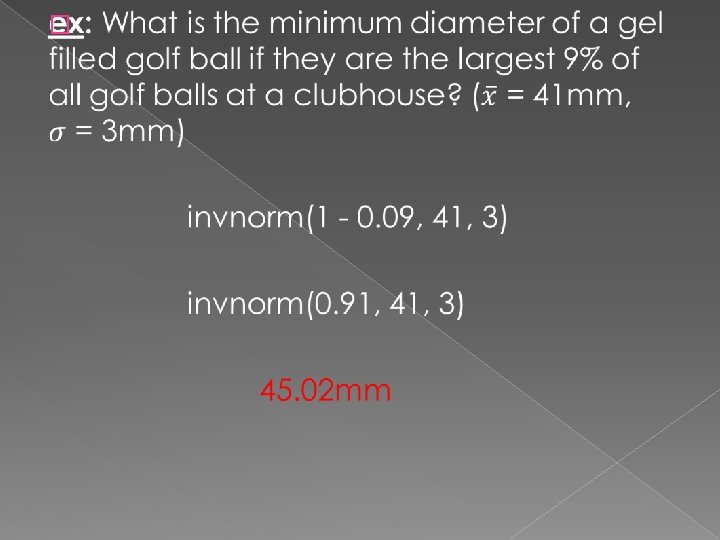
Real Life Distributions �
� Change % to decimals!
Binomial Distributions and Confidence Intervals �
� Once we’ve calculated the mean and standard deviation, use: STAT → TESTS → A: 1 -Prop. ZInt � Then we must change the range the calculator gives us to actual items by multiplying the decimals by the number of subjects. � Remember to raise the lower bound up and reduce the upper bound down
� = 4. 18 600 x 0. 01635 = 9. 81= 10 600 x 0. 04365 = 26. 19 = 26 (10, 26)