
Statistics in Debate Noah Mengisteab Barry Corcoran What
Statistics in Debate Noah Mengisteab & Barry Corcoran
What is statistics?
Statistics ● “A means by which a set of data may be described and interpreted in a meaningful way. . . A method by which data can be analyzed and inferences and conclusions drawn. ” - Statistics for Dummies 101
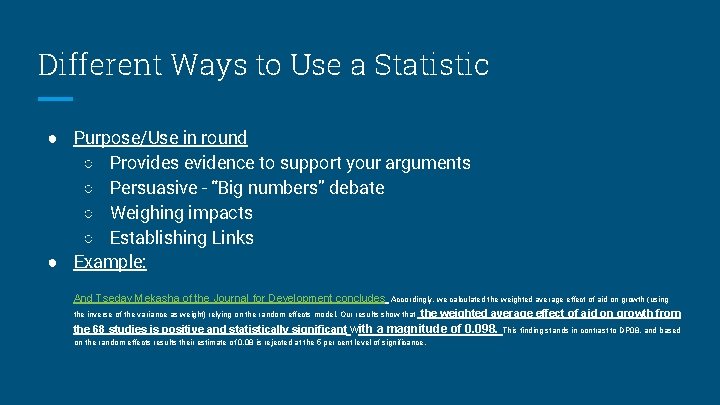
Different Ways to Use a Statistic ● Purpose/Use in round ○ Provides evidence to support your arguments ○ Persuasive - “Big numbers” debate ○ Weighing impacts ○ Establishing Links ● Example: And Tseday Mekasha of the Journal for Development concludes Accordingly, we calculated the weighted average effect of aid on growth (using the inverse of the variance as weight) relying on the random effects model. Our results show that the weighted average effect of aid on growth from the 68 studies is positive and statistically significant with a magnitude of 0. 098. on the random effects results their estimate of 0. 08 is rejected at the 5 per cent level of significance. This finding stands in contrast to DP 08, and based
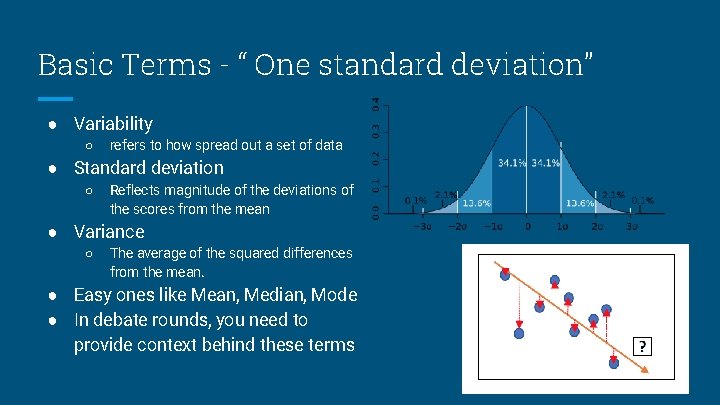
Basic Terms - “ One standard deviation” ● Variability ○ refers to how spread out a set of data ● Standard deviation ○ Reflects magnitude of the deviations of the scores from the mean ● Variance ○ The average of the squared differences from the mean. ● Easy ones like Mean, Median, Mode ● In debate rounds, you need to provide context behind these terms
Finding a Statistic to Use
What’s your Source? Who’s the author? Reputation? Credentials? Where is the study from? Are there other studies that have similar results? ● Is it a meta-study? ● Have you considered counterstudies? ● ● ●
Background of Data & Methodology ● Data is a product of research ○ It’s not a random number that falls from the debate gods for you to use to win a round ● Before you consider using a stat in a round, you need to understand the background and methodology ○ ○ Background: research question, hypothesis Methodology: the process the research team took to find their results ■ Read & cut the methodology
Causality ● The point of research is to establish causality ● Don’t confuse correlation w/ causation ● When using a stat, you need to consider if the research effectively found the causal link ○ ○ IV causing DV DV causing IV Endogenous relationship ■ wealth pays for edu which gives you skills to make more money (both at the same time) Spurious relationship ■ 3 rd factor that makes variables seem related but not really
Interpretation ● It DOES NOT MATTER what you think a statistic might mean ○ ○ ○ Author’s interpretation is what you need to consider It’s the evidence you are providing to support your claim You are not a researcher; just a debater. ● Reading the full Results and Conclusion sections allows you to grasp what the author interprets the results to be.
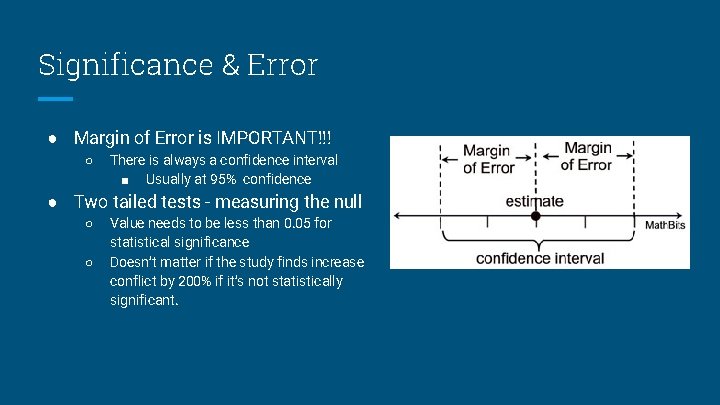
Significance & Error ● Margin of Error is IMPORTANT!!! ○ There is always a confidence interval ■ Usually at 95% confidence ● Two tailed tests - measuring the null ○ ○ Value needs to be less than 0. 05 for statistical significance Doesn’t matter if the study finds increase conflict by 200% if it’s not statistically significant.
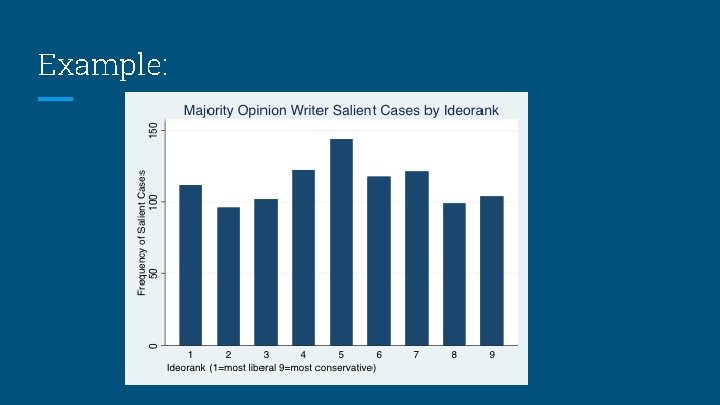
Example:
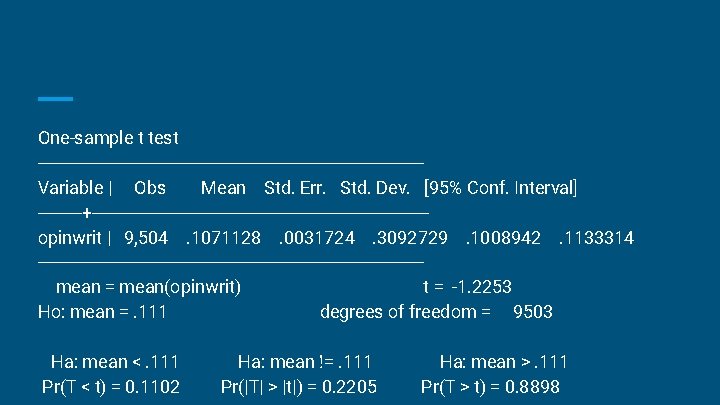
One-sample t test ---------------------------------------Variable | Obs Mean Std. Err. Std. Dev. [95% Conf. Interval] -----+----------------------------------opinwrit | 9, 504. 1071128. 0031724. 3092729. 1008942. 1133314 ---------------------------------------mean = mean(opinwrit) t = -1. 2253 Ho: mean =. 111 degrees of freedom = 9503 Ha: mean <. 111 Pr(T < t) = 0. 1102 Ha: mean !=. 111 Pr(|T| > |t|) = 0. 2205 Ha: mean >. 111 Pr(T > t) = 0. 8898

Ethics…. BE ETHICAL
- Slides: 14