Statistics Hypothesis Testing for the mean when sigma


 at 5% significance level.")


")
- Slides: 19
Statistics Hypothesis Testing for the mean when sigma is known.
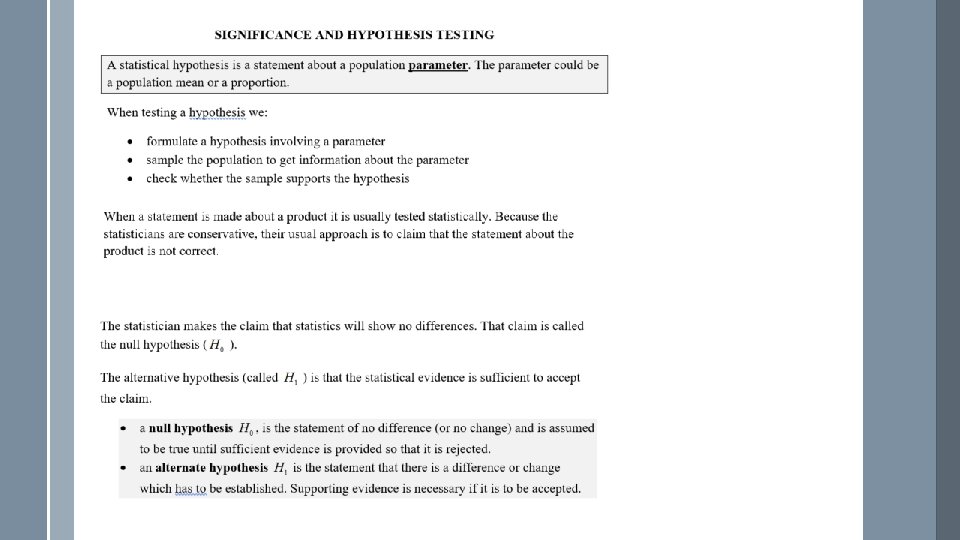
For a sample of size n and mean population with mean , could it come from a Null Hypothesis Ho is the statement of no difference and it is assumed to be true until sufficient evidence is provided for it to be ejected. Alternative Hypothesis H 1 is the statement of difference which has to be established.
two-tailed one-tailed Two-tailed accept Ho critical values reject Ho area of rejection = significance level area of acceptance = confidence interval
Example 1. Given significance level if test Ho at the 5% is thought to be 10. use z-interval as sigma is known. so accept Ho. What about at 10% significance? so reject Ho, accept H 1 at 10% significance.
Method 2: Use GDC Stat Tests: 1: z Test We look at p-value. It needs to be greater than significance level. accept Ho at 5% significance but reject Ho, accept H 1 at 10% significance.
Confidence intervals can be used for 2 -tailed tests but not for 1 -tailed.
Example 2: Choco bars claim to have a mean mass of 102. 5 g. A random sample of 12 bars had a mean mass of 101. 4 g. Test the manufacturer’s claim at 5% significance level, whether the mean mass of all Choco bars is less than 102. 5 g. Assume that the mass of a Choco bar is normally distributed with variance 2. 89. test statistics Method 1: GDC so reject Ho (or accept H 1) at 5% significance level.
Method 2: Critical value Where is the 5% boundary? 0. 05 102. 5 Critical value =101. 692 101. 4<101. 692 so the test statistics is in rejection region, reject Ho, accept H 1:
Method 3: p-Value so reject Ho (or accept H 1) at 5% significance level.
Hypothesis Testing A hypothesis is a conjecture about a population. Typically, these hypotheses will be stated in terms of a parameter. A test of hypothesis is a statistical procedure used to make a decision about the conjectured value of a parameter. We will make our decision based on observed values of a statistic.
• The purpose of hypothesis testing is to determine whethere is enough statistical evidence in favour of a certain belief about a parameter. • Examples – Is there statistical evidence in a random sample of potential customers, that support the hypothesis that more than 10% of the potential customers will purchase a new products? – Is a new drug effective in curing a certain disease? A sample of patients is randomly selected. Half of them are given the drug while the other half are given a placebo. The improvement in the patients conditions is then measured and compared.
The Hypotheses There are two hypotheses which we are comparing. The null hypothesis, H 0, specifies a value of a parameter. This hypothesis is assumed to be true, and the collected data will be analyzed to see if it is contradictory to the null hypothesis. The alternative hypothesis, H 1, gives an opposing statement about the value of the parameter. The collected data will be analysed to see if it supports the alternative hypothesis.
Consider the following example: Visitors to the West Coast of the South Island of New Zealand are often bitten by sandflies. A new product to repel sandflies has the statement ‘will repel sandflies for an average protection time of more than six hours’ printed on its label. The current most popular brands offer ‘protection for 6 hours’. The government tourist department wishes to preserve the tourist trade. Anxious to provide the best sandfly protection possible, they decide to test the manufacturer’s claim. How can they test the claim?
The process of testing hypotheses can be compared to court trials. A person comes into court charged with a crime. A jury must decide whether the person is innocent (null hypothesis) or guilty (alternative hypothesis). Even though the person is charged with the crime, at the beginning of the trial (and until the jury declares otherwise) the accused is assumed to be innocent. Only if overwhelming evidence of the person's guilt can be shown is the jury expected to declare the person guilty-otherwise the person is considered innocent. Errors In the jury trial there are two types of errors: (1) the person is innocent but the jury finds the person guilty, and (2) the person is guilty but the jury declares the person to be innocent. In our system of justice, the first error is considered more serious than the second error. These two errors along with the correct decisions are shown in the next table where the jury decision is shown in bold on the left margin and the true state of affairs is shown in bold along the top margin of the table.
One-tail test Two-tail test One-tail test
Concepts of Hypothesis Testing • The critical concepts of hypothesis testing. – Example: • An operation manager needs to determine if the mean demand during lead time is greater than 350. • If so, changes in the ordering policy are needed. – There are two hypotheses about a population mean: • H 0: The null hypothesis m = 350 • Ha: The alternative hypothesis m > 350 i This ou y t a s wh w rove p o t ant
Hypothesis Testing using z-Test GDC For example A sample of 10 crates of items is taken from a factory which states that the mean number of defective items per crate is 12. The sample mean of the ten crates is found to be 13. Knowing that the standard deviation of the number of defective items is 1. 6, test the hypothesis that the mean is more than 12: (a) at the 10% level of significance H 0: m = 12 (b) at the 1% level of significance H 1: m > 12 Use GDC p-value
Using GDC z-Test H 0: m = 12 H 1: m > 12 (a) so testing at the 10% level of significance we see that 2. 5%<10% so we reject H 0 in favour of H 1, the mean number of defective items is greater than 12. (b) testing at the 1% level of significance we see that 2. 5%>1% so there is insufficient evidence to reject H 0. We accept that the manufacturer’s claim that the mean number of defective items is 12.