Statistics for Microarrays Biological background Gene Expression and

Statistics for Microarrays Biological background: Gene Expression and Molecular Laboratory Techniques Class web site: http: //statwww. epfl. ch/davison/teaching/Microarrays/

Basic principles in physics, chemistry and biology Principles Known? Physics Chemistry Biology Matter Compound Organism Elementary Particles Elements Genes Yes No

Central Paradigm
")
(RT)
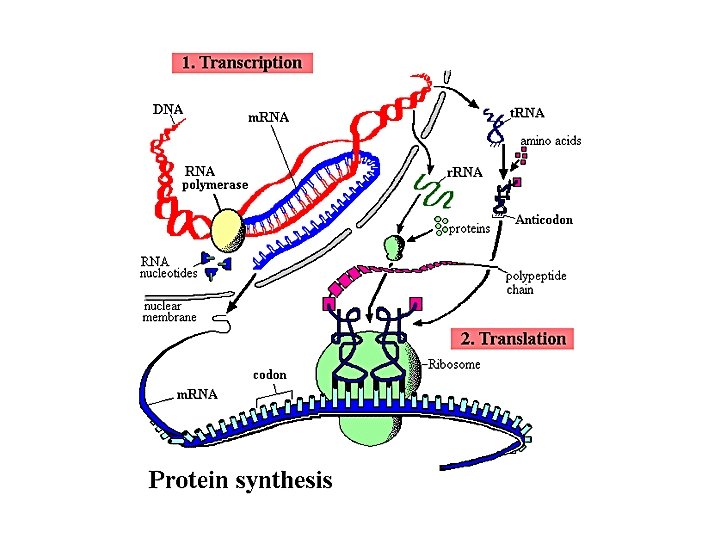

Protein Synthesis
")
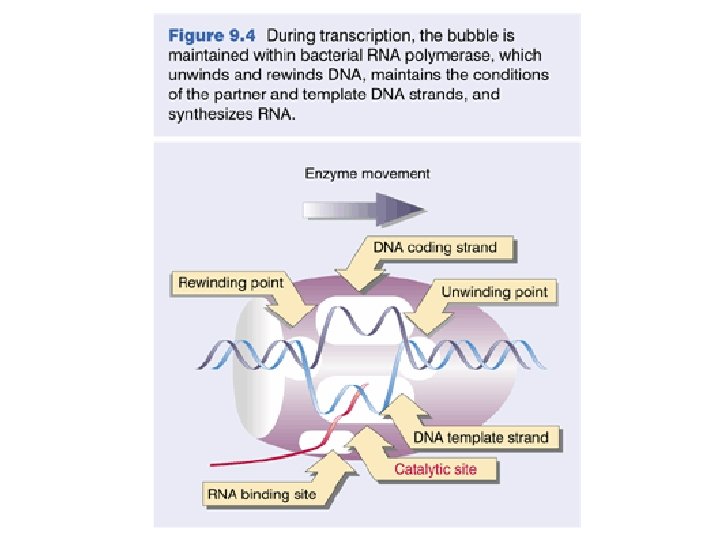
Transcription • Transcription is a complex process involving several steps and many proteins (enzymes) • RNA polymerase synthesizes a single strand of RNA against the DNA template strand (anti-sense strand), adding nucleotides to the 3’ end of the RNA chain • Initiation is regulated by transcription factors, including promoters, usually an initiator element and TATA box, usually lying just upstream (at the 5’ end) of the coding region • 3’ end cleaved at AAUAAA, poly-A tail added

Exons and Introns • Most of the genome consists of non-coding regions • Some non-coding regions (centromeres and telomeres) may have specific chomosomal functions • Other non-coding regions have regulatory purposes • Non-coding, non-functional DNA often called junk DNA, but may have some effect on biological functions • The terms exon and intron refer to coding and non-coding DNA, respectively

Intron Splicing

Transcription Overview

Transcription Illustration

Translation • The AUG start codon is recognized by methionyl-t. RNAi. Met • Once the start codon has been identified, the ribosome incorporates amino acids into a polypeptide chain • RNA is decoded by t. RNA (transfer RNA) molecules, which each transport specific amino acids to the growing chain • Translation ends when a stop codon (UAA, UAG, UGA) is reached

Translation Illustrated

From Primary Transcript to Protein
 • How is it possible that there are over 1,")
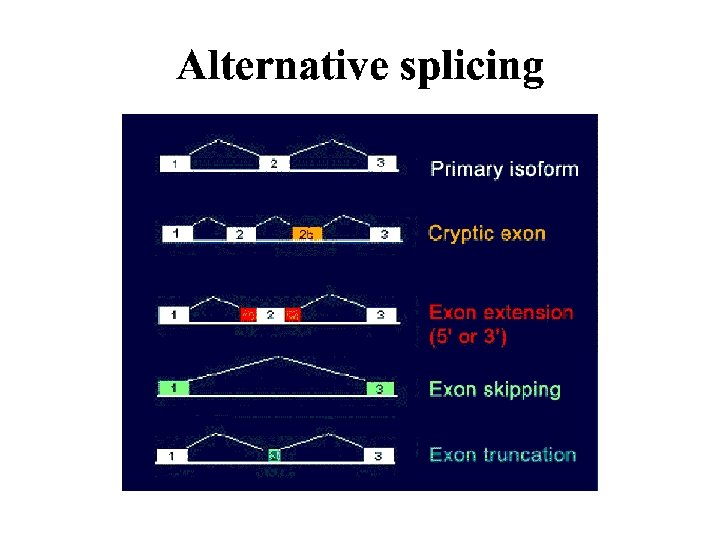
Alternative Splicing (of Exons) • How is it possible that there are over 1, 000 human antibodies when there are only about 30, 000 genes? • Alternative splicing refers to the different ways the exons of a gene may be combined, producing different forms of proteins within the same gene-coding region • Alternative pre-m. RNA splicing is an important mechanism for regulating gene expression in higher eukaryotes

Molecular Laboratory Techniques • Hybridizing DNA • Copying DNA • Cutting DNA • Probing DNA

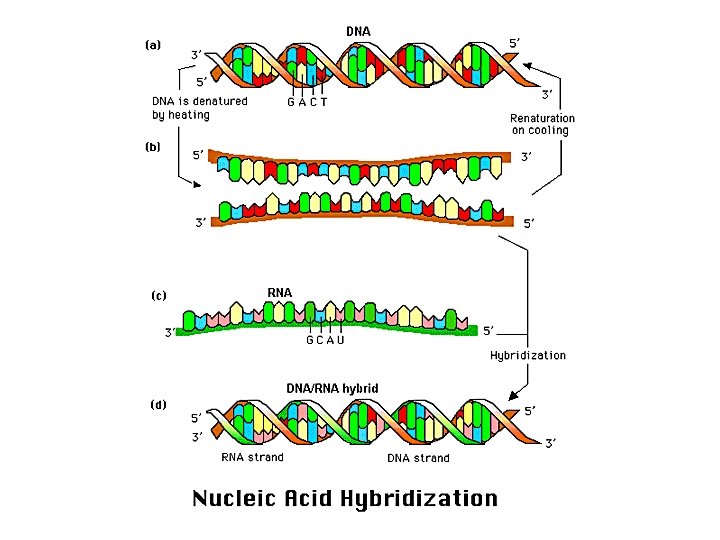
Hybridization • Hybridization exploits a potent feature of the DNA duplex – the sequence complementarity of the two strands • Remarkably, DNA can reassemble with perfect fidelity from separated strands • Strands can be separated (denatured) by heating
 • PCR is used to amplify (copy) specific DNA sequences")
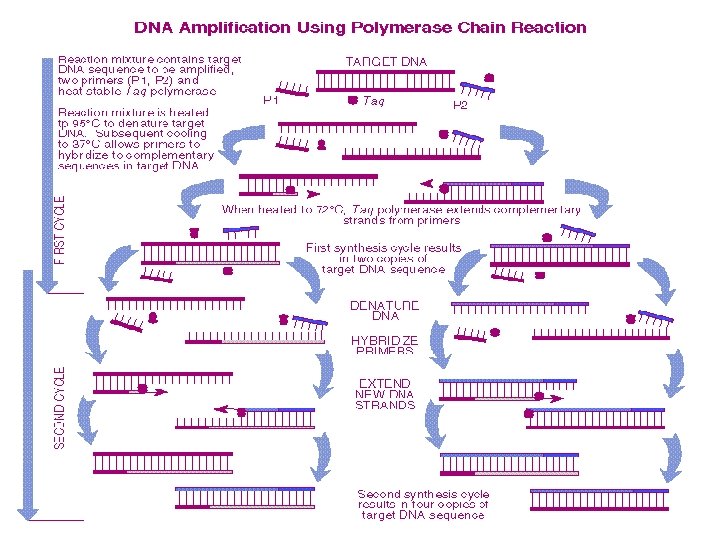
Polymerase Chain Reaction (PCR) • PCR is used to amplify (copy) specific DNA sequences in a complex mixture when the ends of the sequence are known • Source DNA is denatured into single strands • Two synthetic oligonucleotides complementary to the 3’ ends of the segment of interest are added in great excess to the denatured DNA, then the temperature is lowered • The genomic DNA remains denatured, because the complementary strands are at too low a concentration to encounter each other during the period of incubation, but the specific oligonucleotides hybridize with their complementary sequences in the genomic DNA

PCR, ctd • The hybridized oligos then serve as primers for DNA synthesis, which begins upon addition of a supply of nucleotides and a temperature resistant polymerase such as Taq polymerase, from Thermus aquaticus (a bacterium that lives in hot springs) • Taq polymerase extends the primers at temperatures up to 72˚C • When synthesis is complete, the whole mixture is heated further (to 95˚C) to melt the newly formed duplexes • Repeated cycles (25— 30) of synthesis (cooling) and melting (heating) quickly provide many DNA copies
")
(BREAK)

Types of Viruses A virus is a nucleic acid in a protein coat. Reverse transcriptase makes a complementary DNA copy from RNA.

Reverse transcription Clone c. DNA strands, complementary to the m. RNA GUAAUCCUC Reverse transcriptase c. DNA TT AG GA G CA TTA AG GG G A GA G C ACTATTAAG CA TTAT GTG GAG A G CT A TTA G CC G GG AAGG T A G A T T A G CATTAGGAG CA

RT-PCR

Restriction Enzymes Cut DNA

Restriction Enzymes • When a bacterium is invaded by a DNAcontaining organism (e. g. virus), it can defend itself with restriction enzymes (REs; also called restriction endonucleases) • REs recognize a specific short sequence of DNA and cut both strands • The recognition sequence is typically a palindrome – i. e. the sequence in one strand is the same as in the other, read in the other direction (e. g. GAATTC) • REs named after the bacteria in which they occur, plus sequence number (e. g. Eco RI)
 (cut) 5’ – GAATTC – 3’ 3’ – CTTAAG –")
RE Example (Eco RI) (cut) 5’ – GAATTC – 3’ 3’ – CTTAAG – 5’ (cut)

Probing DNA • One way to study a specific DNA fragment within a genome is to probe for the sequence of the fragment • A probe is a labeled (usually radioactive or fluorescent) single-stranded oligonucleotide, synthesized to be complementary to the sequence of interest – probe sequence is known • Attach single-stranded DNA to a membrane (or other solid support) and incubate with the probe so that it hybridizes • Visualize the probe (e. g. by X-ray for radioactive probes)

The Southern blotting technique
")
Sample Autoradiogragh (Gel)

Types of Blots • Southern Blot – use DNA to probe DNA • Northern Blot – use DNA to probe RNA • Western Blot – use antibodies to probe Protein

Measuring Gene Expression Idea: measure the amount of m. RNA to see which genes are being expressed in (used by) the cell. Measuring protein would be more direct, but is currently harder.

Microarrays provide a means to measure gene expression
 sample")
Areas Being Studied with Microarrays • Differential gene expression between two (or more) sample types • Similar gene expression across treatments • Tumor sub-class identification using gene expression profiles • Classification of malignancies into known classes • Identification of “marker” genes that characterize different tumor classes • Identification of genes associated with clinical outcomes (e. g. survival)

c. DNA microarray experiments m. RNA levels compared in many different contexts • Different tissues, same organism (brain v. liver) • Same tissue, same organism (ttt v. ctl, tumor v. non -tumor) • Same tissue, different organisms (wt v. ko, tg, or mutant) • Time course experiments (effect of ttt, development)

Web animation of a c. DNA microarray experiment http: //www. bio. davidson. edu/courses/genomics/chip/ chip. html

Yeast genome on a chip

Brief outline of steps for producing a microarray • c. DNA probes attached or synthesized to solid support • Hybridize targets • Scan array

c. DNA microarrays c. DNA clones

c. DNA microarrays Compare the genetic expression in two samples of cells PRINT c. DNA from one gene on each spot SAMPLES c. DNA labelled red/green e. g. treatment / control normal / tumor tissue

HYBRIDIZE Add equal amounts of labelled c. DNA samples to microarray. SCAN Laser Detector

Quantification of expression For each spot on the slide we calculate Red intensity = Rfg - Rbg (fg = foreground, bg = background) and Green intensity = Gfg - Gbg and combine them in the log (base 2) ratio Log 2( Red intensity / Green intensity)
, n")
Gene Expression Data On p genes for n slides: p is O(10, 000), n is O(10100), but growing, Slides Genes 1 2 3 4 5 slide 1 slide 2 slide 3 slide 4 slide 5 … 0. 46 -0. 10 0. 15 -0. 45 -0. 06 0. 30 0. 49 0. 74 -1. 03 1. 06 0. 80 0. 24 0. 04 -0. 79 1. 35 1. 51 0. 06 0. 10 -0. 56 1. 09 0. 90 0. 46 0. 20 -0. 32 -1. 09 . . . . Gene expression level of gene 5 in slide 4 = Log 2( Red intensity / Green intensity) These values are conventionally displayed on a red (>0) yellow (0) green (<0) scale.

Biological question Differentially expressed genes Sample class prediction etc. Experimental design Microarray experiment 16 -bit TIFF files Image analysis (Rfg, Rbg), (Gfg, Gbg) Normalization R, G Estimation Testing Clustering Biological verification and interpretation Discrimination
- Slides: 47