
Statistics for Everyone Workshop Fall 2010 Part 4
- Slides: 58
Statistics for Everyone Workshop Fall 2010 Part 4 A One-Way Analysis of Variance: Comparing 2 or More Levels of a Variable Workshop by Linda Henkel and Laura Mc. Sweeney of Fairfield University Funded by the Core Integration Initiative and the Center for Academic Excellence at Fairfield University
Statistics as a Tool in Scientific Research: Comparing 2 or More Conditions With ANOVA Use t test if two conditions in experiment (independent samples or repeated measures t test depending on design) Use F test (ANOVA) if two or more conditions (independent samples or repeated measures ANOVA depending on design); F test with two levels yields identical conclusions to t test with two levels # factors = # IVs = # “ways” (e. g. , one-way ANOVA; two -way ANOVA; three-way ANOVA)
Statistics as a Tool in Scientific Research: Comparing Conditions With ANOVA Types of Research Questions • Descriptive (What does X look like? ) • Correlational (Is there an association between X and Y? As X increases, what does Y do? ) • Experimental (Do changes in X cause changes in Y? )
Statistics as a Tool in Scientific Research Start with the science and use statistics as a tool to answer the research question Get your students to formulate a research question: • How often does this happen? • Did all plants/people/chemicals act the same? • What happens when I add more sunlight, give more praise, pour in more water?
Types of Statistical Procedures Descriptive: Organize and summarize data Inferential: Draw inferences about the relations between variables; use samples to generalize to the population
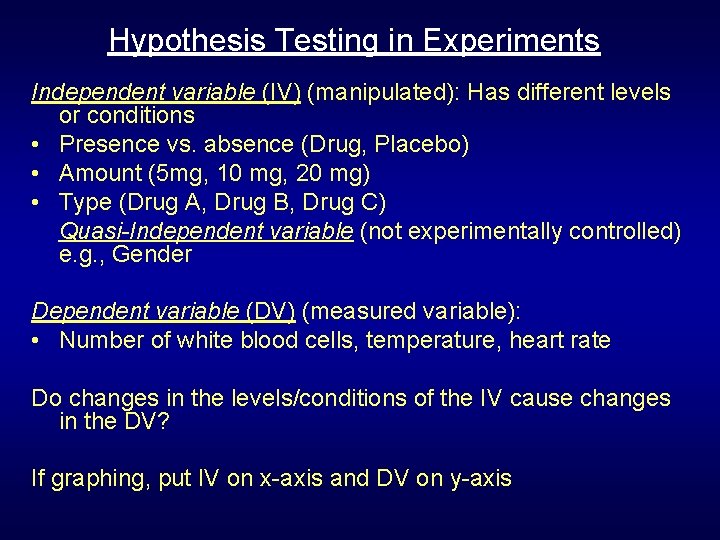
Hypothesis Testing in Experiments Independent variable (IV) (manipulated): Has different levels or conditions • Presence vs. absence (Drug, Placebo) • Amount (5 mg, 10 mg, 20 mg) • Type (Drug A, Drug B, Drug C) Quasi-Independent variable (not experimentally controlled) e. g. , Gender Dependent variable (DV) (measured variable): • Number of white blood cells, temperature, heart rate Do changes in the levels/conditions of the IV cause changes in the DV? If graphing, put IV on x-axis and DV on y-axis
Hypothesis Testing in Experiments Statistical test: Analysis of variance (ANOVA) = F test Used for: Comparing differences between average scores in different conditions to find out if overall the IV influenced the DV Use when: The IV is categorical (with 2 or more levels) and the DV is numerical (interval or ratio scale), e. g. , weight as a function of race/ethnicity # of white blood cells as a function of type of cancer treatment mpg as a function of type of fuel
Types of Design: Independent Samples ANOVA Use when you have a between-subjects design -- comparing if there is a difference between two or more separate (independent) groups • • • Some people get Drug A, others get Drug B, and others get the placebo. Do the groups differ, on average, in their pain? Some plants are exposed to 0 hrs of artificial light, some are exposed to 3 hours, and some are exposed to 6 hours. Does the number of blooms differ, on average, as a function of amount of light? Some cars use Fuel A, some use Fuel B, some use Fuel C, and some use Fuel D. Do different types of fuel result in better fuel mileage, on average, than others?
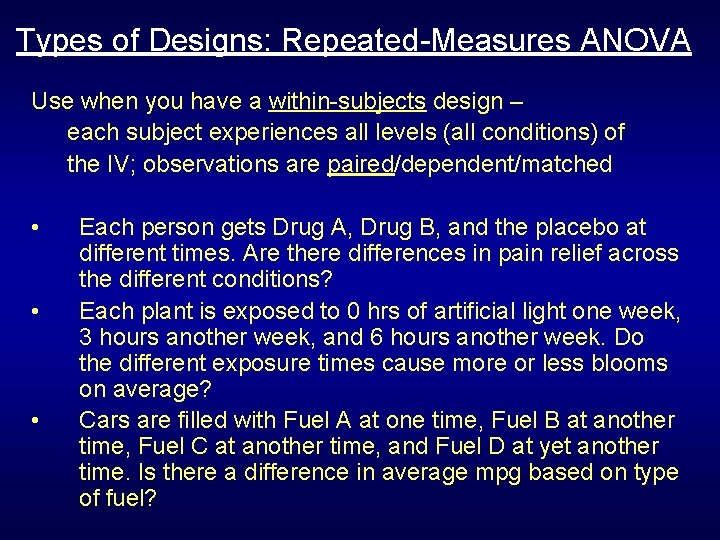
Types of Designs: Repeated-Measures ANOVA Use when you have a within-subjects design – each subject experiences all levels (all conditions) of the IV; observations are paired/dependent/matched • • • Each person gets Drug A, Drug B, and the placebo at different times. Are there differences in pain relief across the different conditions? Each plant is exposed to 0 hrs of artificial light one week, 3 hours another week, and 6 hours another week. Do the different exposure times cause more or less blooms on average? Cars are filled with Fuel A at one time, Fuel B at another time, Fuel C at another time, and Fuel D at yet another time. Is there a difference in average mpg based on type of fuel?
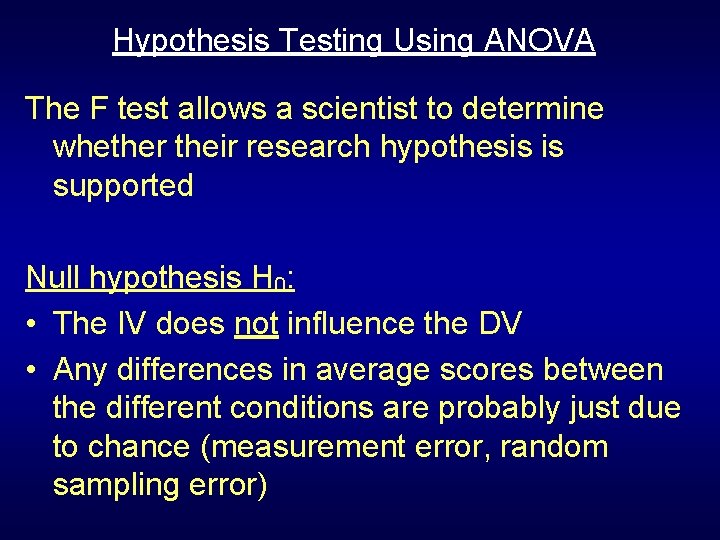
Hypothesis Testing Using ANOVA The F test allows a scientist to determine whether their research hypothesis is supported Null hypothesis H 0: • The IV does not influence the DV • Any differences in average scores between the different conditions are probably just due to chance (measurement error, random sampling error)
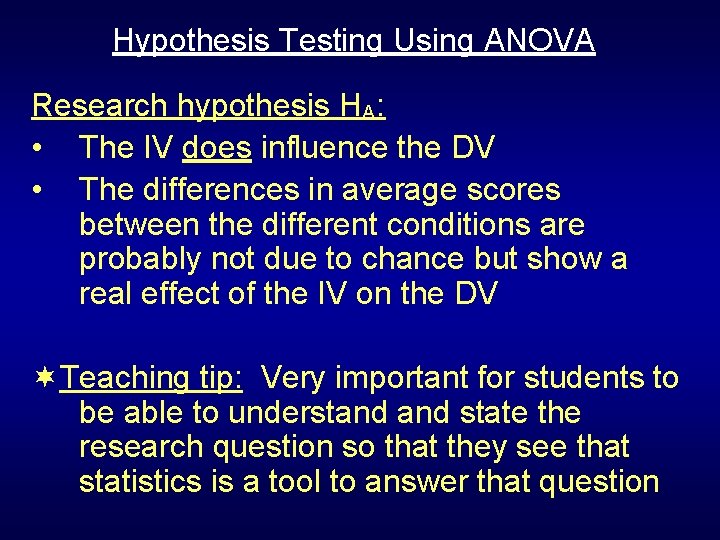
Hypothesis Testing Using ANOVA Research hypothesis HA: • The IV does influence the DV • The differences in average scores between the different conditions are probably not due to chance but show a real effect of the IV on the DV Teaching tip: Very important for students to be able to understand state the research question so that they see that statistics is a tool to answer that question
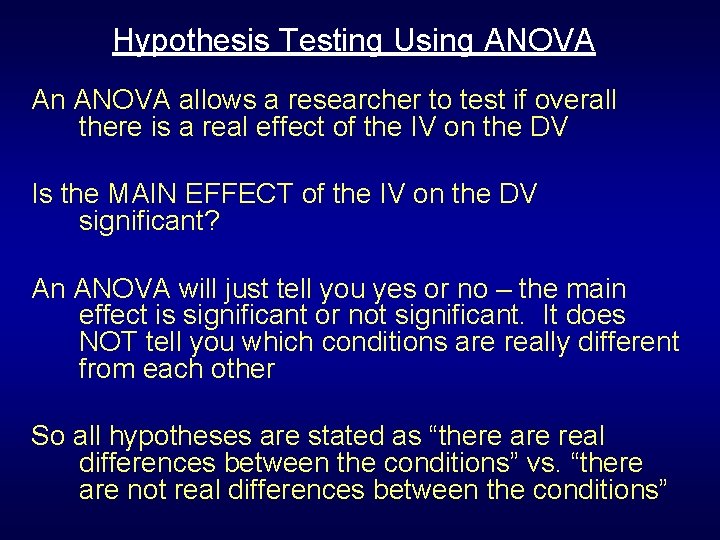
Hypothesis Testing Using ANOVA An ANOVA allows a researcher to test if overall there is a real effect of the IV on the DV Is the MAIN EFFECT of the IV on the DV significant? An ANOVA will just tell you yes or no – the main effect is significant or not significant. It does NOT tell you which conditions are really different from each other So all hypotheses are stated as “there are real differences between the conditions” vs. “there are not real differences between the conditions”
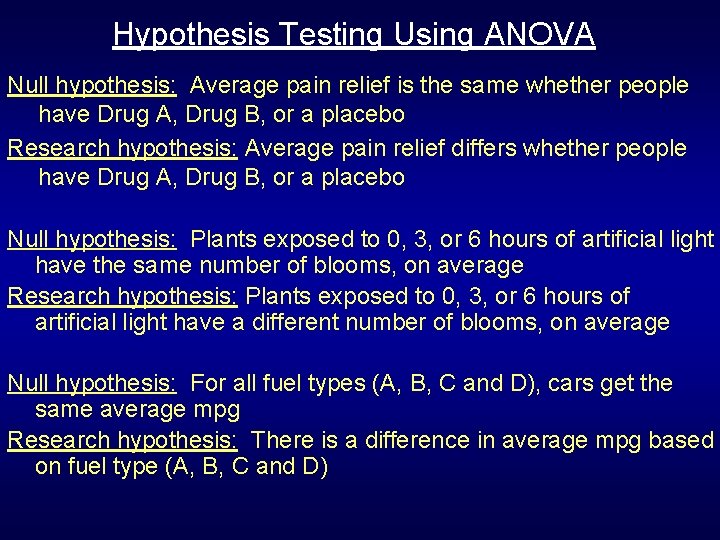
Hypothesis Testing Using ANOVA Null hypothesis: Average pain relief is the same whether people have Drug A, Drug B, or a placebo Research hypothesis: Average pain relief differs whether people have Drug A, Drug B, or a placebo Null hypothesis: Plants exposed to 0, 3, or 6 hours of artificial light have the same number of blooms, on average Research hypothesis: Plants exposed to 0, 3, or 6 hours of artificial light have a different number of blooms, on average Null hypothesis: For all fuel types (A, B, C and D), cars get the same average mpg Research hypothesis: There is a difference in average mpg based on fuel type (A, B, C and D)
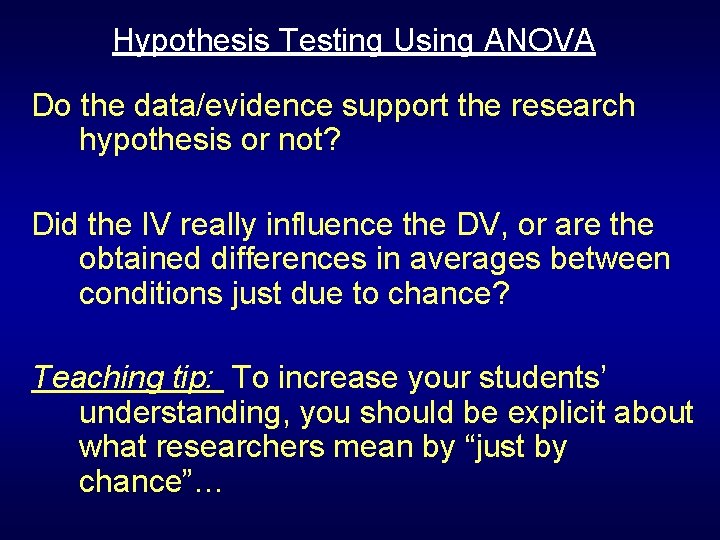
Hypothesis Testing Using ANOVA Do the data/evidence support the research hypothesis or not? Did the IV really influence the DV, or are the obtained differences in averages between conditions just due to chance? Teaching tip: To increase your students’ understanding, you should be explicit about what researchers mean by “just by chance”…
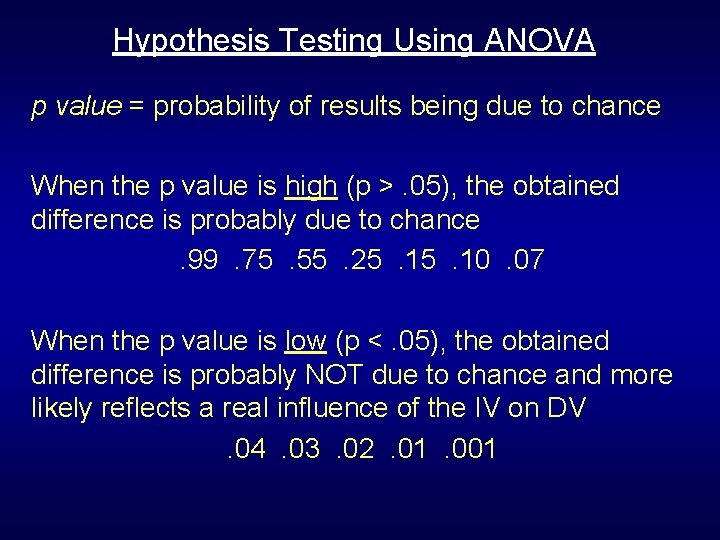
Hypothesis Testing Using ANOVA p value = probability of results being due to chance When the p value is high (p >. 05), the obtained difference is probably due to chance. 99 . 75 . 55 . 25 . 10 . 07 When the p value is low (p <. 05), the obtained difference is probably NOT due to chance and more likely reflects a real influence of the IV on DV. 04 . 03 . 02 . 01 . 001
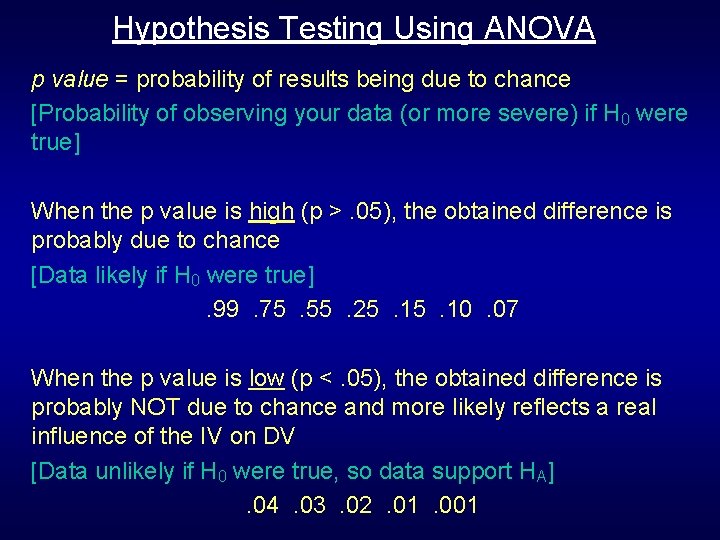
Hypothesis Testing Using ANOVA p value = probability of results being due to chance [Probability of observing your data (or more severe) if H 0 were true] When the p value is high (p >. 05), the obtained difference is probably due to chance [Data likely if H 0 were true]. 99 . 75 . 55 . 25 . 10 . 07 When the p value is low (p <. 05), the obtained difference is probably NOT due to chance and more likely reflects a real influence of the IV on DV [Data unlikely if H 0 were true, so data support HA]. 04 . 03 . 02 . 01 . 001
Hypothesis Testing Using ANOVA In science, a p value of. 05 is a conventionally accepted cutoff point for saying when a result is more likely due to chance or more likely due to a real effect Not significant = the obtained difference is probably due to chance; the IV does not appear to have a real influence on the DV; p >. 05 Statistically significant = the obtained difference is probably NOT due to chance and is likely due to a real influence of the IV on DV; p <. 05
Types of One-Way ANOVA An F test for a main effect answers the question: • Is the research hypothesis supported? • In other words, did the IV really influence the DV, or are the obtained differences in the averages between conditions just due to chance? One-way independent samples F test One-way repeated measures F test
The Essence of an ANOVA They answer this question by calculating a F value The F value basically examines how large the difference between the average score in each condition is, relative to how far spread out you would expect scores to be just based on chance (i. e. , if there really was no effect of the IV on the DV) It is of course more sophisticated than that but students will have to wait for statistics courses to really get the low down on how it all works
The Essence of an ANOVA This can be taught without formulas but for the sake of thoroughness… The key to understanding ANOVA is understanding that it literally analyzes the variance in scores The question really is why are all the scores not exactly the same? Why is there any variability at all, and what accounts for it?
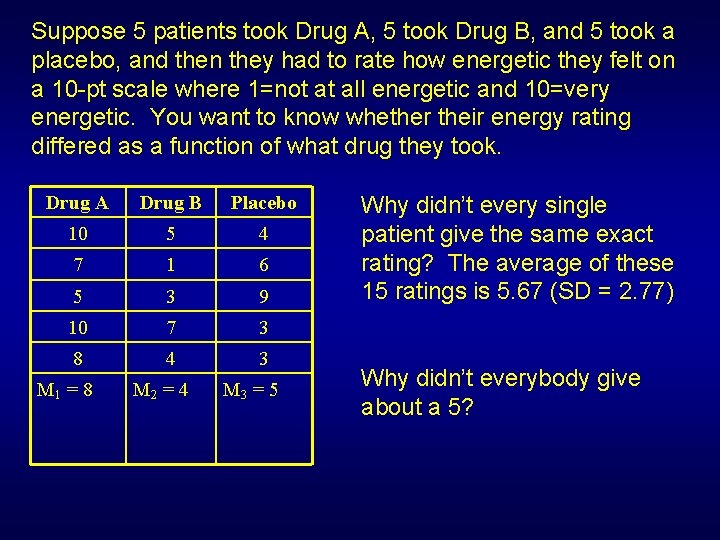
Suppose 5 patients took Drug A, 5 took Drug B, and 5 took a placebo, and then they had to rate how energetic they felt on a 10 -pt scale where 1=not at all energetic and 10=very energetic. You want to know whether their energy rating differed as a function of what drug they took. Drug A Drug B Placebo 10 5 4 7 1 6 5 3 9 10 7 3 8 4 3 M 1 = 8 M 2 = 4 M 3 = 5 Why didn’t every single patient give the same exact rating? The average of these 15 ratings is 5. 67 (SD = 2. 77) Why didn’t everybody give about a 5?
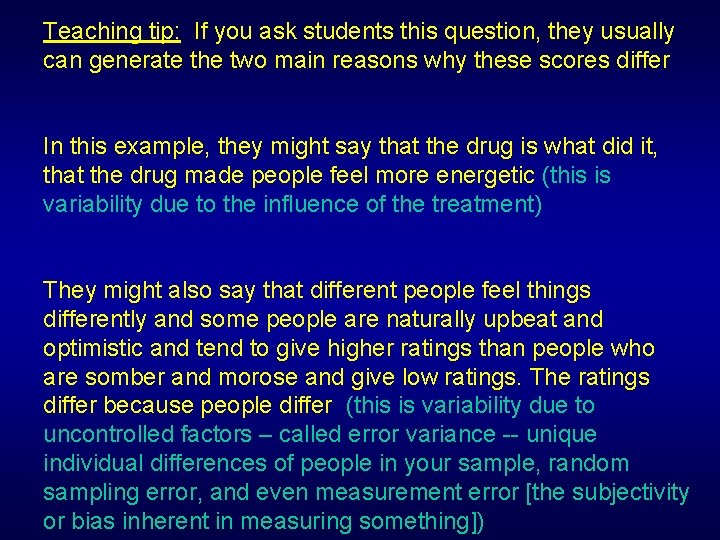
Teaching tip: If you ask students this question, they usually can generate the two main reasons why these scores differ In this example, they might say that the drug is what did it, that the drug made people feel more energetic (this is variability due to the influence of the treatment) They might also say that different people feel things differently and some people are naturally upbeat and optimistic and tend to give higher ratings than people who are somber and morose and give low ratings. The ratings differ because people differ (this is variability due to uncontrolled factors – called error variance -- unique individual differences of people in your sample, random sampling error, and even measurement error [the subjectivity or bias inherent in measuring something])
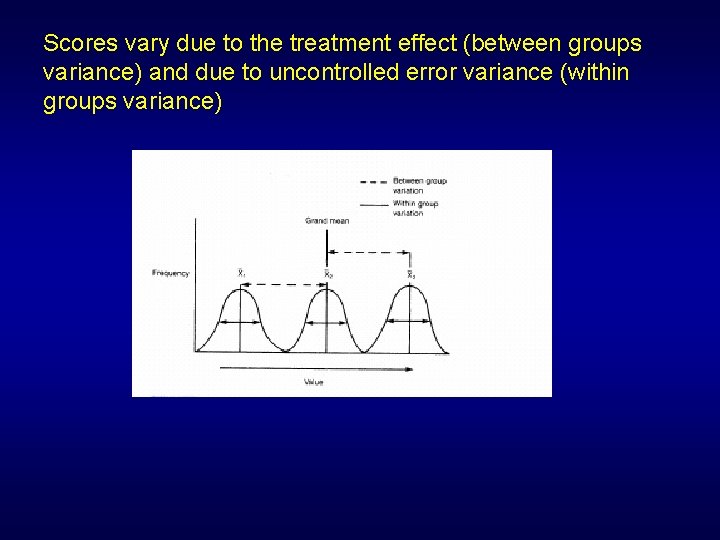
Scores vary due to the treatment effect (between groups variance) and due to uncontrolled error variance (within groups variance)
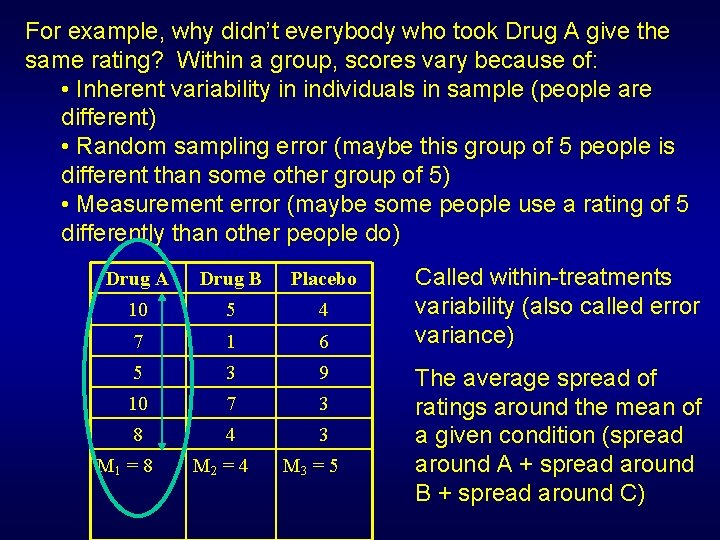
For example, why didn’t everybody who took Drug A give the same rating? Within a group, scores vary because of: • Inherent variability in individuals in sample (people are different) • Random sampling error (maybe this group of 5 people is different than some other group of 5) • Measurement error (maybe some people use a rating of 5 differently than other people do) Drug A Drug B Placebo 10 5 4 7 1 6 5 3 9 10 7 3 8 4 3 M 1 = 8 M 2 = 4 M 3 = 5 Called within-treatments variability (also called error variance) The average spread of ratings around the mean of a given condition (spread around A + spread around B + spread around C)
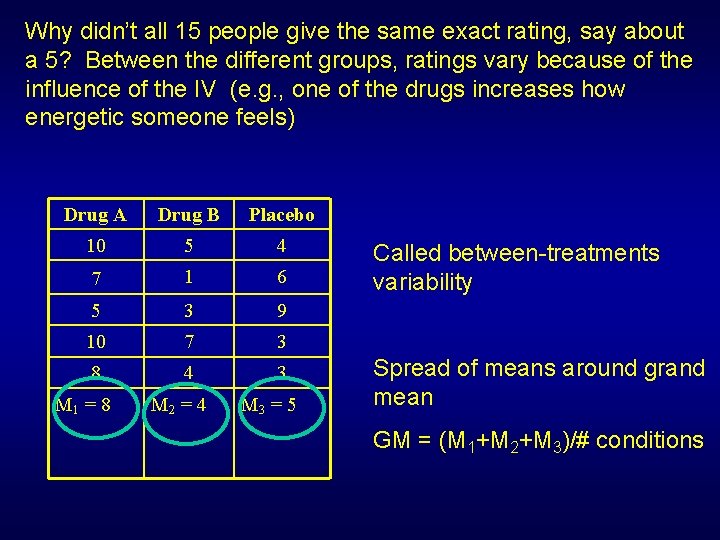
Why didn’t all 15 people give the same exact rating, say about a 5? Between the different groups, ratings vary because of the influence of the IV (e. g. , one of the drugs increases how energetic someone feels) Drug A Drug B Placebo 10 5 4 7 1 6 5 3 9 10 7 3 8 4 3 M 1 = 8 M 2 = 4 M 3 = 5 Called between-treatments variability Spread of means around grand mean GM = (M 1+M 2+M 3)/# conditions
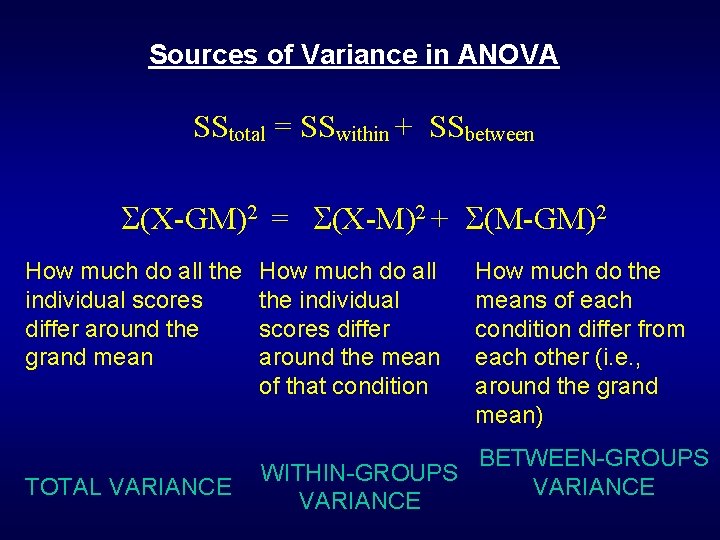
Sources of Variance in ANOVA SStotal = SSwithin + SSbetween (X-GM)2 = (X-M)2 + (M-GM)2 How much do all the individual scores differ around the grand mean TOTAL VARIANCE How much do all the individual scores differ around the mean of that condition How much do the means of each condition differ from each other (i. e. , around the grand mean) BETWEEN-GROUPS WITHIN-GROUPS VARIANCE
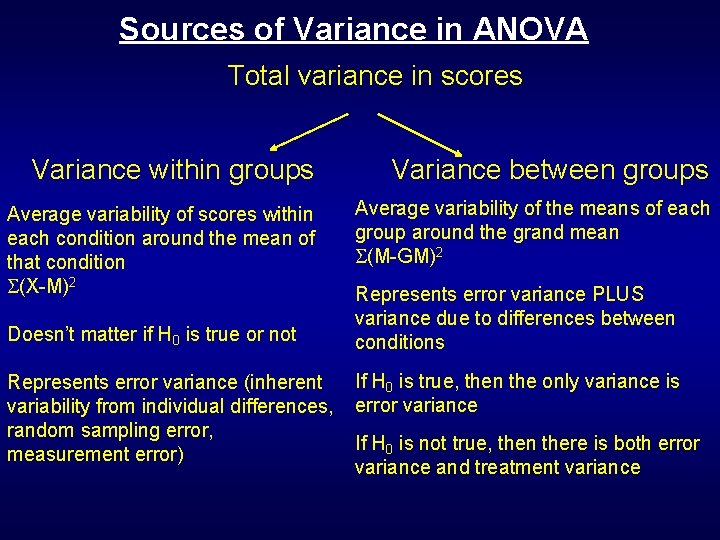
Sources of Variance in ANOVA Total variance in scores Variance within groups Average variability of scores within each condition around the mean of that condition (X-M)2 Doesn’t matter if H 0 is true or not Variance between groups Average variability of the means of each group around the grand mean (M-GM)2 Represents error variance PLUS variance due to differences between conditions Represents error variance (inherent If H 0 is true, then the only variance is variability from individual differences, error variance random sampling error, If H 0 is not true, then there is both error measurement error) variance and treatment variance
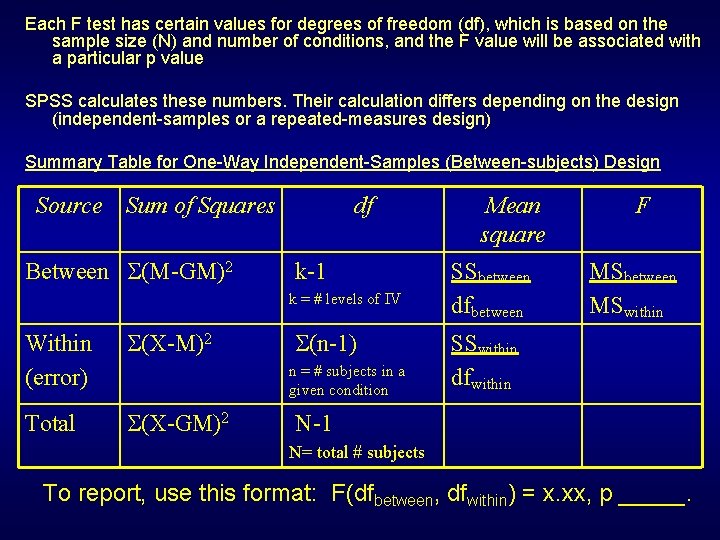
Each F test has certain values for degrees of freedom (df), which is based on the sample size (N) and number of conditions, and the F value will be associated with a particular p value SPSS calculates these numbers. Their calculation differs depending on the design (independent-samples or a repeated-measures design) Summary Table for One-Way Independent-Samples (Between-subjects) Design Source Sum of Squares Between (M-GM)2 df k-1 k = # levels of IV Within (error) (X-M)2 Total (X-GM)2 (n-1) n = # subjects in a given condition Mean square SSbetween dfbetween F MSbetween MSwithin SSwithin dfwithin N-1 N= total # subjects To report, use this format: F(dfbetween, dfwithin) = x. xx, p _____.
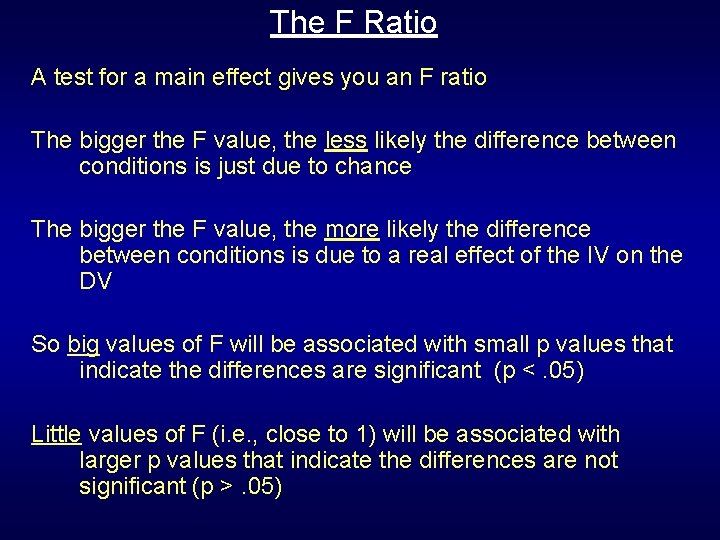
The F Ratio A test for a main effect gives you an F ratio The bigger the F value, the less likely the difference between conditions is just due to chance The bigger the F value, the more likely the difference between conditions is due to a real effect of the IV on the DV So big values of F will be associated with small p values that indicate the differences are significant (p <. 05) Little values of F (i. e. , close to 1) will be associated with larger p values that indicate the differences are not significant (p >. 05)
Within-Subjects ANOVA The basic idea is the same when using a repeated-measures (within-subjects) ANOVA as when using an independentsamples (between-subjects) ANOVA: An F value and corresponding p value indicate whether the main effect is significant or not However, the repeated-measures ANOVA is calculated differently because it removes the variability that is due to individual differences (each subject is tested in each condition so variability due to unique individual differences is no longer uncontrolled error variance)
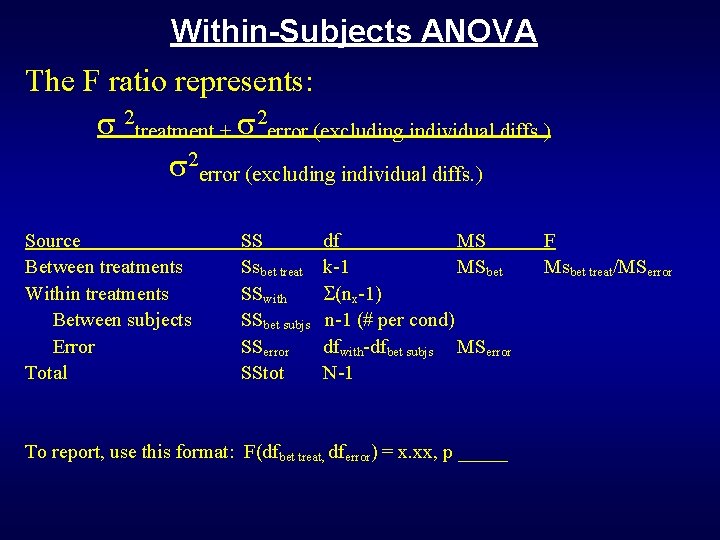
Within-Subjects ANOVA The F ratio represents: 2 treatment + 2 error (excluding individual diffs. ) Source Between treatments Within treatments Between subjects Error Total SS df MS F Ssbet treat k-1 MSbet Msbet treat/MSerror SSwith (nx-1) SSbet subjs n-1 (# per cond) SSerror dfwith-dfbet subjs MSerror SStot N-1 To report, use this format: F(dfbet treat, dferror) = x. xx, p _____
Interpreting ANOVAs Cardinal rule: Scientists do not say “prove”! Conclusions are based on probability (likely due to chance, likely a real effect…). Be explicit about this to your students. Based on p value, determine whether you have evidence to conclude the difference was probably real or was probably due to chance: Is the research hypothesis supported? p <. 05: Significant • Reject null hypothesis and support research hypothesis (the difference was probably real; the IV likely influences the DV) p >. 05: Not significant • Retain null hypothesis and reject research hypothesis (any difference was probably due to chance; the IV did not influence the DV)
Teaching Tips Students have trouble understanding what is less than. 05 and what is greater, so a little redundancy will go a long way! Whenever you say “p is less than point oh-five” also say, “so the probability that this is due to chance is less than 5%, so it’s probably a real effect. ” Whenever you say “p is greater than point oh-five” also say, “so the probability that this is due to chance is greater than 5%, so there’s just not enough evidence to conclude that it’s a real effect – these 2 conditions are not really different” In other words, read the p value as a percentage, as odds, “the odds that this difference is due to chance are 1%, so it’s probably not chance…” Relate your phrasing back to the IV and DV: “So the IV likely caused changes in the DV…”; “The IV worked – these 2 conditions are different”
Understanding the ANOVA Results If the F value is associated with a p value <. 05, then your main effect is significant The answer to the question: Did the IV really influence the DV? ” is “yes” If the F value is associated with a p value >. 05, then the main effect is NOT significant The answer to the question: Did the IV really influence the DV? ” is “no”
Understanding the ANOVA Results If the main effect is significant, all you know is that at least one of the conditions is different from the others You need to run additional comparisons to determine which specific conditions really differ from the other conditions: • Is A different from B? • Is A different from C? • Is B different from C?
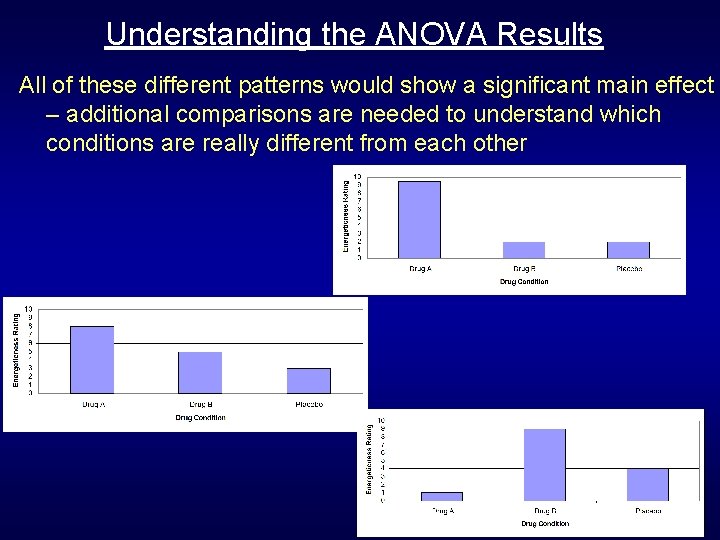
Understanding the ANOVA Results All of these different patterns would show a significant main effect – additional comparisons are needed to understand which conditions are really different from each other
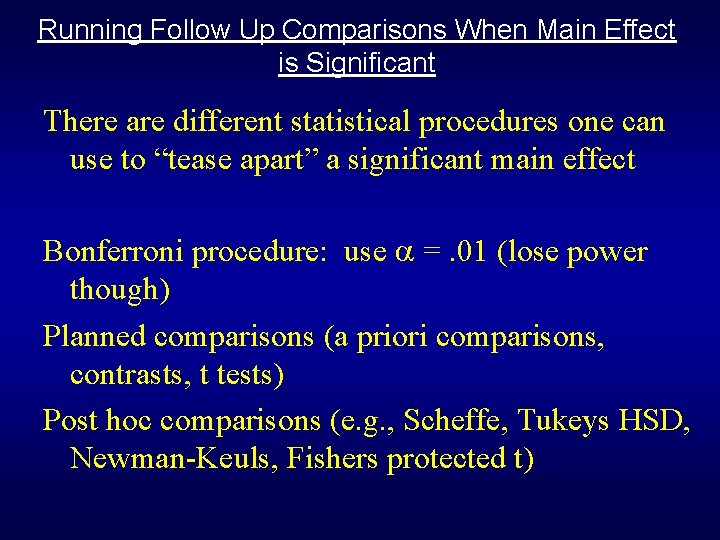
Running Follow Up Comparisons When Main Effect is Significant There are different statistical procedures one can use to “tease apart” a significant main effect Bonferroni procedure: use =. 01 (lose power though) Planned comparisons (a priori comparisons, contrasts, t tests) Post hoc comparisons (e. g. , Scheffe, Tukeys HSD, Newman-Keuls, Fishers protected t)
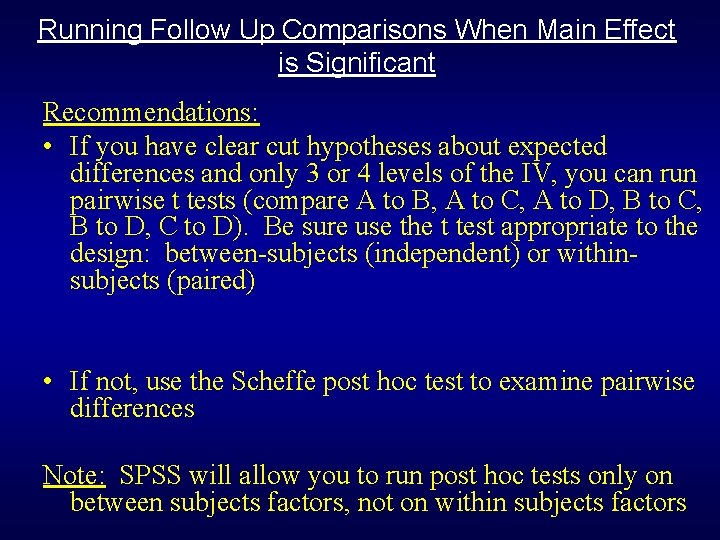
Running Follow Up Comparisons When Main Effect is Significant Recommendations: • If you have clear cut hypotheses about expected differences and only 3 or 4 levels of the IV, you can run pairwise t tests (compare A to B, A to C, A to D, B to C, B to D, C to D). Be sure use the t test appropriate to the design: between-subjects (independent) or withinsubjects (paired) • If not, use the Scheffe post hoc test to examine pairwise differences Note: SPSS will allow you to run post hoc tests only on between subjects factors, not on within subjects factors
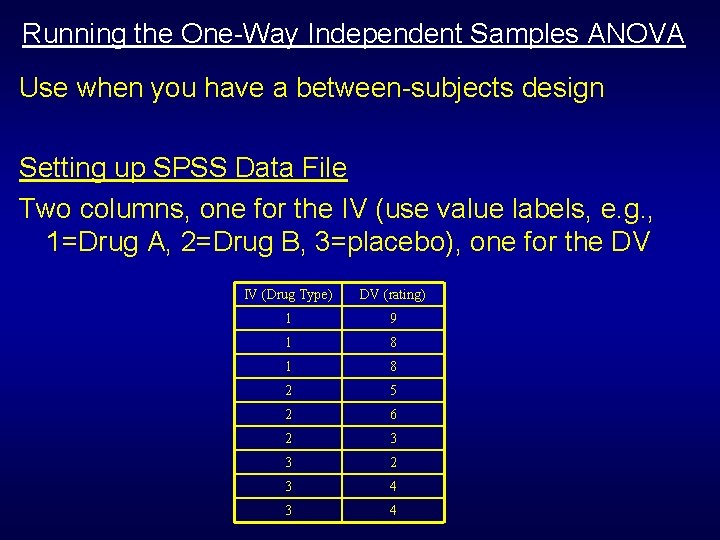
Running the One-Way Independent Samples ANOVA Use when you have a between-subjects design Setting up SPSS Data File Two columns, one for the IV (use value labels, e. g. , 1=Drug A, 2=Drug B, 3=placebo), one for the DV IV (Drug Type) DV (rating) 1 9 1 8 2 5 2 6 2 3 3 2 3 4
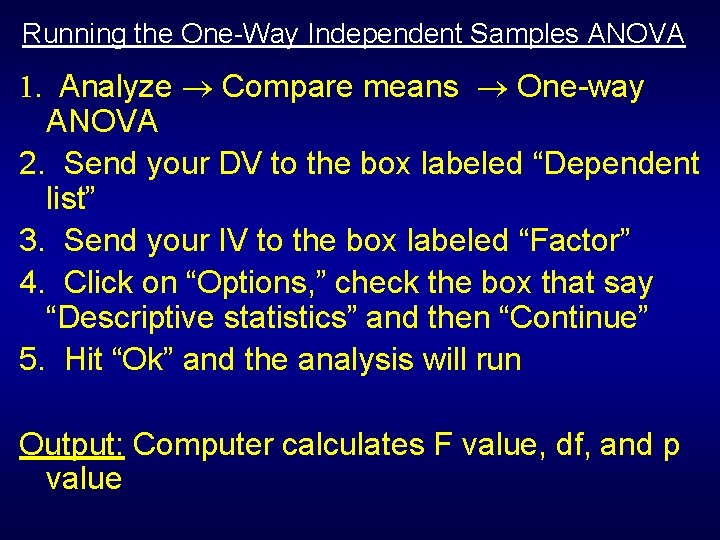
Running the One-Way Independent Samples ANOVA 1. Analyze Compare means One-way ANOVA 2. Send your DV to the box labeled “Dependent list” 3. Send your IV to the box labeled “Factor” 4. Click on “Options, ” check the box that say “Descriptive statistics” and then “Continue” 5. Hit “Ok” and the analysis will run Output: Computer calculates F value, df, and p value
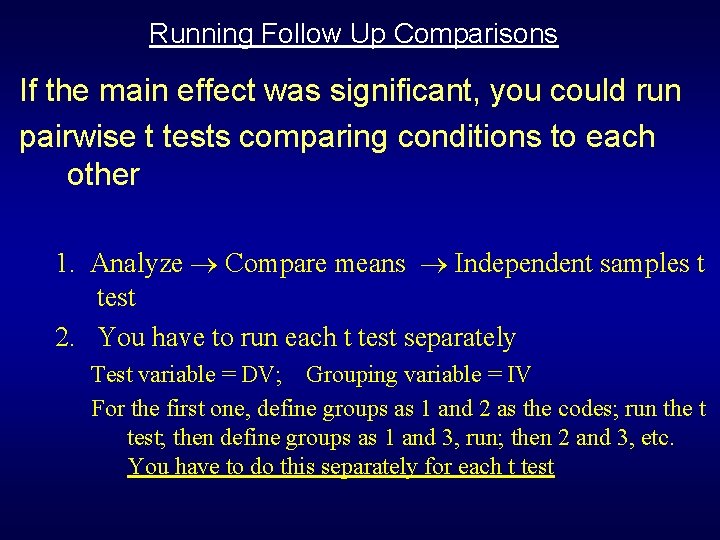
Running Follow Up Comparisons If the main effect was significant, you could run pairwise t tests comparing conditions to each other 1. Analyze Compare means Independent samples t test 2. You have to run each t test separately Test variable = DV; Grouping variable = IV For the first one, define groups as 1 and 2 as the codes; run the t test; then define groups as 1 and 3, run; then 2 and 3, etc. You have to do this separately for each t test
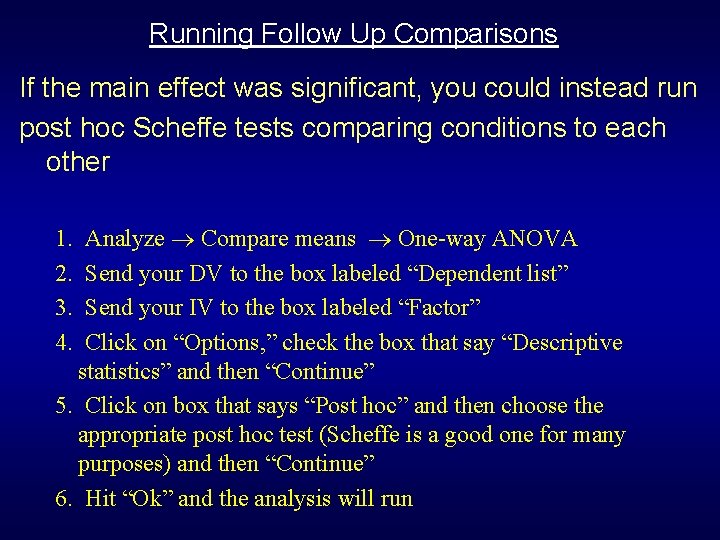
Running Follow Up Comparisons If the main effect was significant, you could instead run post hoc Scheffe tests comparing conditions to each other 1. Analyze Compare means One-way ANOVA 2. Send your DV to the box labeled “Dependent list” 3. Send your IV to the box labeled “Factor” 4. Click on “Options, ” check the box that say “Descriptive statistics” and then “Continue” 5. Click on box that says “Post hoc” and then choose the appropriate post hoc test (Scheffe is a good one for many purposes) and then “Continue” 6. Hit “Ok” and the analysis will run
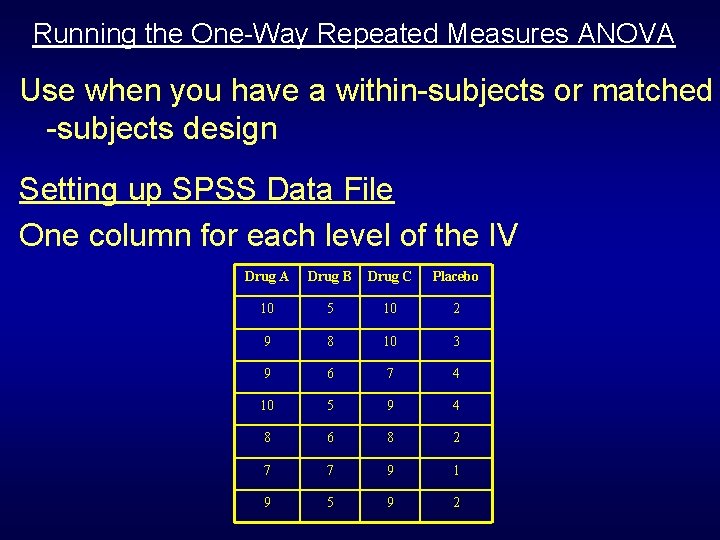
Running the One-Way Repeated Measures ANOVA Use when you have a within-subjects or matched -subjects design Setting up SPSS Data File One column for each level of the IV Drug A Drug B Drug C Placebo 10 5 10 2 9 8 10 3 9 6 7 4 10 5 9 4 8 6 8 2 7 7 9 1 9 5 9 2
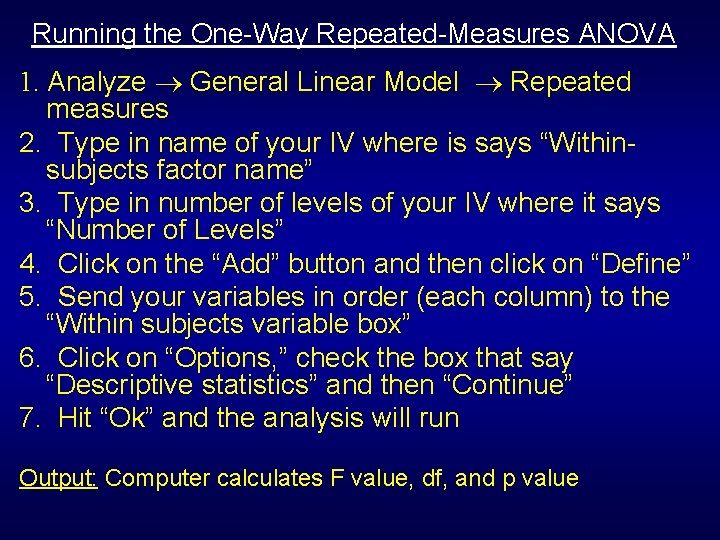
Running the One-Way Repeated-Measures ANOVA 1. Analyze General Linear Model Repeated measures 2. Type in name of your IV where is says “Withinsubjects factor name” 3. Type in number of levels of your IV where it says “Number of Levels” 4. Click on the “Add” button and then click on “Define” 5. Send your variables in order (each column) to the “Within subjects variable box” 6. Click on “Options, ” check the box that say “Descriptive statistics” and then “Continue” 7. Hit “Ok” and the analysis will run Output: Computer calculates F value, df, and p value
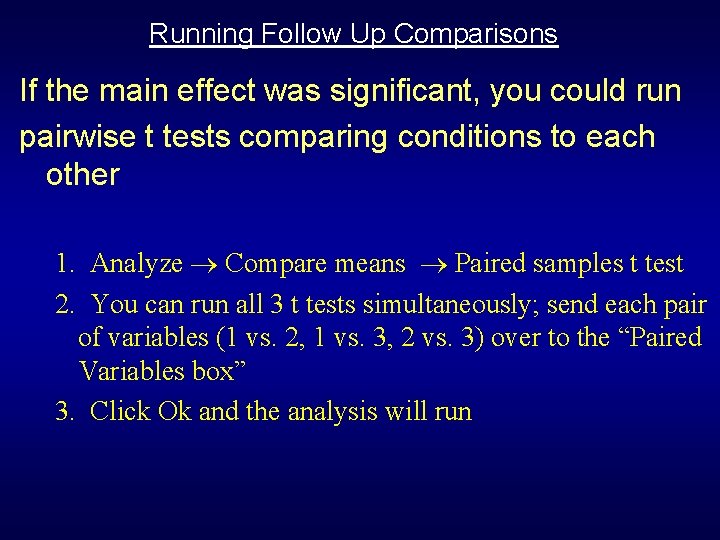
Running Follow Up Comparisons If the main effect was significant, you could run pairwise t tests comparing conditions to each other 1. Analyze Compare means Paired samples t test 2. You can run all 3 t tests simultaneously; send each pair of variables (1 vs. 2, 1 vs. 3, 2 vs. 3) over to the “Paired Variables box” 3. Click Ok and the analysis will run
Reporting ANOVA Results State key findings in understandable sentences Use descriptive and inferential statistics to supplement verbal description by putting them in parentheses and at the end of the sentence Use a table and/or figure to illustrate findings
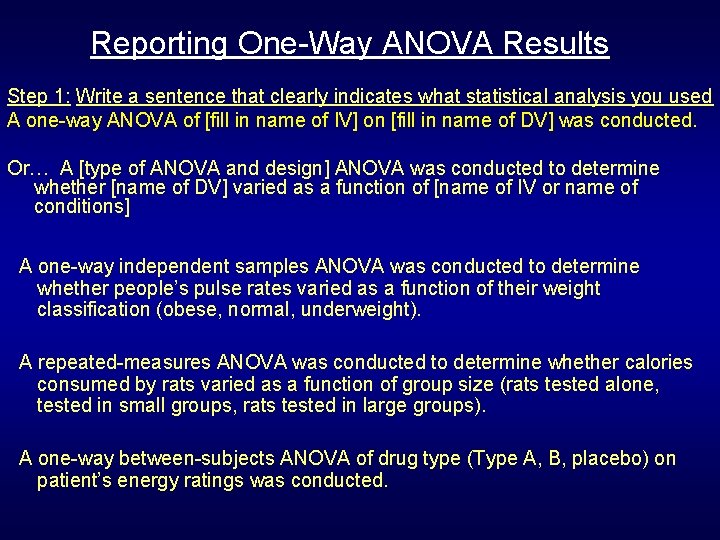
Reporting One-Way ANOVA Results Step 1: Write a sentence that clearly indicates what statistical analysis you used A one-way ANOVA of [fill in name of IV] on [fill in name of DV] was conducted. Or… A [type of ANOVA and design] ANOVA was conducted to determine whether [name of DV] varied as a function of [name of IV or name of conditions] A one-way independent samples ANOVA was conducted to determine whether people’s pulse rates varied as a function of their weight classification (obese, normal, underweight). A repeated-measures ANOVA was conducted to determine whether calories consumed by rats varied as a function of group size (rats tested alone, tested in small groups, rats tested in large groups). A one-way between-subjects ANOVA of drug type (Type A, B, placebo) on patient’s energy ratings was conducted.
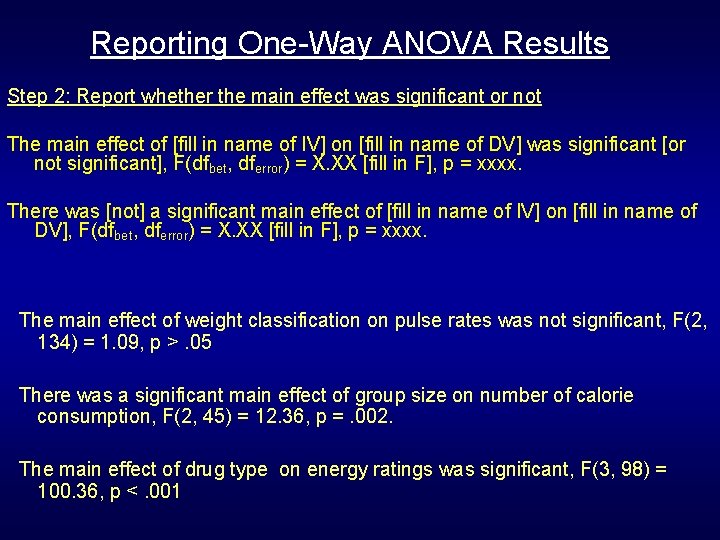
Reporting One-Way ANOVA Results Step 2: Report whether the main effect was significant or not The main effect of [fill in name of IV] on [fill in name of DV] was significant [or not significant], F(dfbet, dferror) = X. XX [fill in F], p = xxxx. There was [not] a significant main effect of [fill in name of IV] on [fill in name of DV], F(dfbet, dferror) = X. XX [fill in F], p = xxxx. The main effect of weight classification on pulse rates was not significant, F(2, 134) = 1. 09, p >. 05 There was a significant main effect of group size on number of calorie consumption, F(2, 45) = 12. 36, p =. 002. The main effect of drug type on energy ratings was significant, F(3, 98) = 100. 36, p <. 001
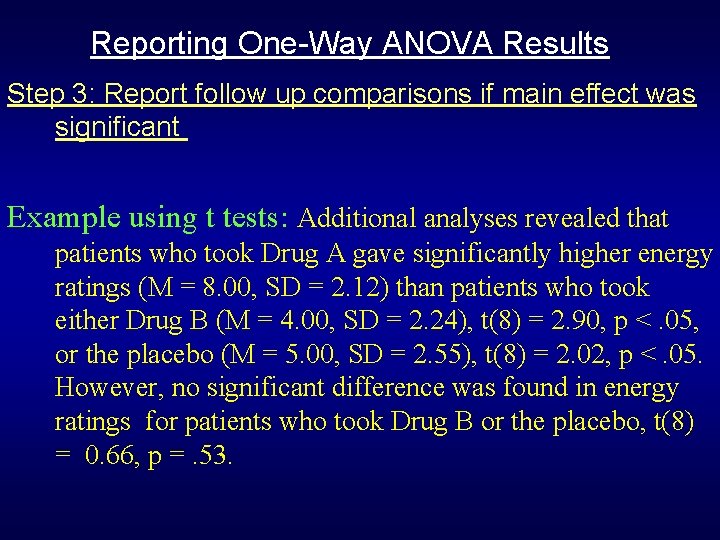
Reporting One-Way ANOVA Results Step 3: Report follow up comparisons if main effect was significant Example using t tests: Additional analyses revealed that patients who took Drug A gave significantly higher energy ratings (M = 8. 00, SD = 2. 12) than patients who took either Drug B (M = 4. 00, SD = 2. 24), t(8) = 2. 90, p <. 05, or the placebo (M = 5. 00, SD = 2. 55), t(8) = 2. 02, p <. 05. However, no significant difference was found in energy ratings for patients who took Drug B or the placebo, t(8) = 0. 66, p =. 53.
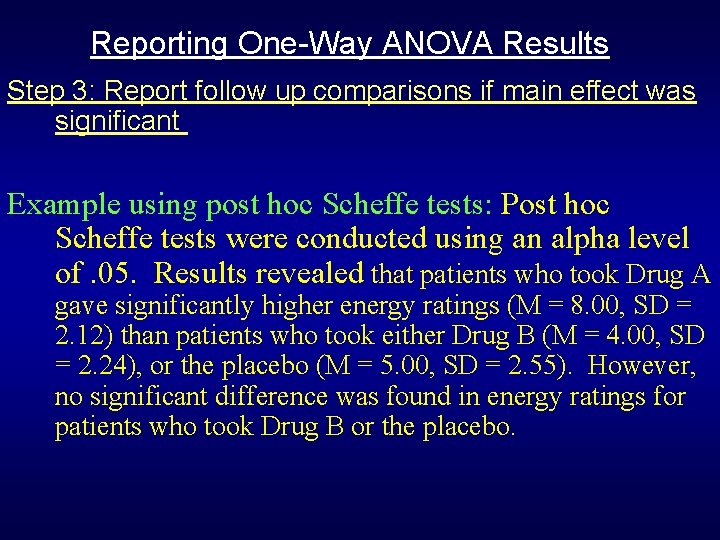
Reporting One-Way ANOVA Results Step 3: Report follow up comparisons if main effect was significant Example using post hoc Scheffe tests: Post hoc Scheffe tests were conducted using an alpha level of. 05. Results revealed that patients who took Drug A gave significantly higher energy ratings (M = 8. 00, SD = 2. 12) than patients who took either Drug B (M = 4. 00, SD = 2. 24), or the placebo (M = 5. 00, SD = 2. 55). However, no significant difference was found in energy ratings for patients who took Drug B or the placebo.
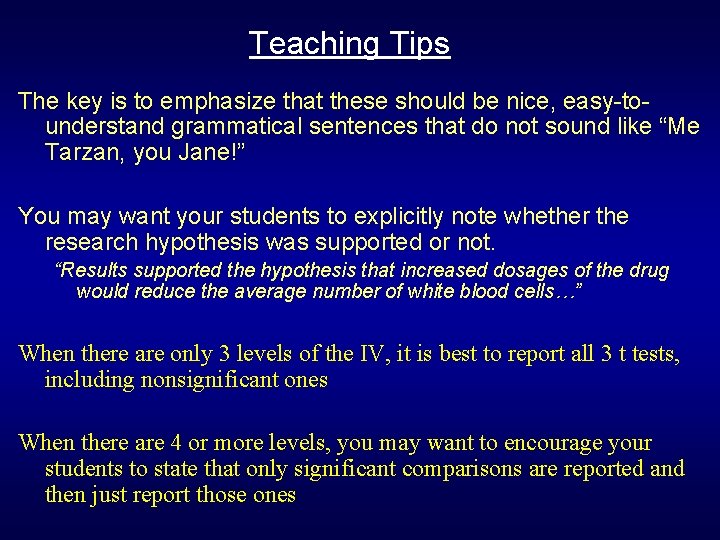
Teaching Tips The key is to emphasize that these should be nice, easy-tounderstand grammatical sentences that do not sound like “Me Tarzan, you Jane!” You may want your students to explicitly note whether the research hypothesis was supported or not. “Results supported the hypothesis that increased dosages of the drug would reduce the average number of white blood cells…” When there are only 3 levels of the IV, it is best to report all 3 t tests, including nonsignificant ones When there are 4 or more levels, you may want to encourage your students to state that only significant comparisons are reported and then just report those ones
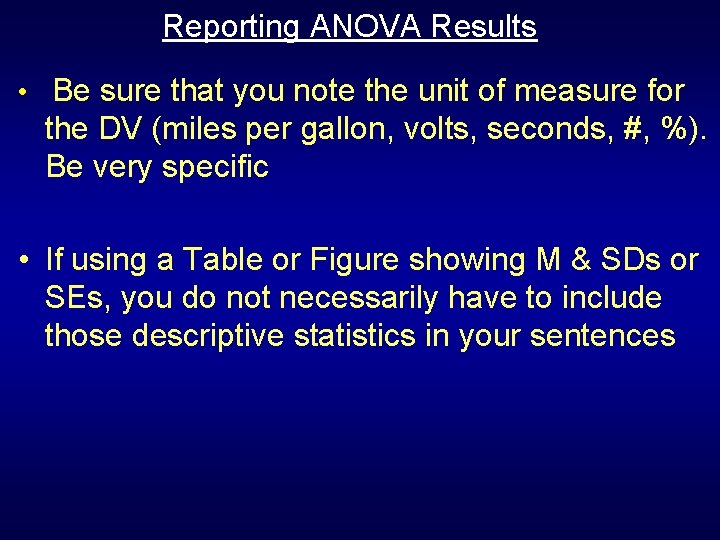
Reporting ANOVA Results • Be sure that you note the unit of measure for the DV (miles per gallon, volts, seconds, #, %). Be very specific • If using a Table or Figure showing M & SDs or SEs, you do not necessarily have to include those descriptive statistics in your sentences
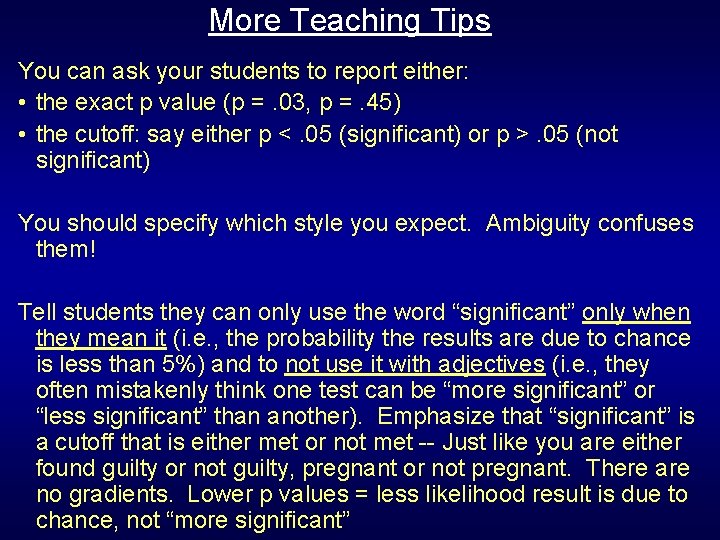
More Teaching Tips You can ask your students to report either: • the exact p value (p =. 03, p =. 45) • the cutoff: say either p <. 05 (significant) or p >. 05 (not significant) You should specify which style you expect. Ambiguity confuses them! Tell students they can only use the word “significant” only when they mean it (i. e. , the probability the results are due to chance is less than 5%) and to not use it with adjectives (i. e. , they often mistakenly think one test can be “more significant” or “less significant” than another). Emphasize that “significant” is a cutoff that is either met or not met -- Just like you are either found guilty or not guilty, pregnant or not pregnant. There are no gradients. Lower p values = less likelihood result is due to chance, not “more significant”
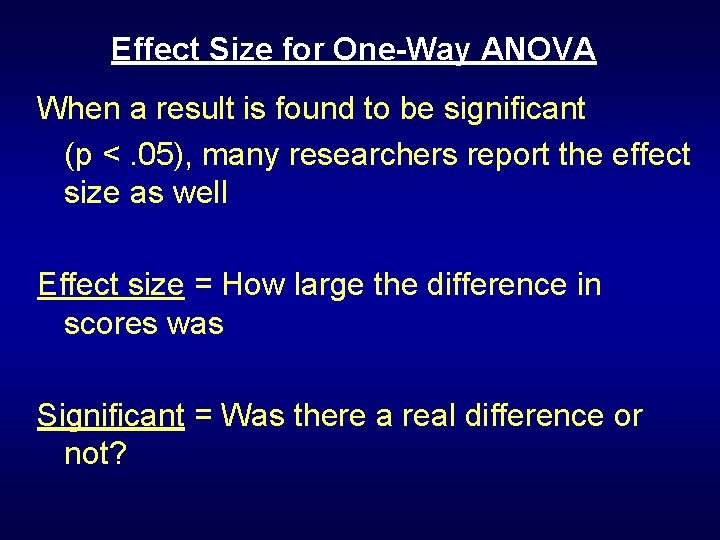
Effect Size for One-Way ANOVA When a result is found to be significant (p <. 05), many researchers report the effect size as well Effect size = How large the difference in scores was Significant = Was there a real difference or not?
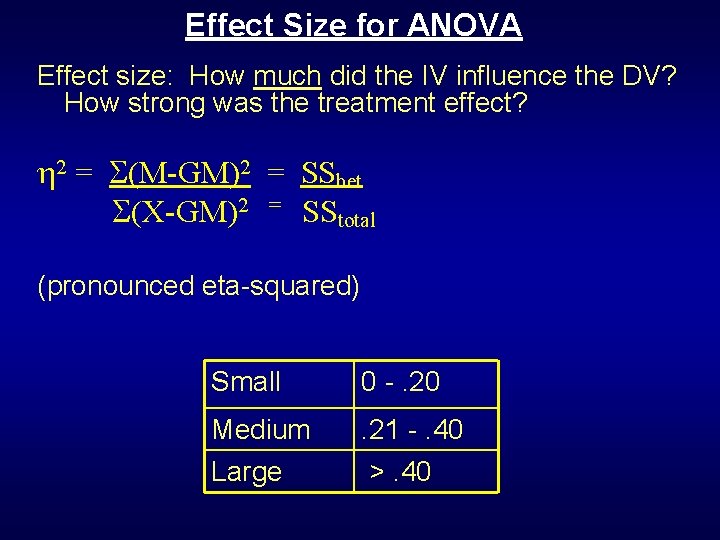
Effect Size for ANOVA Effect size: How much did the IV influence the DV? How strong was the treatment effect? 2 = (M-GM)2 = SSbet (X-GM)2 = SStotal (pronounced eta-squared) Small 0 -. 20 Medium Large . 21 -. 40 >. 40
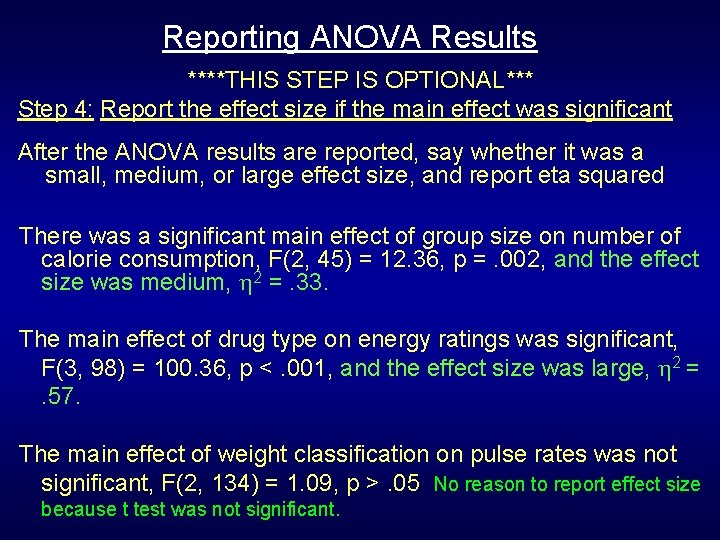
Reporting ANOVA Results ****THIS STEP IS OPTIONAL*** Step 4: Report the effect size if the main effect was significant After the ANOVA results are reported, say whether it was a small, medium, or large effect size, and report eta squared There was a significant main effect of group size on number of calorie consumption, F(2, 45) = 12. 36, p =. 002, and the effect size was medium, 2 =. 33. The main effect of drug type on energy ratings was significant, F(3, 98) = 100. 36, p <. 001, and the effect size was large, 2 = . 57. The main effect of weight classification on pulse rates was not significant, F(2, 134) = 1. 09, p >. 05 No reason to report effect size because t test was not significant.
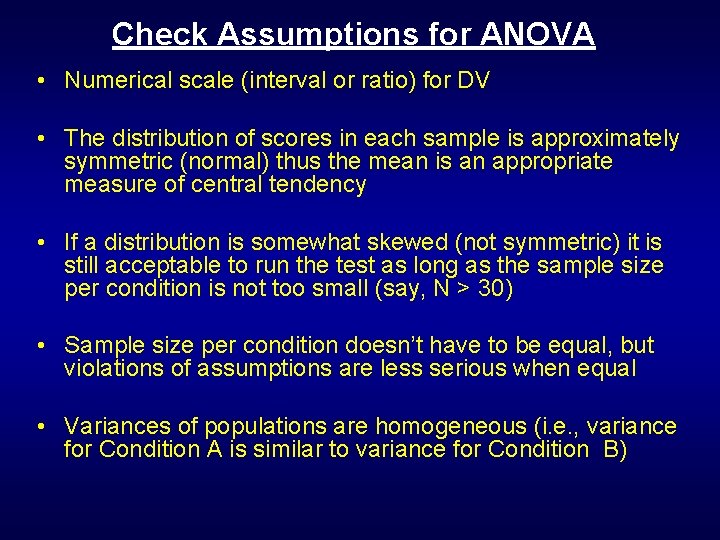
Check Assumptions for ANOVA • Numerical scale (interval or ratio) for DV • The distribution of scores in each sample is approximately symmetric (normal) thus the mean is an appropriate measure of central tendency • If a distribution is somewhat skewed (not symmetric) it is still acceptable to run the test as long as the sample size per condition is not too small (say, N > 30) • Sample size per condition doesn’t have to be equal, but violations of assumptions are less serious when equal • Variances of populations are homogeneous (i. e. , variance for Condition A is similar to variance for Condition B)
Time to Practice • Running and reporting one-way ANOVA