Statistics for Business and Economics Chapter 5 Inferences

Statistics for Business and Economics Chapter 5 Inferences Based on a Single Sample: Estimation with Confidence Intervals

Learning Objectives 1. State What Is Estimated 2. Distinguish Point & Interval Estimates 3. Explain Interval Estimates 4. Compute Confidence Interval Estimates for Population Mean & Proportion 5. Compute Sample Size

Thinking Challenge Suppose you’re interested in the average amount of cash that students in this class (the population) have with them. How would you find out?

Introduction to Estimation

Statistical Methods Descriptive Statistics Inferential Statistics Estimation Hypothesis Testing

Estimation Process Population Mean, , is unknown Sample Random Sample Mean = 50 I am 95% confident that is between 40 & 60.

Unknown Population Parameters Are Estimated Estimate Population Parameter. . . Mean Proportion Variance Differences p^ p with Sample Statistic 2 1 - 2 s 2

Estimation Methods Estimation Point Estimation Interval Estimation

Estimation Methods Estimation Point Estimation Interval Estimation

Point Estimation 1. Provides a single value • Based on observations from one sample 2. Gives no information about how close the value is to the unknown population parameter 3. Example: Sample mean x = 3 is point estimate of unknown population mean

Interval Estimation 1. Provides a range of values • Based on observations from one sample 2. Gives information about closeness to unknown population parameter • Stated in terms of probability – Knowing exact closeness requires knowing unknown population parameter 3. Example: Unknown population mean lies between 50 and 70 with 95% confidence
 Confidence limit (lower)")
Key Elements of Interval Estimation Sample statistic Confidence interval (point estimate) Confidence limit (lower) Confidence limit (upper) A probability that the population parameter falls somewhere within the interval.

Confidence Limits for Population Mean Parameter = Statistic ± Error © 1984 -1994 T/Maker Co.

Many Samples Have Same Interval X = ± Z x_ -1. 65 -2. 58 -1. 96 +1. 65 +2. 58 +1. 96 90% Samples 95% Samples 99% Samples

Confidence Level 1. Probability that the unknown population parameter falls within interval 2. Denoted (1 – • is probability that parameter is not within interval 3. Typical values are 99%, 95%, 90%

Intervals & Confidence Level Sampling Distribution of Sample Mean /2 1 - x_ /2 = _ X (1 – α)% of intervals contain μ Intervals extend from X – ZσX to X + ZσX α% do not Large number of intervals

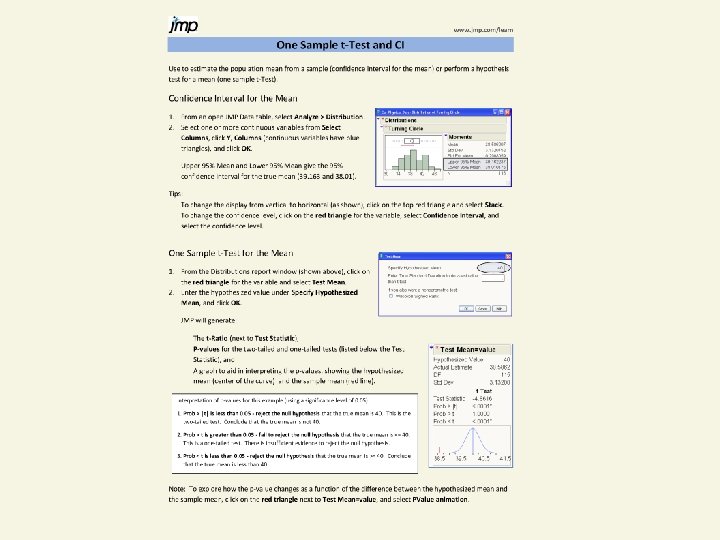
JMP Demo: CI_Mean. jsl 1. Double click on the file. JMP will automatically open if not already running. 2. Inside JMP, use the menu sequence: Edit >> Run Script.

Factors Affecting Interval Width 1. Data dispersion • Measured by Intervals extend from – Z to + Z 2. Sample size 3. Level of confidence (1 – ) • Affects Z © 1984 -1994 T/Maker Co.

Confidence Interval Estimates Confidence Intervals Mean σ Known σ Unknown Proportion
")
Confidence Interval Estimate Mean ( Known)

Confidence Interval Estimates Confidence Intervals Mean σ Known σ Unknown Proportion
 1. Assumptions • • • Population standard deviation is")
Confidence Interval Mean ( Known) 1. Assumptions • • • Population standard deviation is known Population is normally distributed If not normal, can be approximated by normal distribution (n 30) 2. Confidence interval estimate
 The mean of a random sample of n =")
Estimation Example Mean ( Known) The mean of a random sample of n = 25 is. Set up a 95% confidence interval estimate for if = 10.

JMP Solution • Open the data table called “Confidence Interval Calculator. jmp” • Supply needed inputs in columns 1 -5 • Read results in columns 6, 7, 8:

Thinking Challenge You’re a Q/C inspector for Gallo. The for 2 -liter bottles is. 05 liters. A random sample of 100 bottles showed x = 1. 99 liters. What is the 90% confidence interval estimate of the true mean amount in 2 -liter bottles? 22 liter © 1984 -1994 T/Maker Co.

Confidence Interval Solution*
")
Confidence Interval Estimate Mean ( Unknown)

Confidence Interval Estimates Confidence Intervals Mean σ Known σ Unknown Proportion
 1. Assumptions • • Population standard deviation is unknown")
Confidence Interval Mean ( Unknown) 1. Assumptions • • Population standard deviation is unknown Population must be normally distributed 2. Use Student’s t–distribution 3. Exception: if n > 30, the population need not be normally distributed for the procedure to work approximately
 Symmetric t (df =")
Student’s t Distribution Standard Normal Bell-Shaped t (df = 13) Symmetric t (df = 5) ‘Fatter’ Tails 0 Z t
")
Confidence Interval Mean ( Unknown)
 • True residual is the difference between Xi and : X")
Residuals (Sampling Errors) • True residual is the difference between Xi and : X - i _ • Estimated residual: X i -X
 1. Number of free (estimated) residuals: Always n-1 2. If")
Degrees of Freedom (df) 1. Number of free (estimated) residuals: Always n-1 2. If you tell me any n-1 residuals, I will know the value of the nth residual, because they always add to zero! 3. So there are only n-1 “free” residuals.

Example X 1 = 3 X 2 = 4 X 3 = 8 X 4 = 9 _ X = 24/4 = 6 r 1 = 3 - 6 = -3 r 2 = 4 - 6 = -2 r 3 = 8 - 6 = 2 So we know: r 4 = -(-3 + -2 + 2) = +3 (which is 9 – 6!!)
 A random sample of n = 25 has x")
Estimation Example Mean ( Unknown) A random sample of n = 25 has x = 50 and s = 8. Set up a 95% confidence interval estimate for .

JMP Solution • Open the data table called “Confidence Interval Calculator. jmp” • Supply needed inputs in columns 1 -5 • Read results in columns 6, 7, 8:

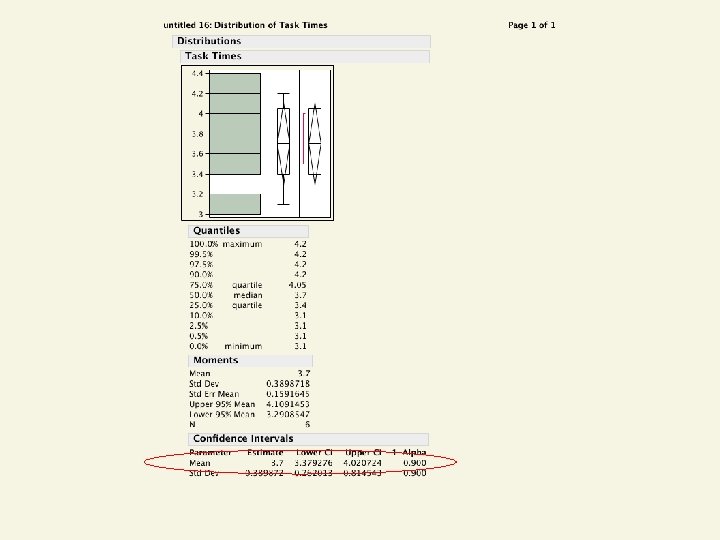
Thinking Challenge You’re a time study analyst in manufacturing. You’ve recorded the following task times (min. ): 3. 6, 4. 2, 4. 0, 3. 5, 3. 8, 3. 1. What is the 90% confidence interval estimate of the population mean task time?

Confidence Interval Solution* • x = 3. 7 • s = 0. 38987 • n = 6, df = n - 1 = 6 - 1 = 5 • t. 05 = 2. 015

Start Sigma known? Yes Use Z Interval No Confidence Intervals for the mean of a single sample n > 30? Yes Use t interval No Population Normally Distributed? Yes No Consult statistician for nonparametric tests Use t interval

Confidence Interval Estimates Confidence Intervals Mean σ Known σ Unknown Proportion

Confidence Interval Proportion 1. Assumptions • • Random sample selected Normal approximation can be used if 2. Confidence interval estimate

Estimation Example Proportion A random sample of 400 graduates showed 32 went to graduate school. Set up a 95% confidence interval estimate for p.

Using JMP via “Confidence Interval for Proportion Calculator. jmp”

Thinking Challenge You’re a production manager for a newspaper. You want to find the % defective. Of 200 newspapers, 35 had defects. What is the 90% confidence interval estimate of the population proportion defective?

Confidence Interval Solution*

Using JMP “Confidence Interval for Proportion Calculator. jmp” 1. Input: Columns 1 -3 2. Output: Columns 4 -9

Using JMP Menus Analyze >> Distribution (Select Outcome for “Y columns” box and place Frequencies in the “Freq” box; Use red triangle to select “Confidence Interval, ” then. 90) JMP uses slightly different method, formula

Finding Sample Sizes

Finding Sample Sizes for Estimating SE = Sampling Error I don’t want to sample too much or too little!

Sample Size Example What sample size is needed to be 90% confident the mean is within 5? A pilot study suggested that the standard deviation is 45.

Using JMP: Sample Size for Mean Calculator. jmp”

Finding Sample Sizes for Estimating p SE = Sampling Error If no estimate of p is available, use p = q =. 5

Sample Size Example What sample size is needed to estimate p with 90% confidence and a width of. 03?

Using JMP: “Sample Size for Proportion Calculator. jmp

Thinking Challenge You work in Human Resources at Merrill Lynch. You plan to survey employees to find their average medical expenses. You want to be 95% confident that the sample mean is within ± $50. A pilot study showed that was about $400. What sample size do you use?

Conclusion 1. Stated What Is Estimated 2. Distinguished Point & Interval Estimates 3. Explained Interval Estimates 4. Computed Confidence Interval Estimates for Population Mean & Proportion 5. Computed Sample Size 6. Discussed Finite Population Correction Factor
- Slides: 58