Statistics Confidence intervals for population mean when sigma


 Arabella samples 102 people and finds that on average they eat")


 n<30 but no need for CLT as data was originally normal. c). 95")

- Slides: 21
Statistics Confidence intervals for population mean when sigma is known.
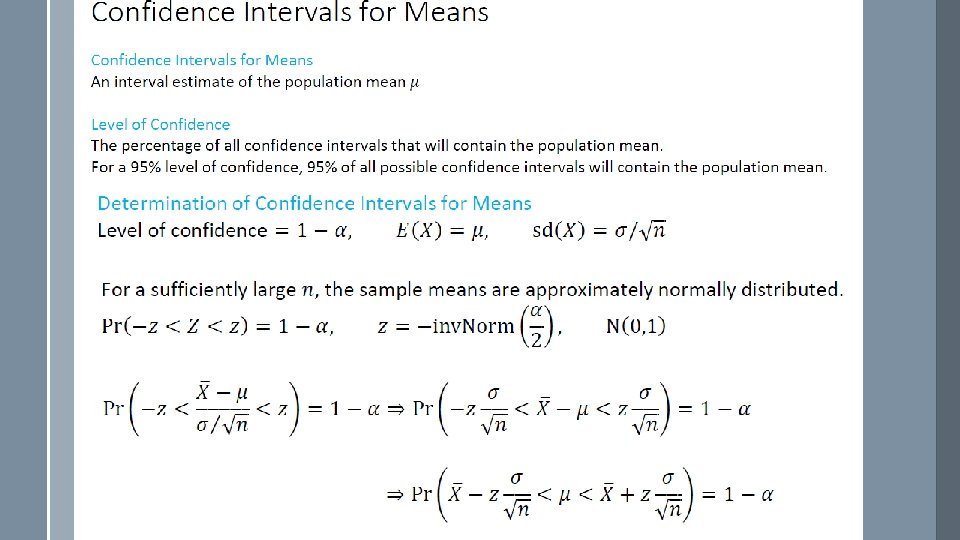
So far we have learnt that sample mean, mean , is an estimate of the population When we take a sample we do not expect the sample mean to be exactly the same as the population mean. So we use a confidence interval to give a measure of reliability. If sample is large enough (>=30) then by CLT we can assume The larger n, the better the approximation will be as when n increases, variance decreases.
From the Guide: Formulas booklet:
CONFIDENCE INTERVALS FOR THE POPULATION MEAN A confidence interval estimate of a parameter (in this case, the population mean, is an interval of values between two limits together with a percentage indicating our confidence that the interval contains the parameter. Assume we wish to find a population parameter such as the mean weekly salary of Austrian adults. It would be a difficult task. However, the CLT allows us to use our sample means to estimate quantities like this. )
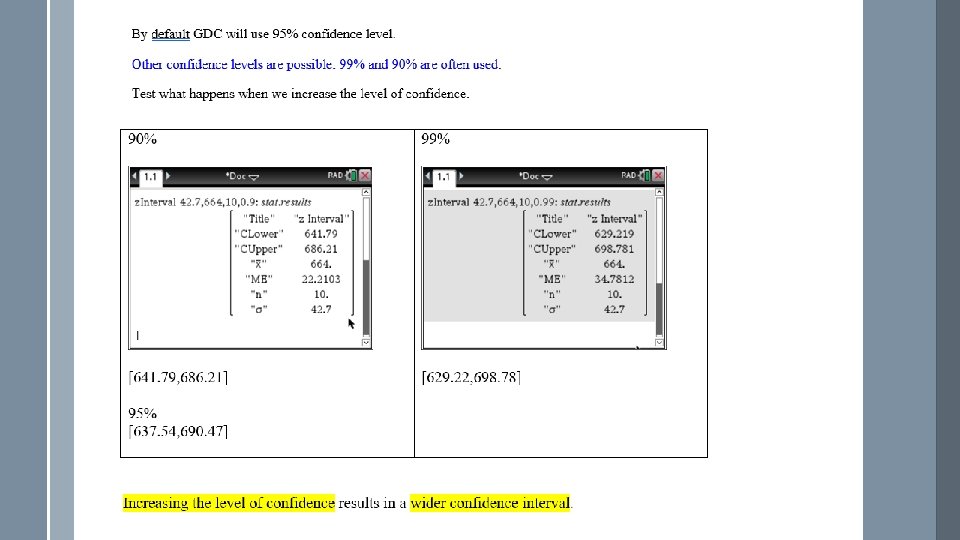
Example 1 Ten adult Austrians were selected and asked about their weekly salaries. The mean was 664 euros and standard deviation 42. 7 Find the 95% confidence interval for the mean of the population. Select Stats (not Data) Using GDC: Statistics, Confidence intervals, z. Interval The 95% confidence interval is displayed: Enter sigma, mean and sample size. The 95% confidence interval is [637. 54, 690. 47] correct to 2 decimal places.
Interpretation: Therefore we can say that we expect approximately 95% of such intervals to contain the population mean (the mean weekly salary); Or: on average 95% of the intervals would contain the mean. The level of confidence is 95%, i. e. the probability that the interval contains the parameter is 0. 95. What happens when we increase the sample size? The width of the confidence interval is decreased when the sample size increases.
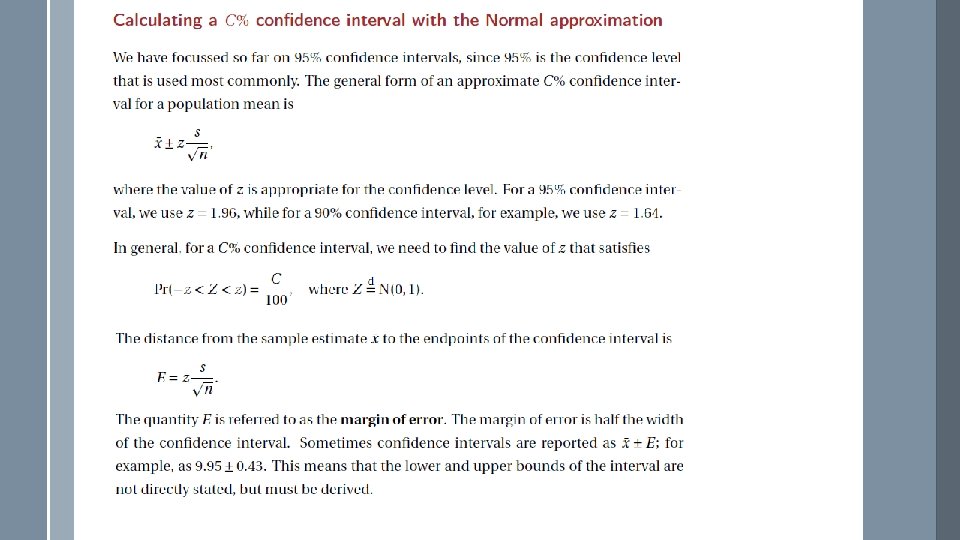
Sample mean, , is always at the centre of the confidence interval. Margin of error is half the width of the confidence interval.
Example 2
Example 3
Example 4 (a) Arabella samples 102 people and finds that on average they eat 5. 2 cups of vegetables per day with a standard deviation of 0. 8. Estimate the average daily vegetable consumption. Find a 99% confidence interval for your estimate, to 2 decimal places. (b) What sample size would be needed to reduce the interval to [5. 10, 5. 30] at the 95% level of confidence? width of the interval = 0. 2 check
Example solving gives n = 96. 04
Example with data. Bags of sugar have masses which are distributed normally with mean grams and standard deviation 4. 6 g. The sugar in each of the random sample of 5 bags taken from a production line is weighed; the results are: 498. 2, 501. 3, 503. 7, 496. 8, 502. 5. a) Calculate a 95% confidence interval for. b) Was it necessary to use CLT? c) If 200 such samples of 5 bags were taken, how many of the confidence intervals would be expected to contain ? Enter data into a list or spreadsheet, name the list sugar, Menu, Stats, Conf Int, Z Interval, Data
b) n<30 but no need for CLT as data was originally normal. c). 95 times 200 = 190 On average 190 intervals would contain true value of
Your turn: A random sample of 100 bananas from a given area has a mean mass of 210 grams and a standard deviation of 16 grams. Assuming the standard deviation obtained from the sample is a sufficiently accurate estimate of the population standard deviation, find a 95% confidence interval.