Statistics 200 b Chapter 5 Chapter 4 inference

Statistics 200 b. Chapter 5. Chapter 4: inference via likelihood now Chapter 5: applications to particular situations

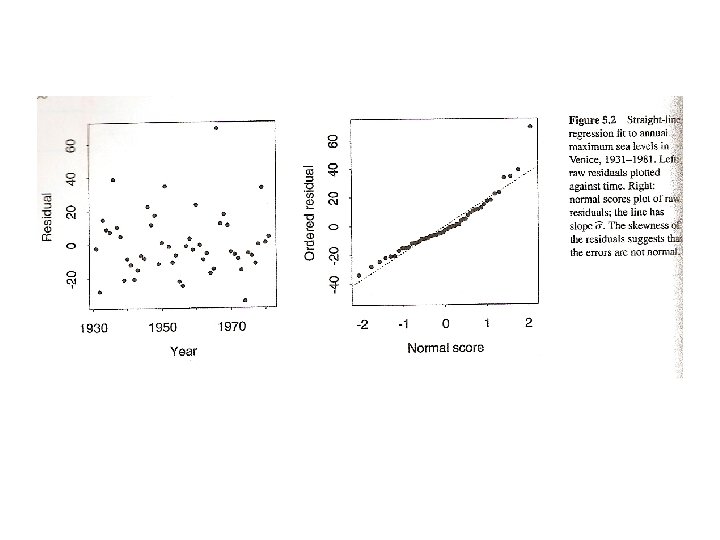
annual max sea levels 1931 -81 Y: max cm x: year

5. 1 Straight-line regression. How one variable depends on others Response, Y, random Explanatories, x, fixed (covariates)

Reparametrize. Simplifies several things

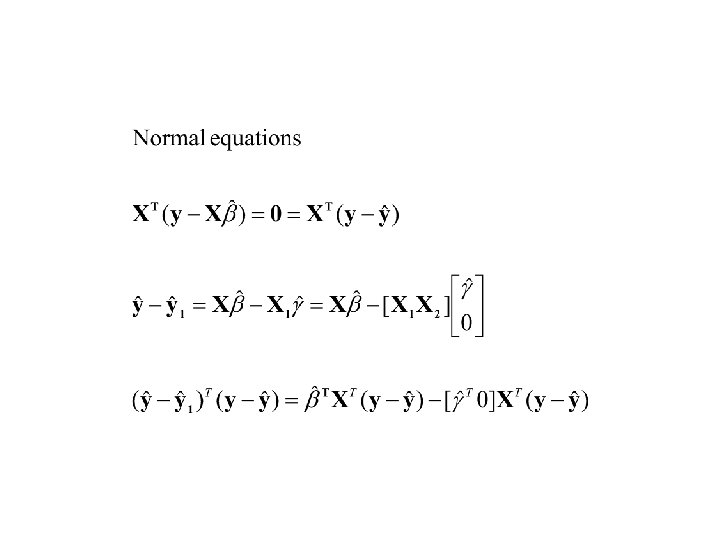
Likelihood analysis.

 Linear combinations of normals")
Distributions. j : IN(0, 2 ) Linear combinations of normals
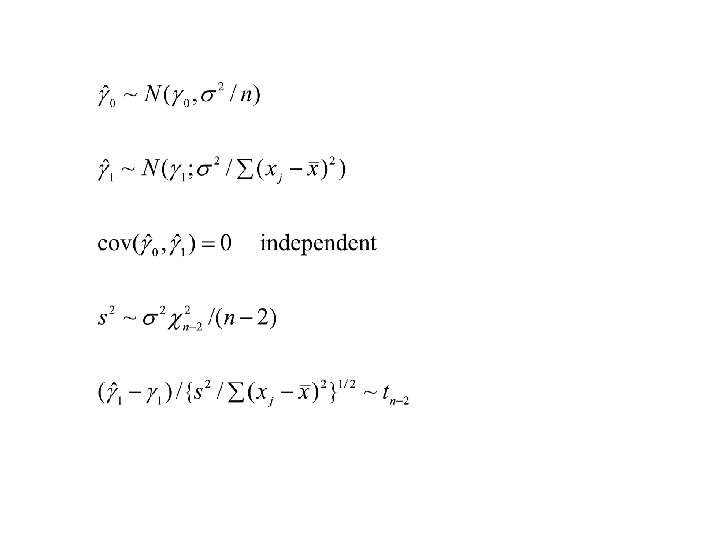

Venice sea level. n = 51

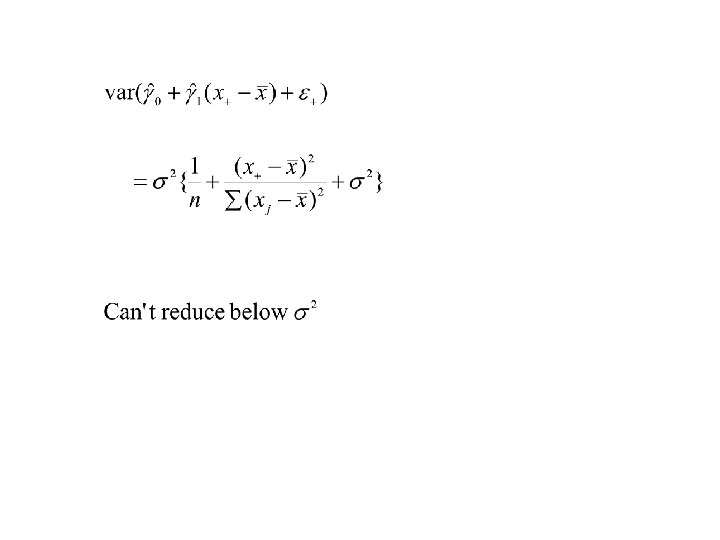
Prediction. at x+

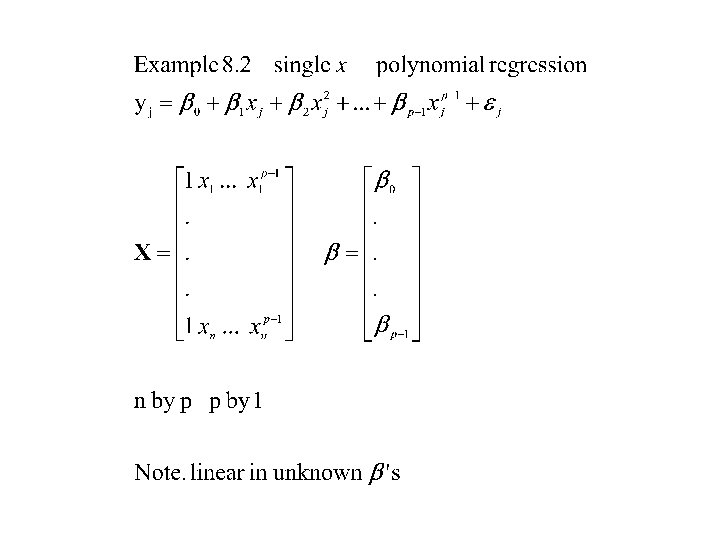
Example.

annual max sea levels 1931 -81 Y: max cm x: year
 residuals.")
(Raw) residuals.

Stat 200 b. Chapter 8. Linear regression models.

n by 1, n by 2, 2 by 1, n by 1

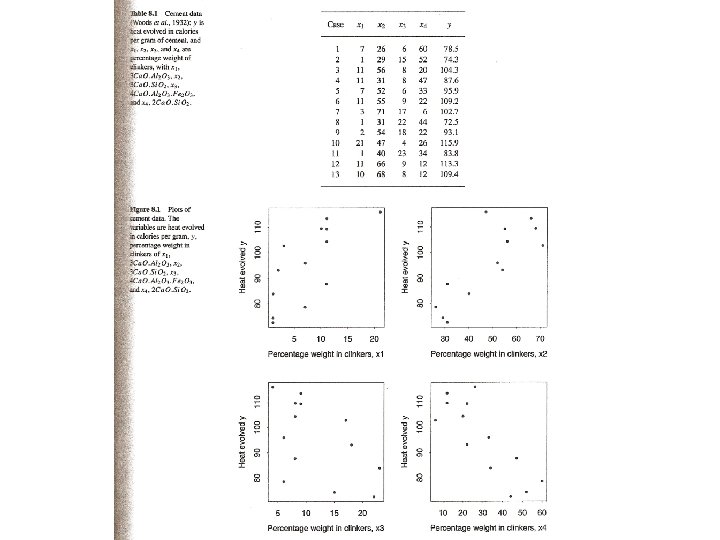
13 by 5
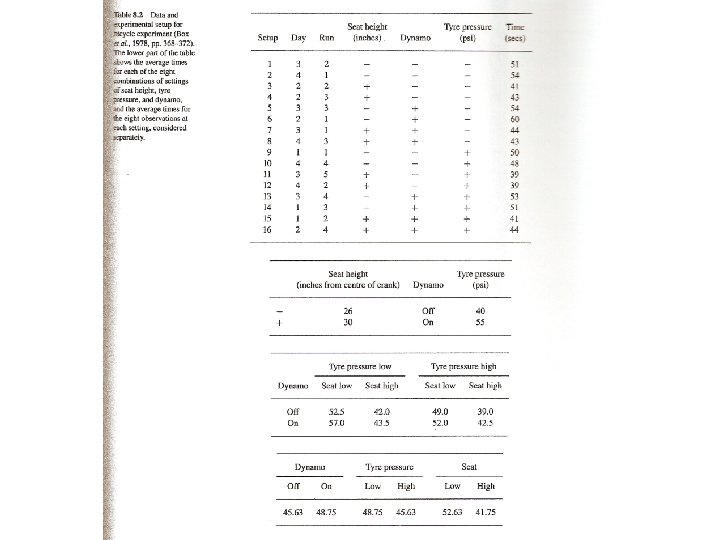

Effect of increasing seat height is 2 1

Some matrix review transpose multiplication inverse derivatives

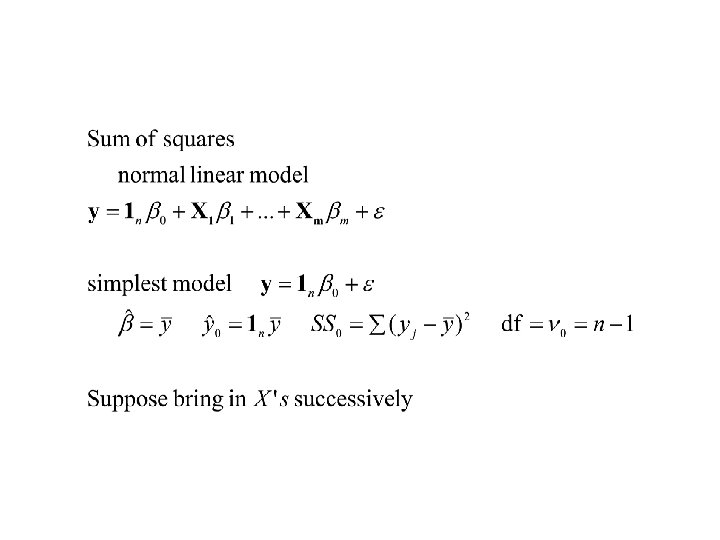
Normal linear model. Estimation

Profile log likelihood

Straight-line/simple regression.
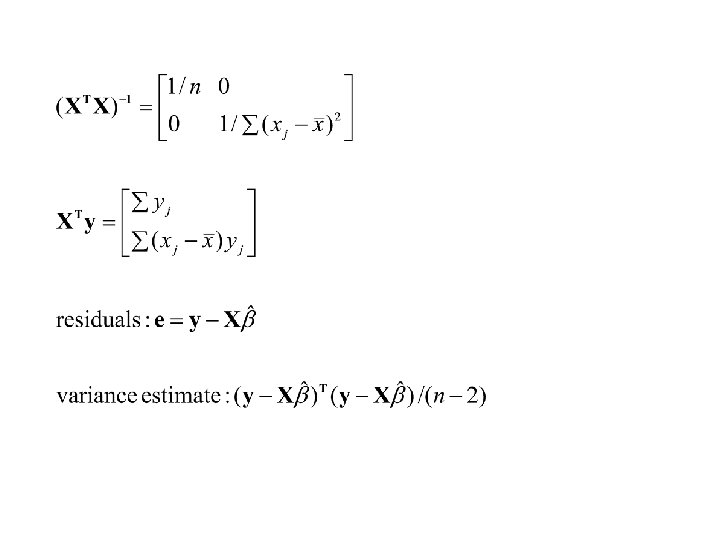

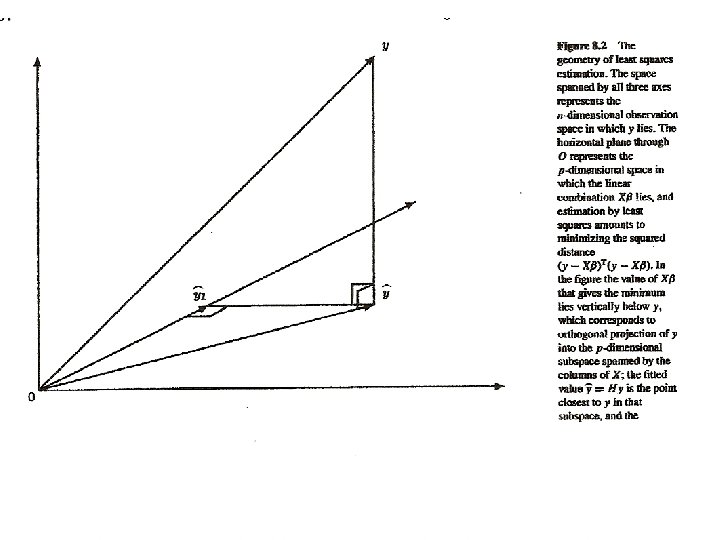
Fitted values. NB. Assuming matrix inverse exists

Weighted least squares. inverse existing

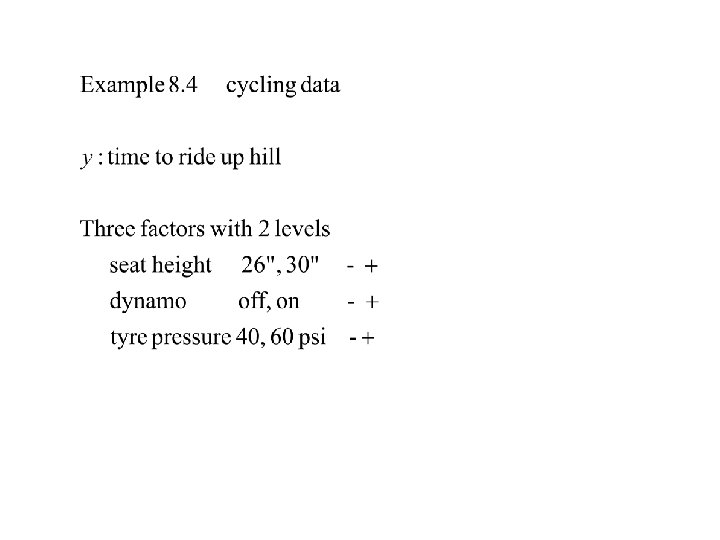
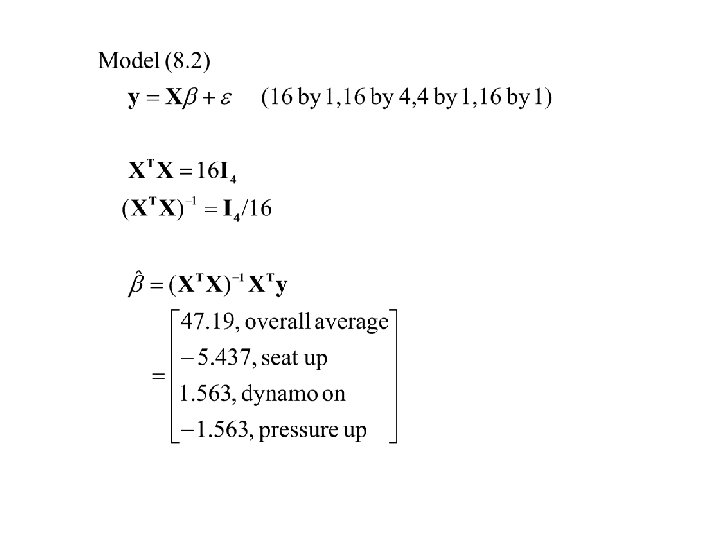
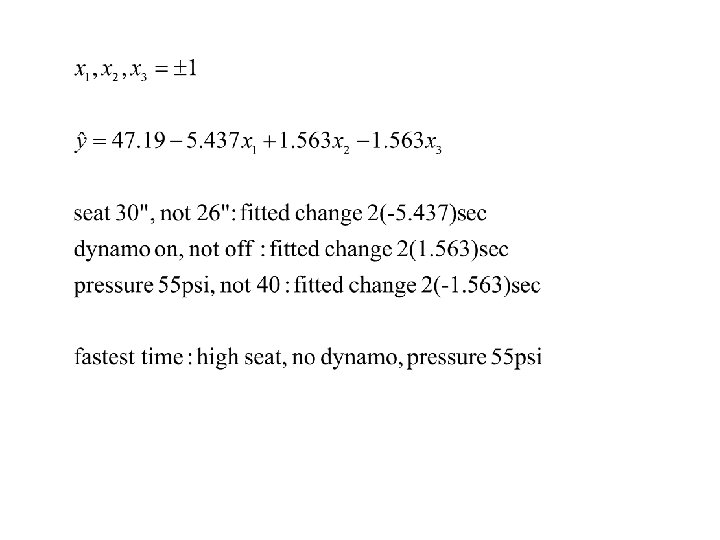
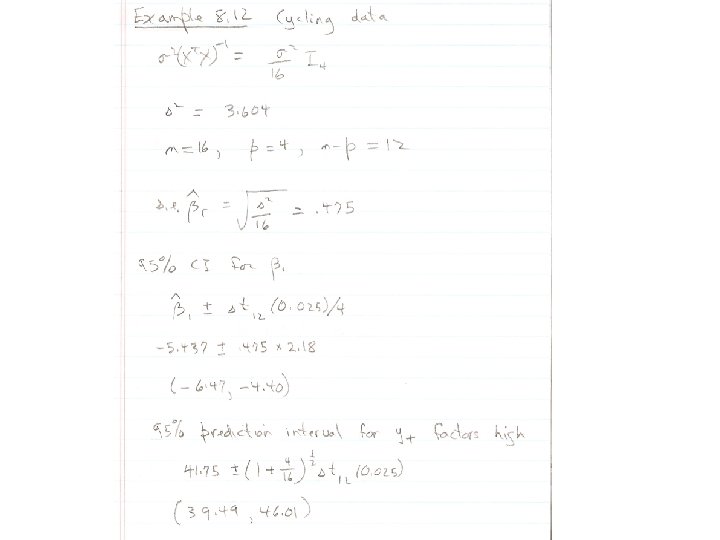
Example 8. 8. Cycling data

Example 8. 10. Maize data.

Likelihood quantities.

Take expected values

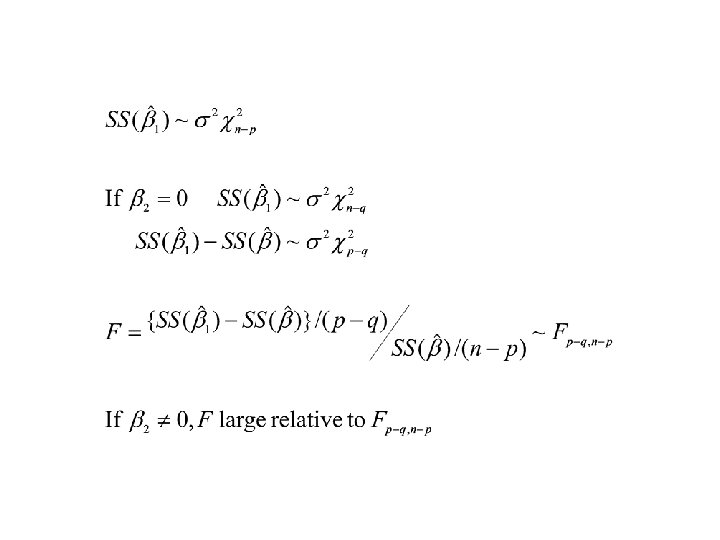
Normal distribution theory. Full rank case

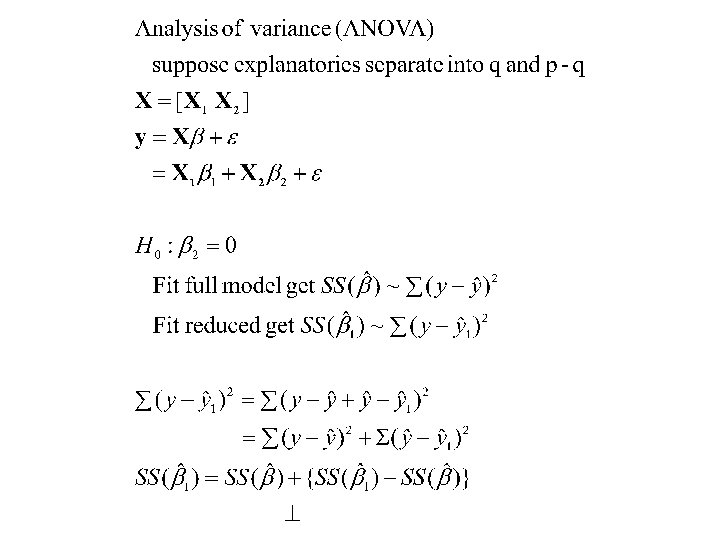
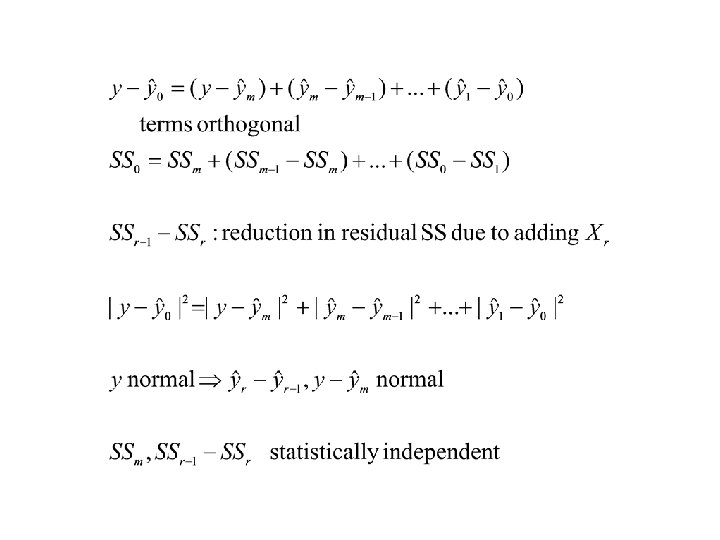
A useful decomposition.

Confidence interval.

Gauss-Markov Theorem. page 374

There is a generalized inverse variant Example.

Eg. Teaching methods data, p. 427 Method average Usual 17 14 24 20 24 … 24 19. 67 Praised 28 30 29 24 27 … 23 27. 41 two-sample model / one-way layout


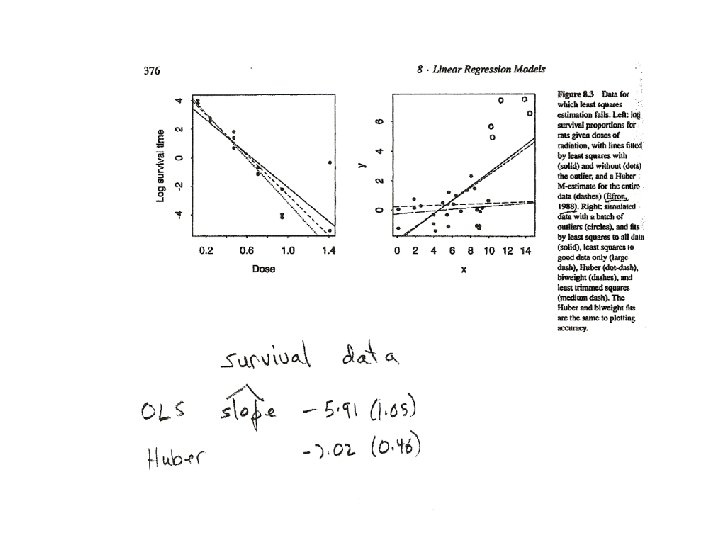
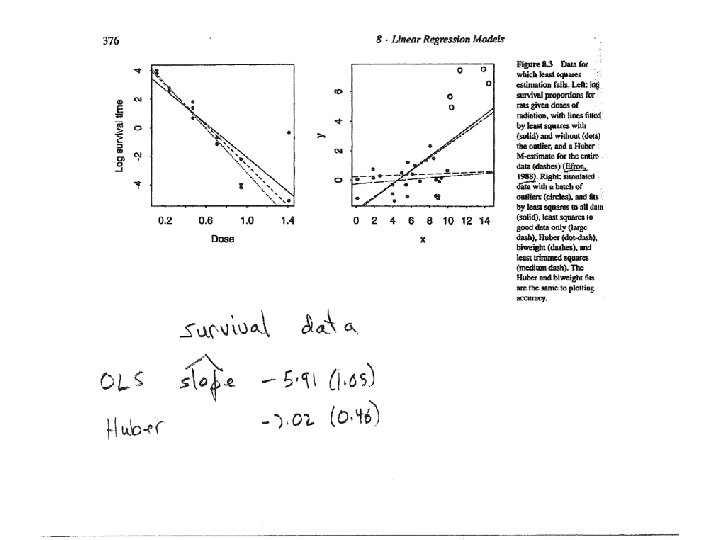
Robust/resistant estimators outlier - observation that is unusual compared to others resistant statistic - not strongly affected by outliers robust estimate - performs well under a range of potential models centered at an ideal model


13 by 5


ANOVA table

13 by 5
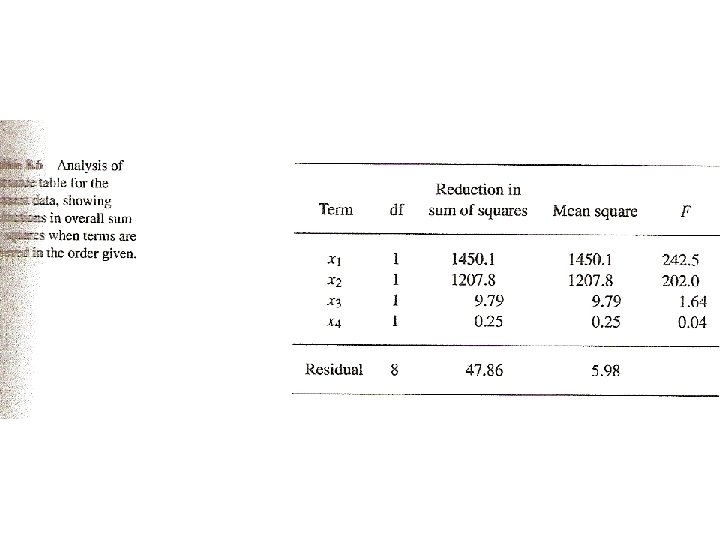
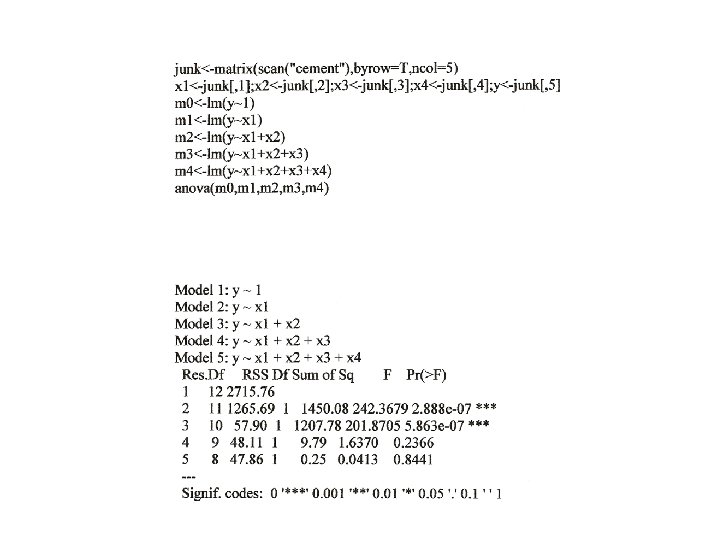

Model 1: y ~ 1 Model 2: y ~ x 1 Model 3: y ~ x 1 + x 2 Model 4: y ~ x 1 + x 2 + x 3 Model 5: y ~ x 1 + x 2 + x 3 + x 4 Res. Df RSS Df Sum of Sq F Pr(>F) 1 12 2715. 76 2 11 1265. 69 1 1450. 08 242. 3679 2. 888 e-07 *** 3 10 57. 90 1 1207. 78 201. 8705 5. 863 e-07 *** 4 9 48. 11 1 9. 79 1. 6370 0. 2366 5 8 47. 86 1 0. 25 0. 0413 0. 8441 Model 1: y ~ 1 Model 2: y ~ x 4 Model 3: y ~ x 4 + x 3 Model 4: y ~ x 4 + x 3 + x 2 Model 5: y ~ x 4 + x 3 + x 2 + x 1 Res. Df RSS Df Sum of Sq F Pr(>F) 1 12 2715. 76 2 11 883. 87 1 1831. 90 306. 1859 1. 161 e-07 *** 3 10 175. 74 1 4 9 73. 81 1 101. 92 17. 0356 0. 00331 ** 5 8 47. 86 1 25. 95 4. 3375 0. 07082 708. 13 118. 3577 4. 509 e-06 ***
- Slides: 62