Statistical Water Supply Index SWSI z Surface Water
 z Surface Water Supply is the reservoir storage at")
 z Originally developed in early 1980 s")
 of respective hydrologic variable")

 of reservoir storage +")


- Slides: 14
Statistical Water Supply Index (SWSI) z Surface Water Supply is the reservoir storage at the beginning of, plus the natural streamflow during, the primary snowmelt and growing season relevant to the region of interest. z Index is an appropriately scaled numeric indicator of the status of the elements used to calculate the surface water supply.
History of Statistical Water Supply Index (SWSI) z Originally developed in early 1980 s in Colorado z Original formulation, with variations, also adopted by Montana and Oregon z Procedure reviewed by NRCS in cooperation with Colorado Climate Center in early 1990 s z Revised formulation based on water supply forecasts published in 1993 z New formulation, with variations, adopted by Idaho, New Mexico, and Colorado
Original Formulation of SWSI where: P = nonexceedance probability (%) of respective hydrologic variable a, b, c, d = subjective weights
Limitations of Original Formulation of SWSI n n n Statistical properties of the combination of non-exceedance probabilities are not known Subjective weights No explicit definition of surface water supply
Revised Formulation of SWSI where: P = non-exceedance probability (%) of reservoir storage + observed or forecasted streamflow (season dependent) 50 = centers the distribution on zero 12 = scales to existing ranges for drought existing indexes
Streamflow Variable Used in Revised Formulation of SWSI z Streamflow forecast is used when available, otherwise use previous month's streamflow as alternate. z Official streamflow forecasts are available January - May or June z Forecasts during summer and fall months should be possible in areas with significant ENSO signal and/or relationship with previous month's precipitation
Example Monthly Formulation - CO z Oct-Nov: Obs. Res. Storage + Obs. Streamflow z Dec: Obs. Res. Storage + Apr-Jul / Sep volume based on Dec 1 SWE / SOI as relevant z Jan-Apr: Obs. Res. Storage + Apr-Jul /Sep volume forecasts
Example Monthly Formulation - CO z May: Obs. Res. Storage + Apr-Jul / Sep volume forecasts - Apr runoff z Jun: Obs. Res. Storage + Apr-Jul / Sep volume forecasts - (Apr-May) runoff z Jul-Sep: Obs. Res. Storage + previous month’s obs. Streamflow
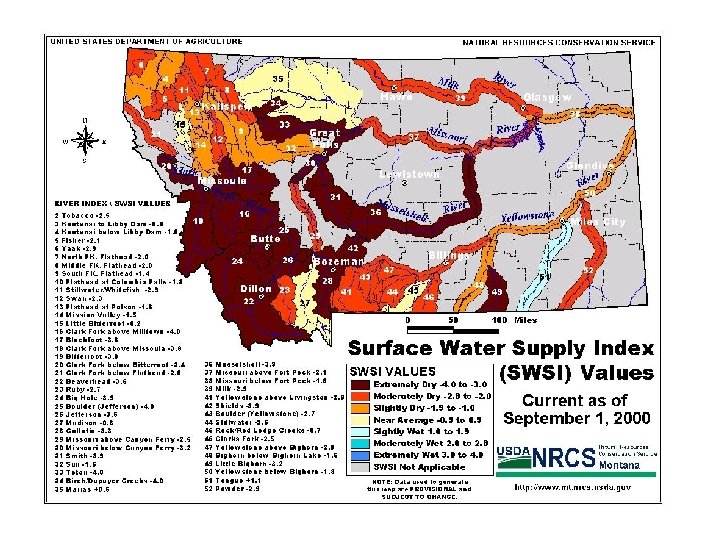
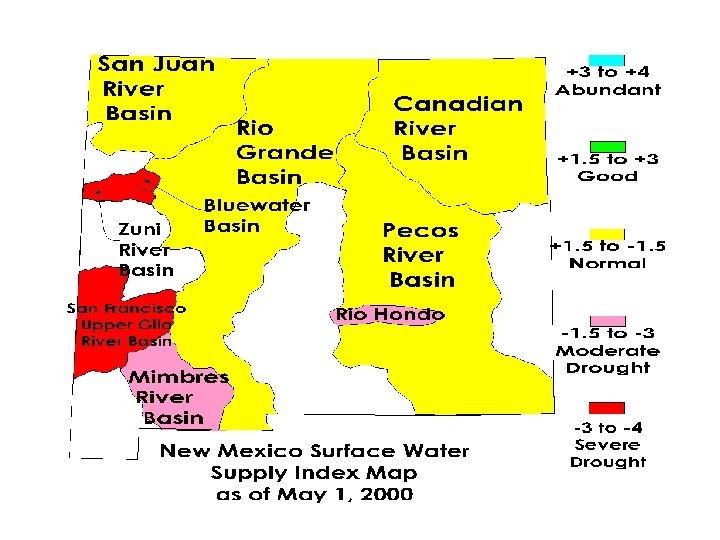
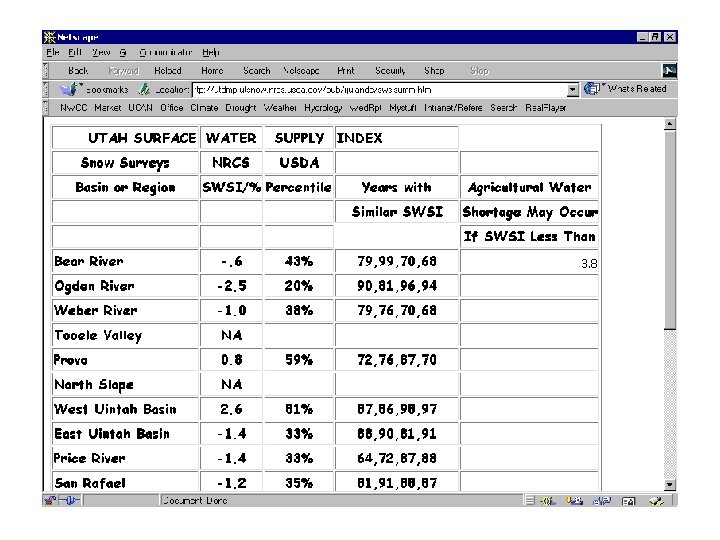
Current SWSI Implementation
Additional Considerations z Data Sources: Precipitation, snowpack, streamflow, reservoir storage. z Centralized / De-Centralized computation z Actual spatial representation: Entire basin / “ribbon” along the river z Presentation: Graphic / Tabular
Proposed Initial Selections z Climate - UCAN z Streamflow - NWIS z De-Centralized --> Centralized z River-Ribbon presentation z Graphic and Tabular