
Statistical tree estimation Tandy Warnow Topics Phylogeny as




- Slides: 111
Statistical tree estimation Tandy Warnow
Topics • Phylogeny as statistical estimation problem • Stochastic models of evolution • Distance-based estimation • Maximum parsimony tree estimation • Maximum likelihood tree estimation • Bayesian tree estimation
Phylogeny estimation as a statistical inverse problem
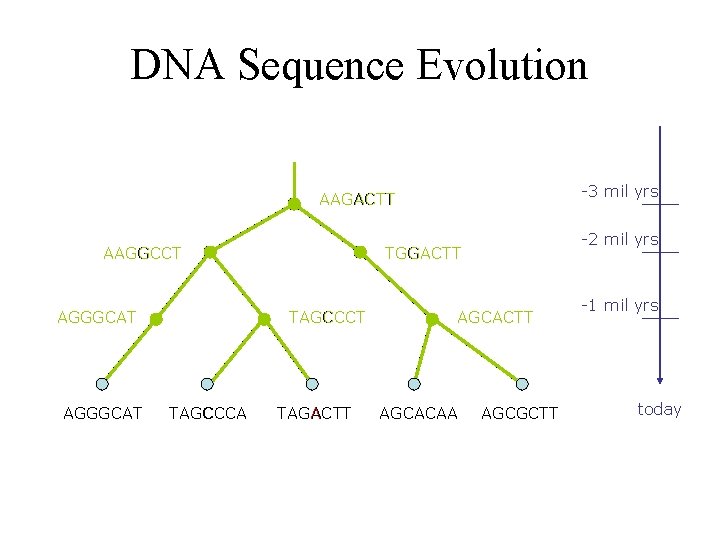
Estimation of evolutionary trees as a statistical inverse problem • We can consider characters as properties that evolve down trees. • We observe the character states at the leaves, but the internal nodes of the tree also have states. • The challenge is to estimate the tree from the properties of the taxa at the leaves. This is enabled by characterizing the evolutionary process as accurately as we can.
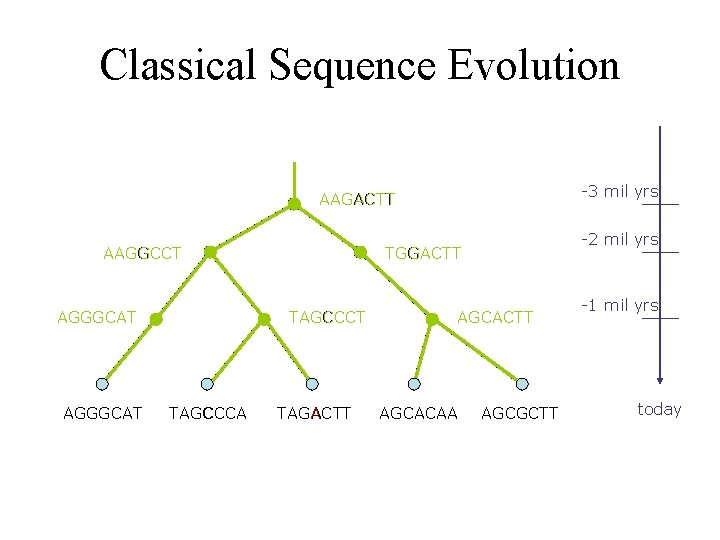
DNA Sequence Evolution -3 mil yrs AAGACTT AAGGCCT AGGGCAT TAGCCCA -2 mil yrs TGGACTT TAGACTT AGCACAA AGCGCTT -1 mil yrs today
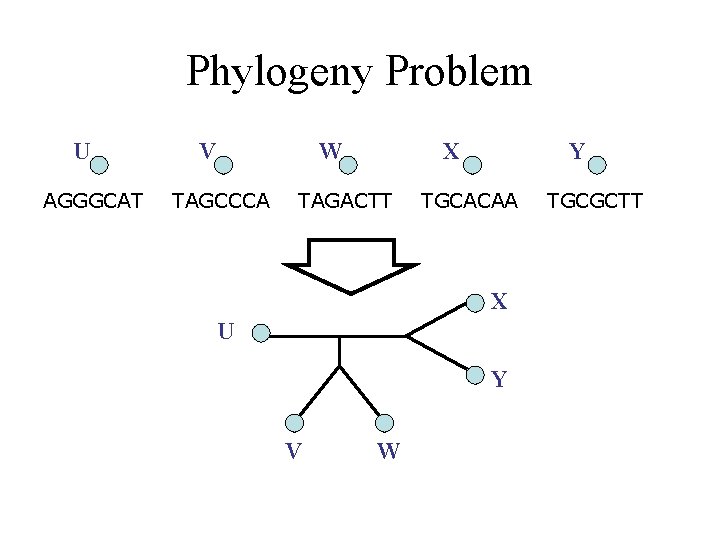
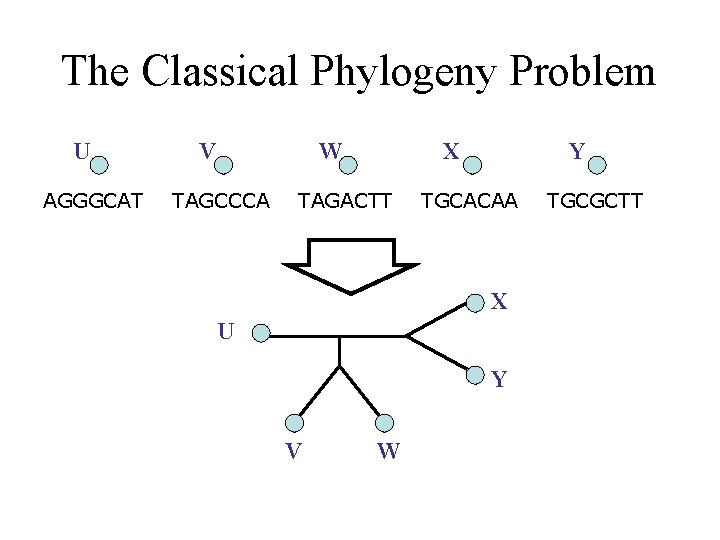
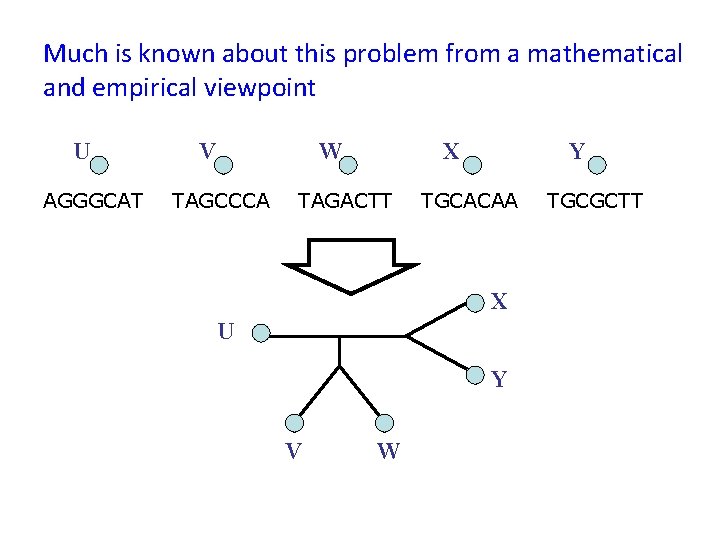
Phylogeny Problem U AGGGCAT V W TAGCCCA X TAGACTT Y TGCACAA X U Y V W TGCGCTT
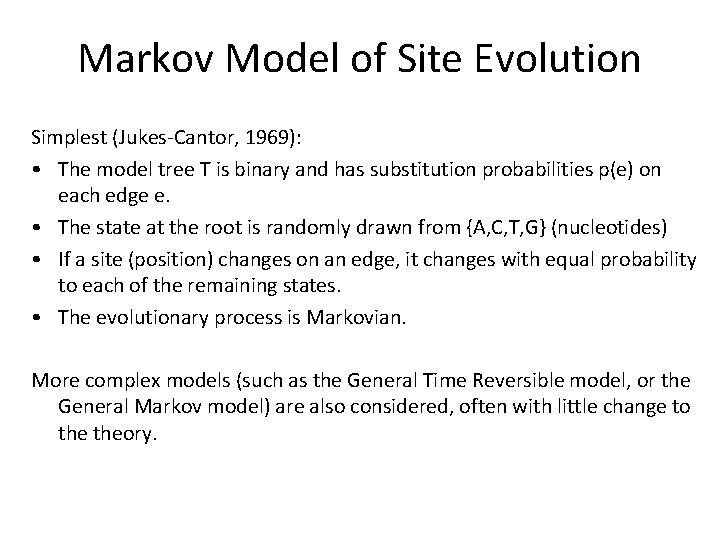
Markov Model of Site Evolution Simplest (Jukes-Cantor, 1969): • The model tree T is binary and has substitution probabilities p(e) on each edge e. • The state at the root is randomly drawn from {A, C, T, G} (nucleotides) • If a site (position) changes on an edge, it changes with equal probability to each of the remaining states. • The evolutionary process is Markovian. More complex models (such as the General Time Reversible model, or the General Markov model) are also considered, often with little change to theory.
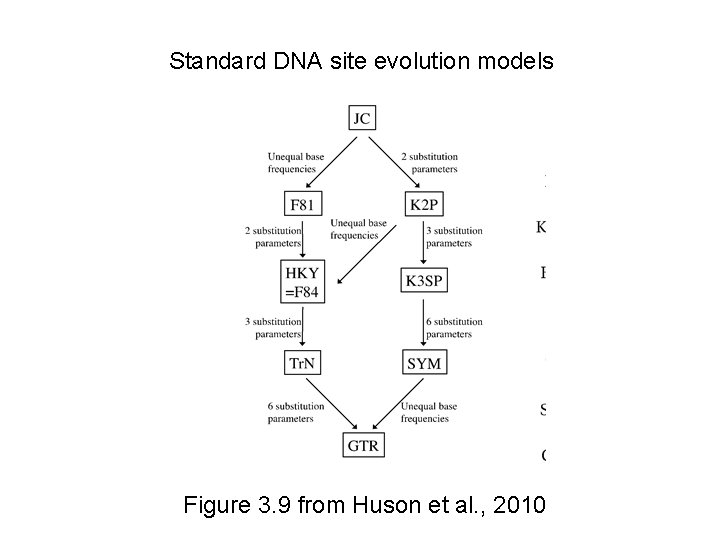
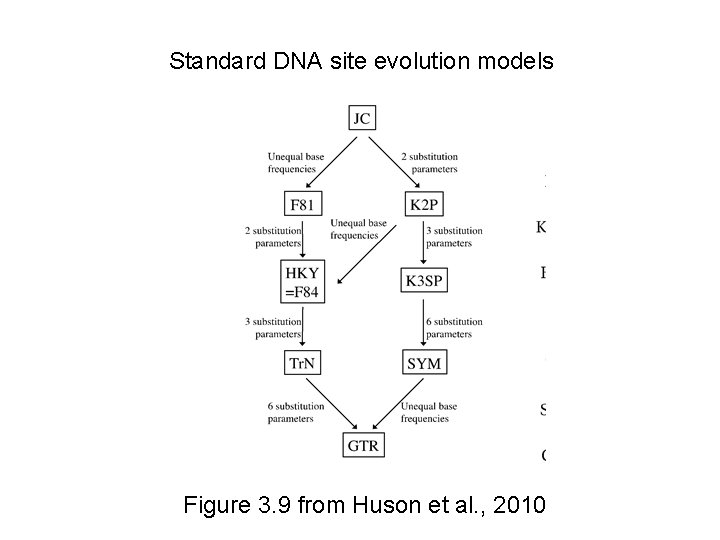
Standard DNA site evolution models Figure 3. 9 from Huson et al. , 2010
Questions about model trees • Is the model tree topology identifiable? – yes • Are the branch lengths and other numeric parameters of the model tree identifiable? – yes • Is the root of the model tree identifiable? – no
Answers about model trees • Is the model tree topology identifiable? – yes • Are the branch lengths and other numeric parameters of the model tree identifiable? – yes • Is the root of the model tree identifiable? – no
Phylogeny estimation methods • • Distance-based methods Maximum parsimony Maximum likelihood Bayesian MCMC And other types that are not as commonly used
Performance criteria • Running time • Space • Statistical performance issues (e. g. , statistical consistency and sequence length requirements) • “Topological accuracy” with respect to the underlying true tree, typically studied in simulation. • Accuracy with respect to a mathematical score (e. g. tree length or likelihood score) on real data
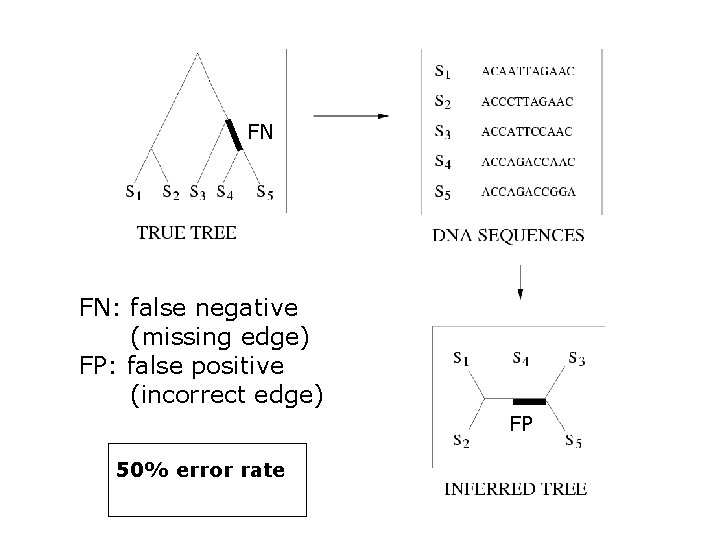
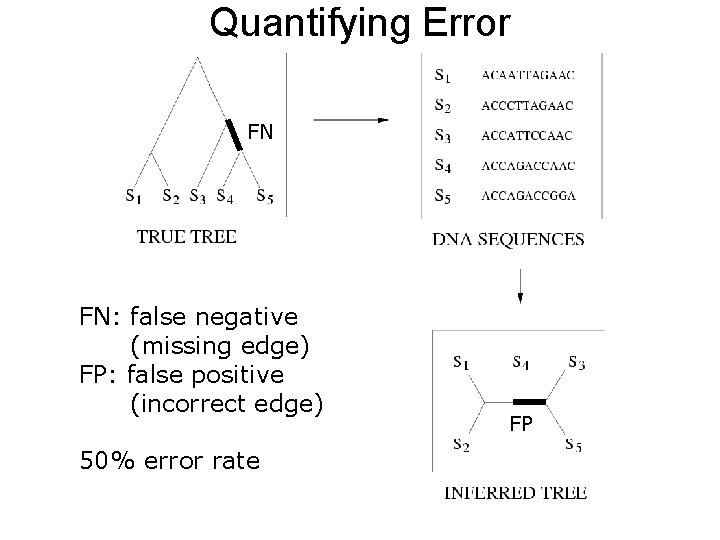
FN FN: false negative (missing edge) FP: false positive (incorrect edge) FP 50% error rate
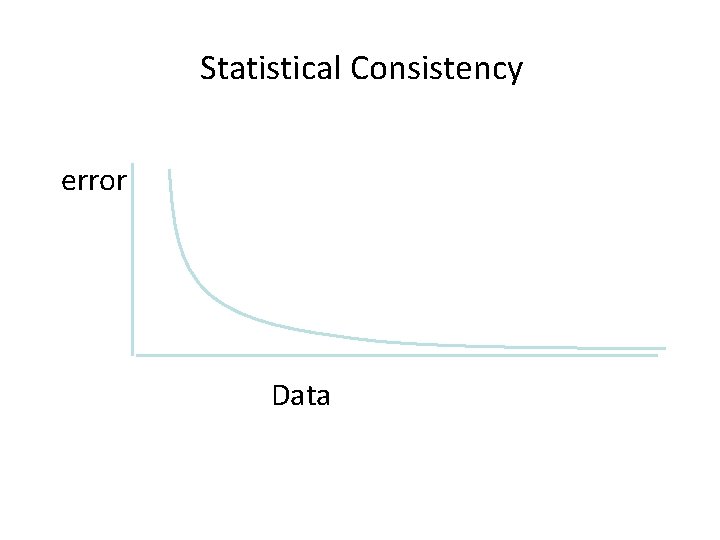
Statistical Consistency error Data
Statistical models • Simple example: coin tosses. • Suppose your coin has probability p of turning up heads, and you want to estimate p. How do you do this?
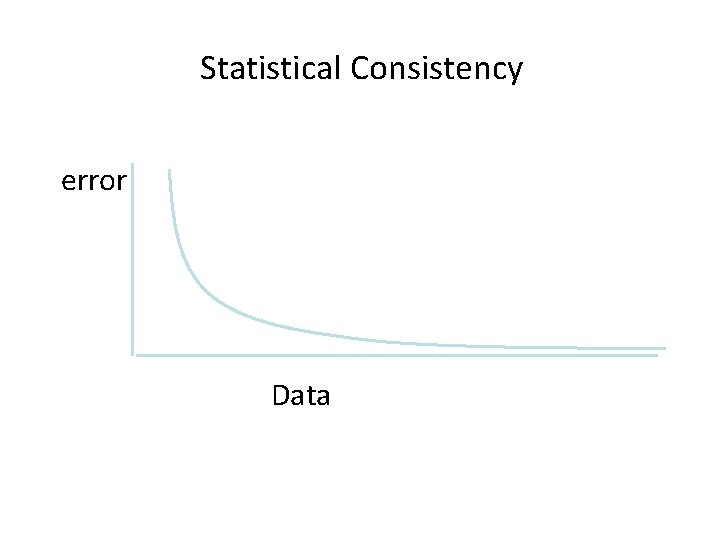
Estimating p • Toss coin repeatedly • Let your estimate q be the fraction of the time you get a head • Obvious observation: q will approach p as the number of coin tosses increases • This algorithm is a statistically consistent estimator of p. That is, your error |q-p| goes to 0 (with high probability) as the number of coin tosses increases.
Another estimation problem • Suppose your coin is biased either towards heads or tails (so that p is not 1/2). • How do you determine which type of coin you have? • Same algorithm, but say “heads” if q>1/2, and “tails” if q<1/2. For large enough number of coin tosses, your answer will be correct with high probability.
Markov models of character evolution down trees • The character might be binary, indicating absence or presence of some property at each node in the tree. • The character might be multi-state, taking on one of a specific set of possible states. Typical examples in biology: the nucleotide in a particular position within a multiple sequence alignment. • A probabilistic model of character evolution describes a random process by which a character changes state on each edge of the tree. Thus it consists of a tree T and associated parameters that determine these probabilities. • The “Markov” property assumes that the state a character attains at a node v is determined only by the state at the immediate ancestor of v, and not also by states before then.
Binary characters • Simplest type of character: presence (1) or absence (0). • How do we model the presence or absence of a property?
Cavender-Farris-Neyman (CFN) • Models binary sequence evolution • For each edge e, there is a probability p(e) of the property “changing state” (going from 0 to 1, or vice-versa), with 0<p(e)<0. 5 (to ensure that unrooted CFN tree topologies are identifiable). • Every position evolves under the same process, independently of the others.
Estimating trees under statistical models… • Instead of directly estimating the tree, we try to estimate the process itself. • For example, we try to estimate the probability that two leaves will have different states for a random character.
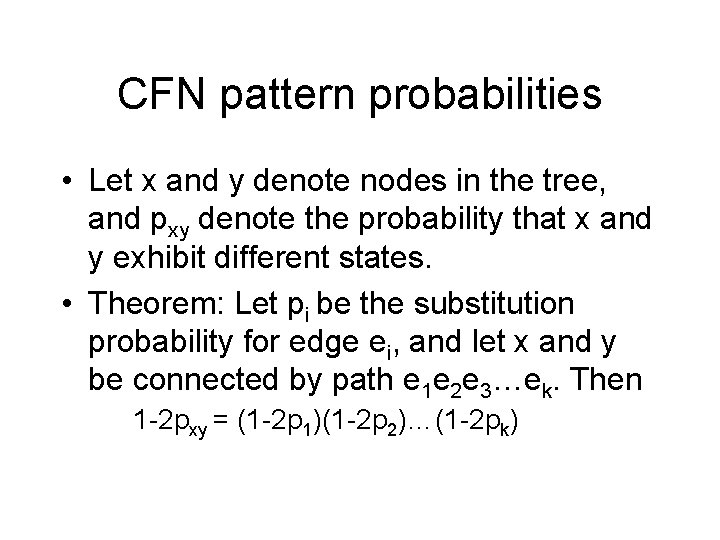
CFN pattern probabilities • Let x and y denote nodes in the tree, and pxy denote the probability that x and y exhibit different states. • Theorem: Let pi be the substitution probability for edge ei, and let x and y be connected by path e 1 e 2 e 3…ek. Then 1 -2 pxy = (1 -2 p 1)(1 -2 p 2)…(1 -2 pk)
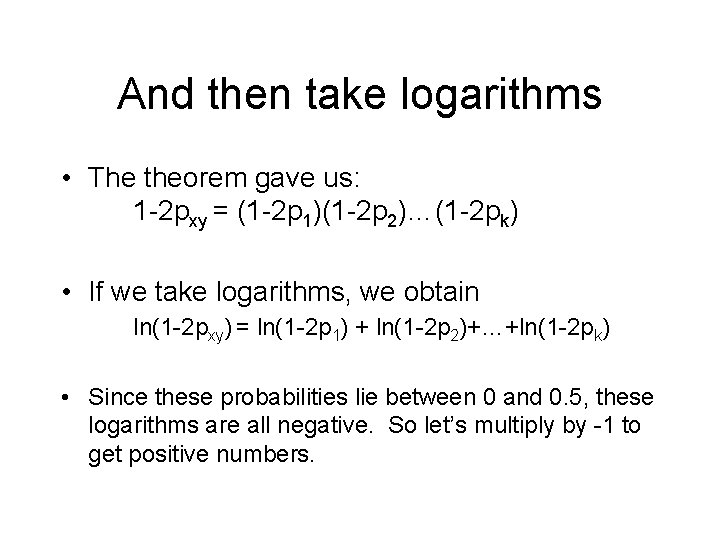
And then take logarithms • The theorem gave us: 1 -2 pxy = (1 -2 p 1)(1 -2 p 2)…(1 -2 pk) • If we take logarithms, we obtain ln(1 -2 pxy) = ln(1 -2 p 1) + ln(1 -2 p 2)+…+ln(1 -2 pk) • Since these probabilities lie between 0 and 0. 5, these logarithms are all negative. So let’s multiply by -1 to get positive numbers.
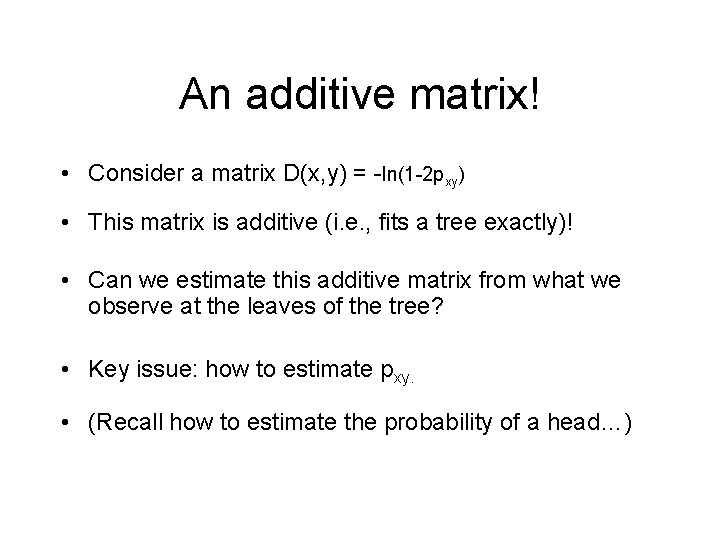
An additive matrix! • Consider a matrix D(x, y) = -ln(1 -2 pxy) • This matrix is additive (i. e. , fits a tree exactly)! • Can we estimate this additive matrix from what we observe at the leaves of the tree? • Key issue: how to estimate pxy. • (Recall how to estimate the probability of a head…)
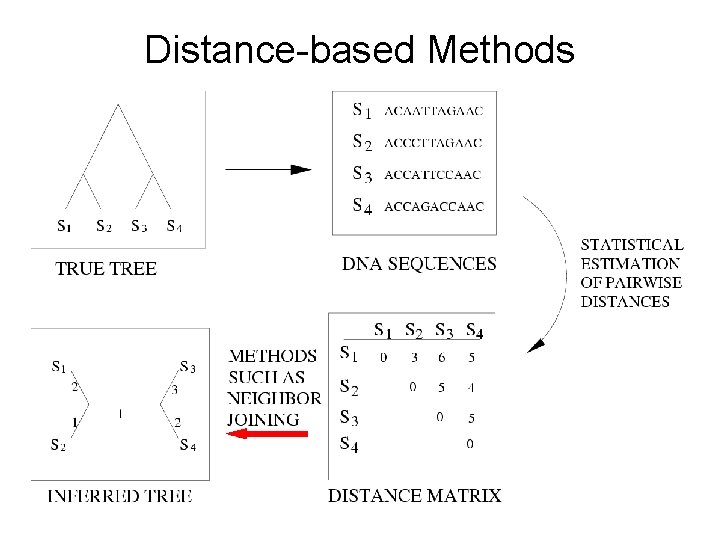
Distance-based Methods
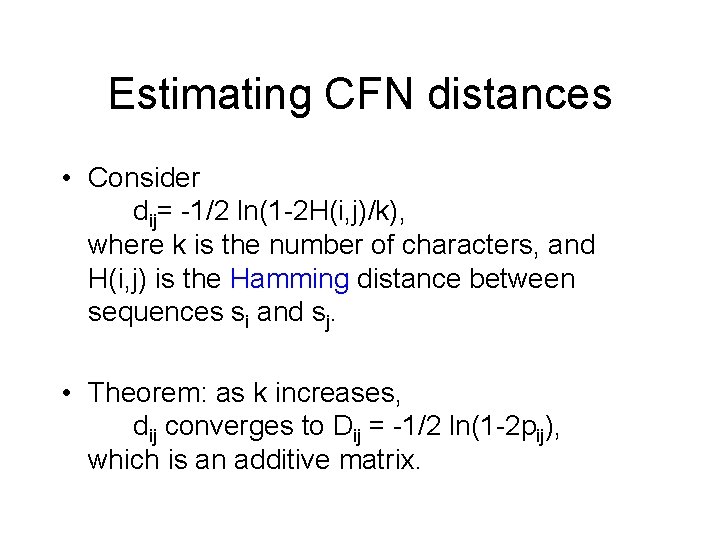
Estimating CFN distances • Consider dij= -1/2 ln(1 -2 H(i, j)/k), where k is the number of characters, and H(i, j) is the Hamming distance between sequences si and sj. • Theorem: as k increases, dij converges to Dij = -1/2 ln(1 -2 pij), which is an additive matrix.
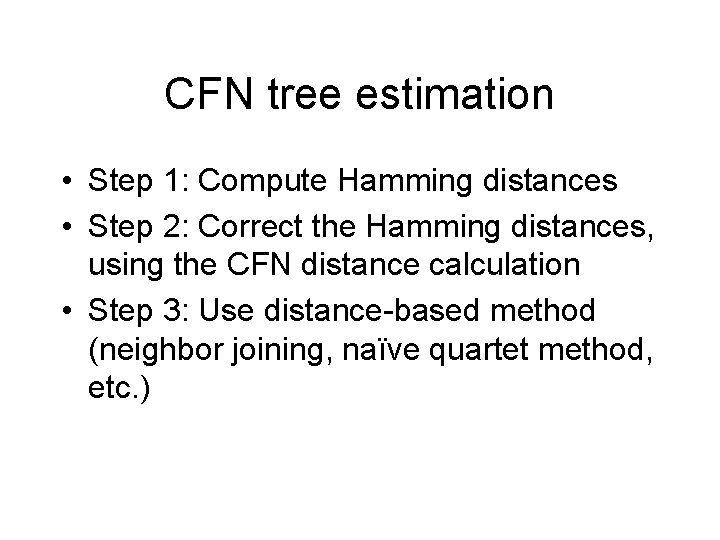
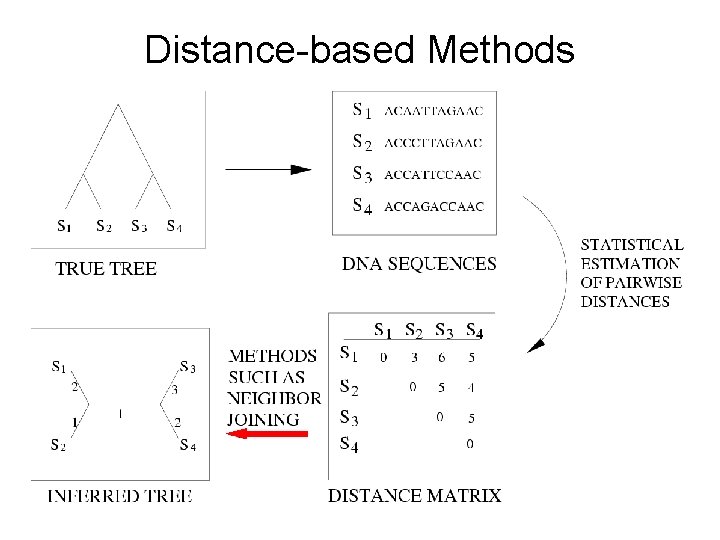
CFN tree estimation • Step 1: Compute Hamming distances • Step 2: Correct the Hamming distances, using the CFN distance calculation • Step 3: Use distance-based method (neighbor joining, naïve quartet method, etc. )
Four Point Method • Task: Given 4 x 4 dissimilarity matrix, compute a tree on four leaves • Solution: Compute three pairwise sums, and take the split ij|kl that gives the minimum! • When is this guaranteed accurate?
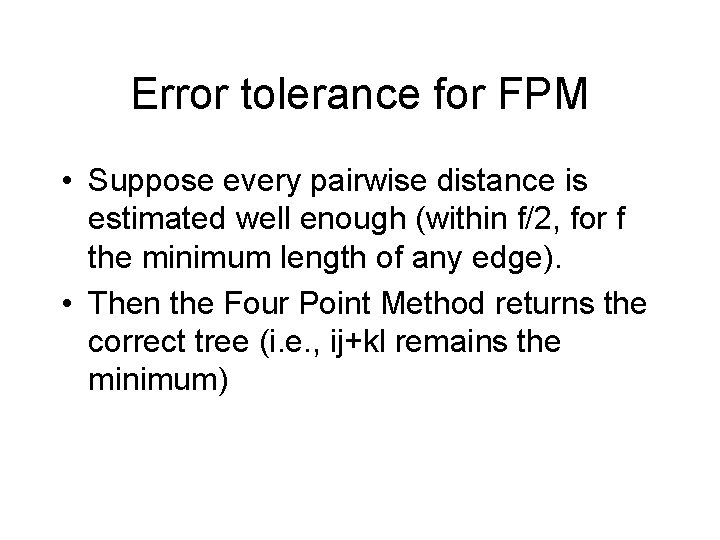
Error tolerance for FPM • Suppose every pairwise distance is estimated well enough (within f/2, for f the minimum length of any edge). • Then the Four Point Method returns the correct tree (i. e. , ij+kl remains the minimum)
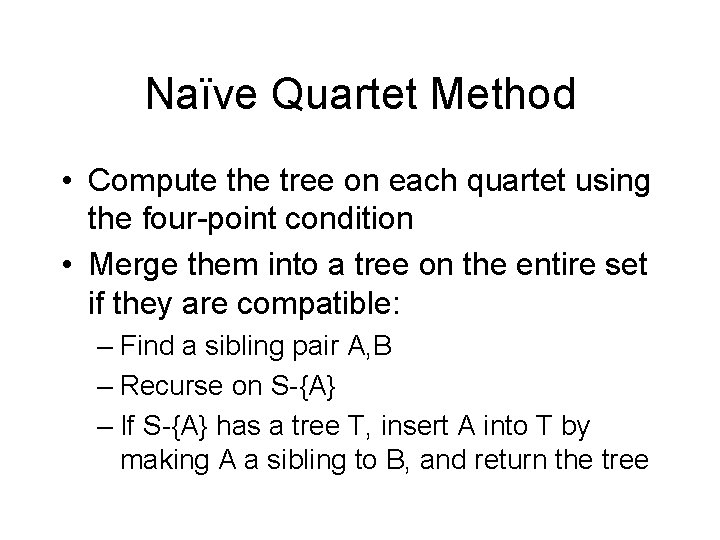
Naïve Quartet Method • Compute the tree on each quartet using the four-point condition • Merge them into a tree on the entire set if they are compatible: – Find a sibling pair A, B – Recurse on S-{A} – If S-{A} has a tree T, insert A into T by making A a sibling to B, and return the tree
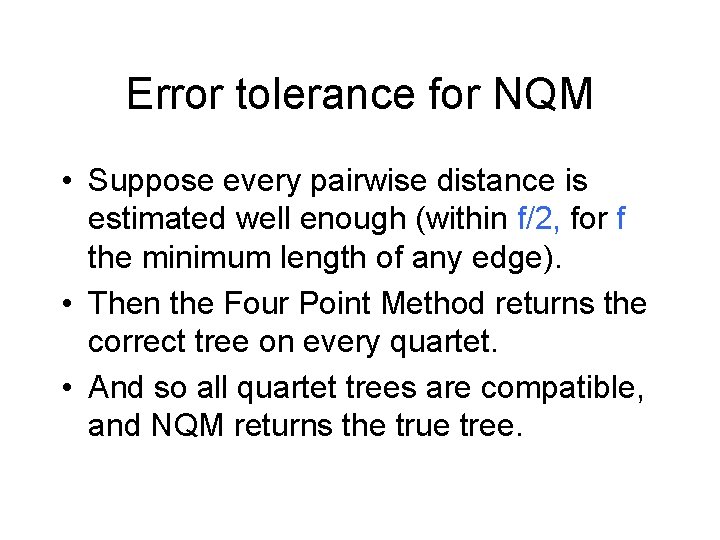
Error tolerance for NQM • Suppose every pairwise distance is estimated well enough (within f/2, for f the minimum length of any edge). • Then the Four Point Method returns the correct tree on every quartet. • And so all quartet trees are compatible, and NQM returns the true tree.
In other words: • The NQM method is statistically consistent methods for estimating CFN trees! • Plus it is polynomial time! Can we use it on DNA sequences?
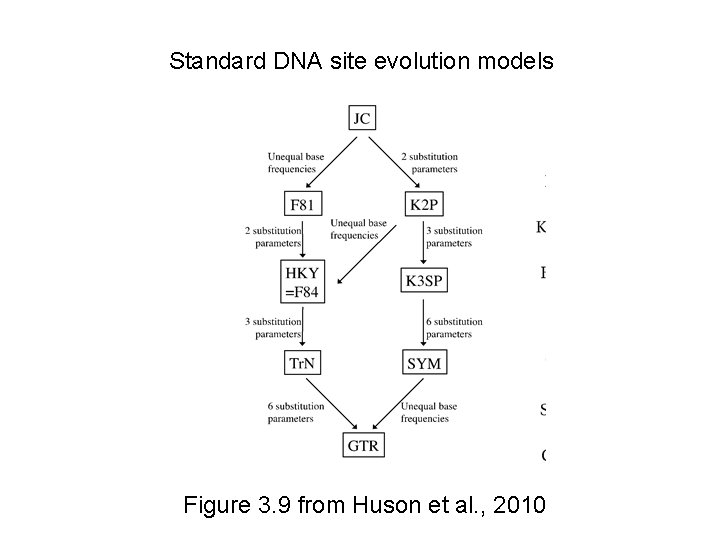
Standard DNA site evolution models Figure 3. 9 from Huson et al. , 2010
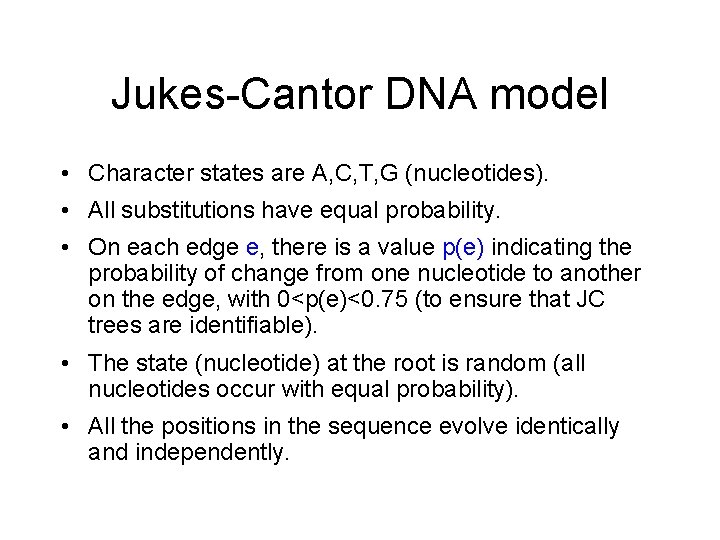
Jukes-Cantor DNA model • Character states are A, C, T, G (nucleotides). • All substitutions have equal probability. • On each edge e, there is a value p(e) indicating the probability of change from one nucleotide to another on the edge, with 0<p(e)<0. 75 (to ensure that JC trees are identifiable). • The state (nucleotide) at the root is random (all nucleotides occur with equal probability). • All the positions in the sequence evolve identically and independently.
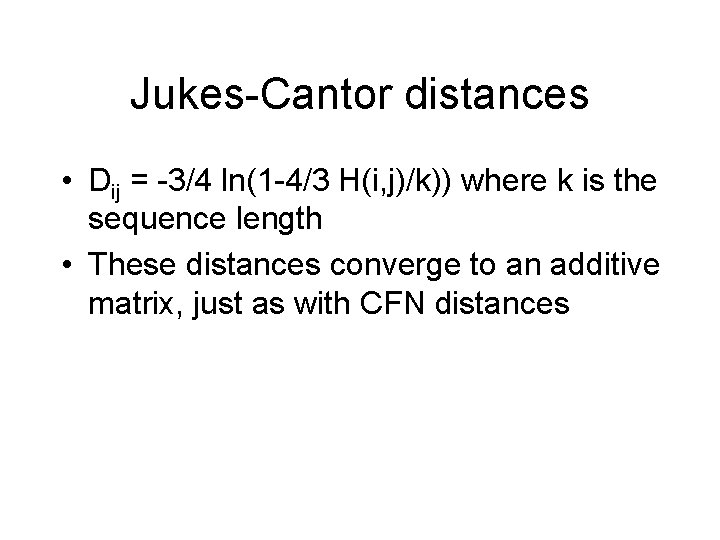
Jukes-Cantor distances • Dij = -3/4 ln(1 -4/3 H(i, j)/k)) where k is the sequence length • These distances converge to an additive matrix, just as with CFN distances
Distance-based Methods
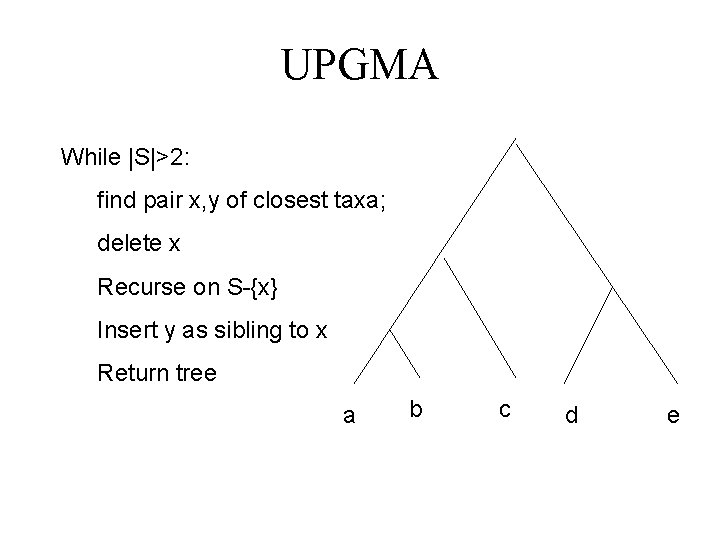
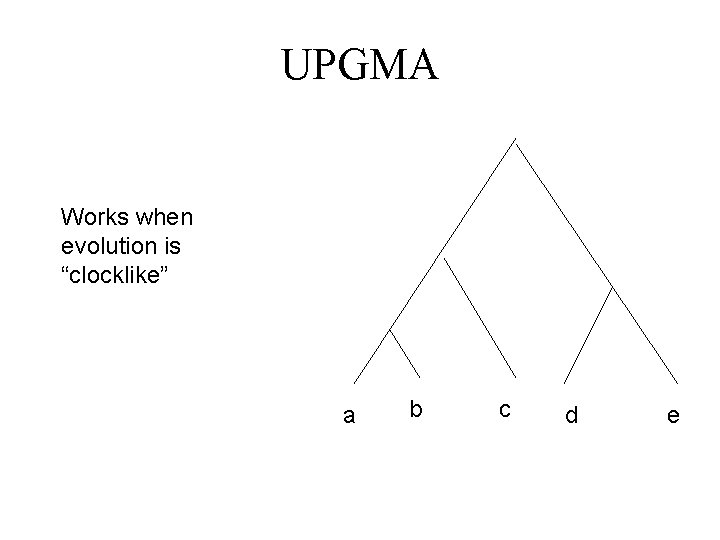
UPGMA While |S|>2: find pair x, y of closest taxa; delete x Recurse on S-{x} Insert y as sibling to x Return tree a b c d e
UPGMA Works when evolution is “clocklike” a b c d e
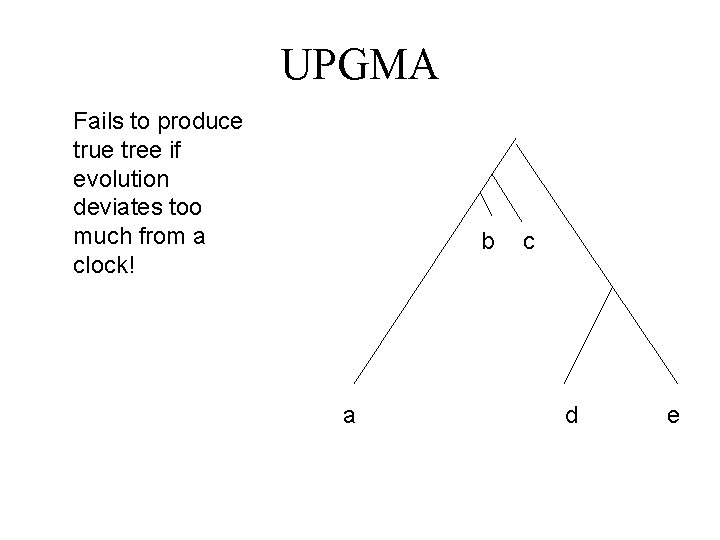
UPGMA Fails to produce true tree if evolution deviates too much from a clock! b a c d e
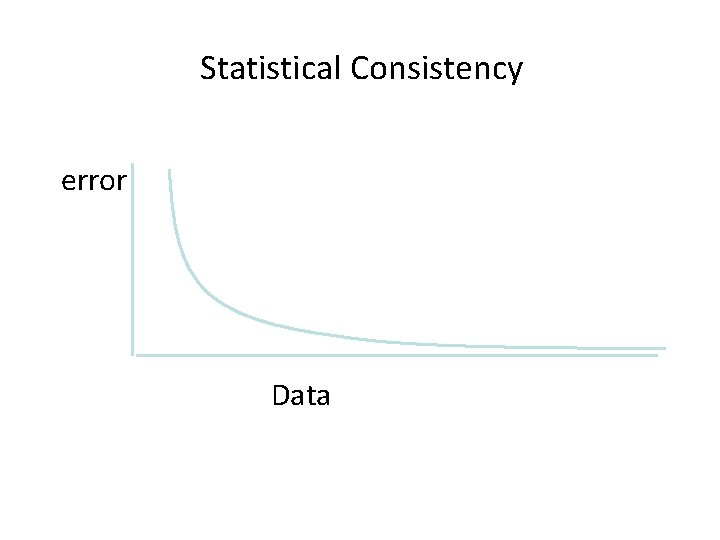
Statistical Consistency error Data
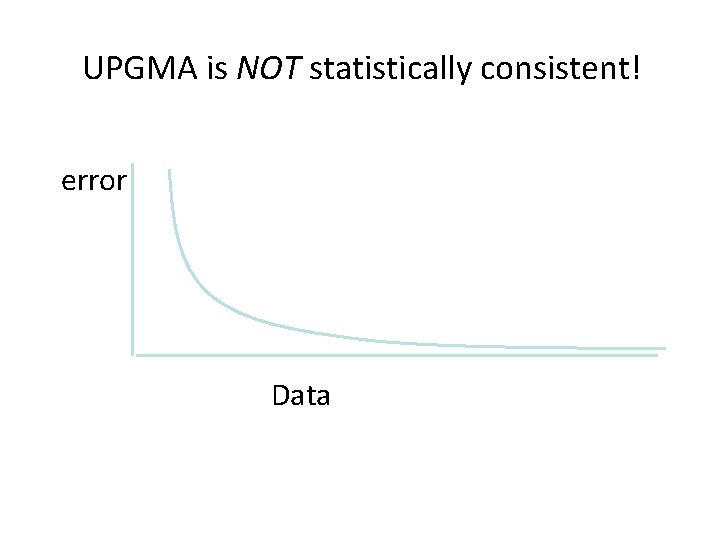
UPGMA is NOT statistically consistent! error Data
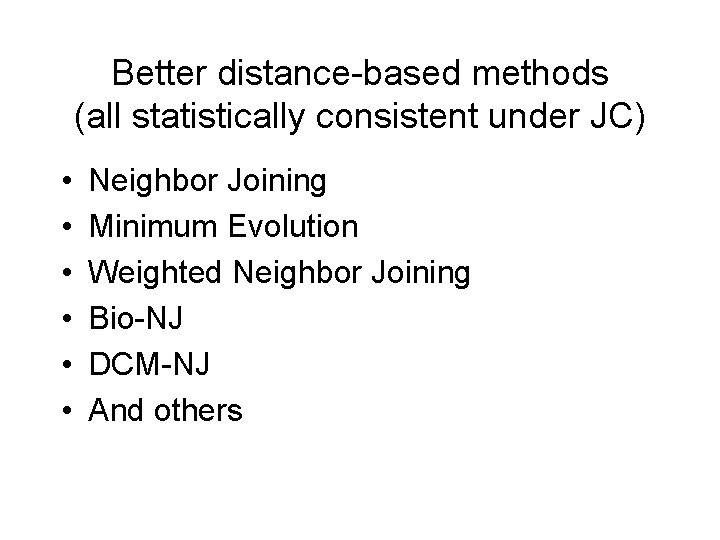
Better distance-based methods (all statistically consistent under JC) • • • Neighbor Joining Minimum Evolution Weighted Neighbor Joining Bio-NJ DCM-NJ And others
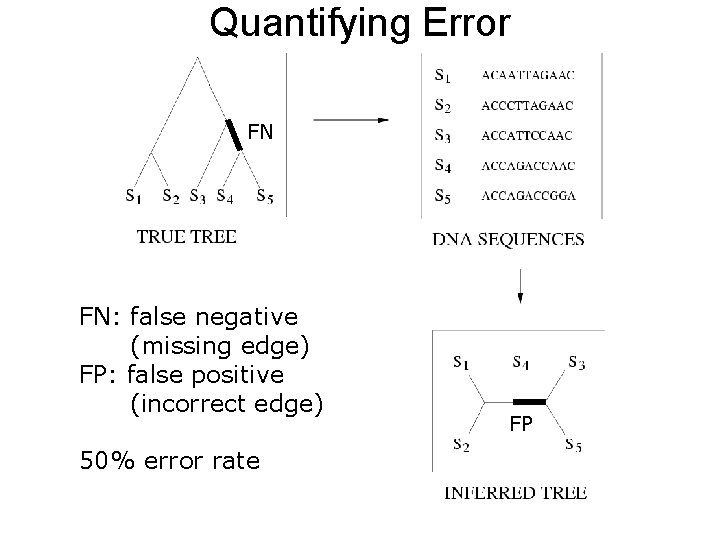
Quantifying Error FN FN: false negative (missing edge) FP: false positive (incorrect edge) 50% error rate FP
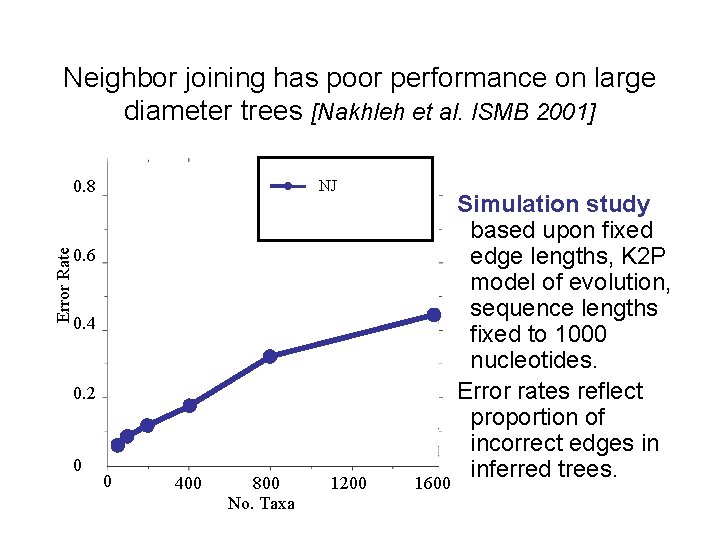
Neighbor joining has poor performance on large diameter trees [Nakhleh et al. ISMB 2001] Error Rate 0. 8 NJ 0. 6 0. 4 0. 2 0 0 400 800 No. Taxa 1200 Simulation study based upon fixed edge lengths, K 2 P model of evolution, sequence lengths fixed to 1000 nucleotides. Error rates reflect proportion of incorrect edges in inferred trees. 1600
Summary so far • Distance-based methods are generally polynomial time, and can be statistically consistent under standard sequence evolution models. • Yet they can have high error under high rates of sequence evolution. What are the options?
Characters • A character is a partition of the set of taxa, defined by the states of the character • Morphological examples: presence/absence of wings, presence/absence of hair, number of legs • Molecular examples: nucleotide or residue (AA) at a particular site within an alignment
Maximum Parsimony • Computational issues • Statistical consistency issues • Software and methods to find good solutions • Comparison to distance-based methods on simulated data
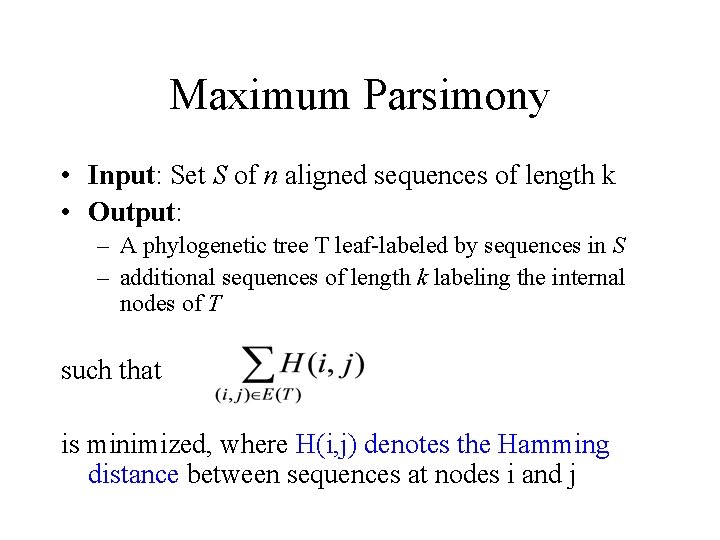
Maximum Parsimony • Input: Set S of n aligned sequences of length k • Output: – A phylogenetic tree T leaf-labeled by sequences in S – additional sequences of length k labeling the internal nodes of T such that is minimized, where H(i, j) denotes the Hamming distance between sequences at nodes i and j
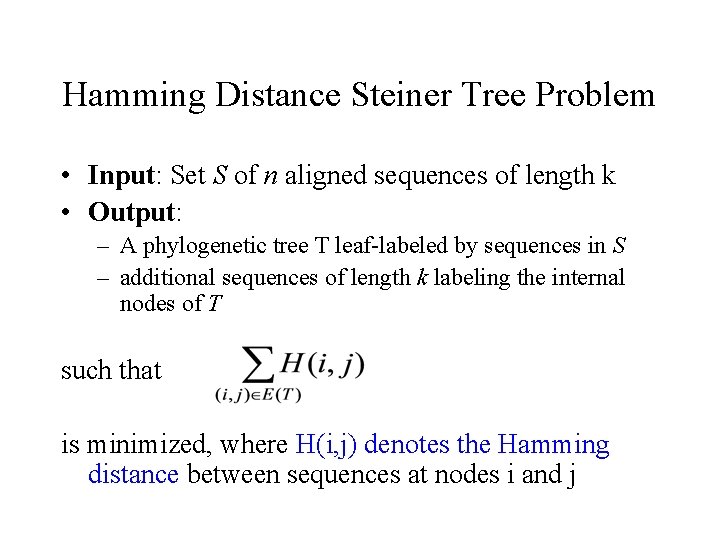
Hamming Distance Steiner Tree Problem • Input: Set S of n aligned sequences of length k • Output: – A phylogenetic tree T leaf-labeled by sequences in S – additional sequences of length k labeling the internal nodes of T such that is minimized, where H(i, j) denotes the Hamming distance between sequences at nodes i and j
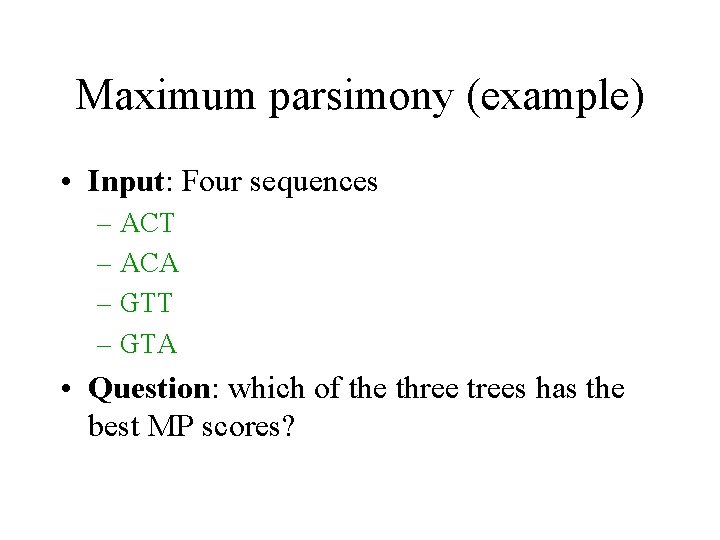
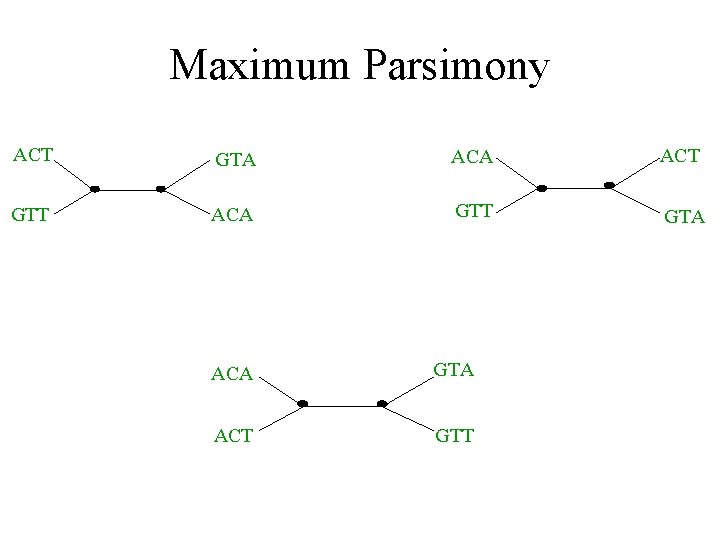
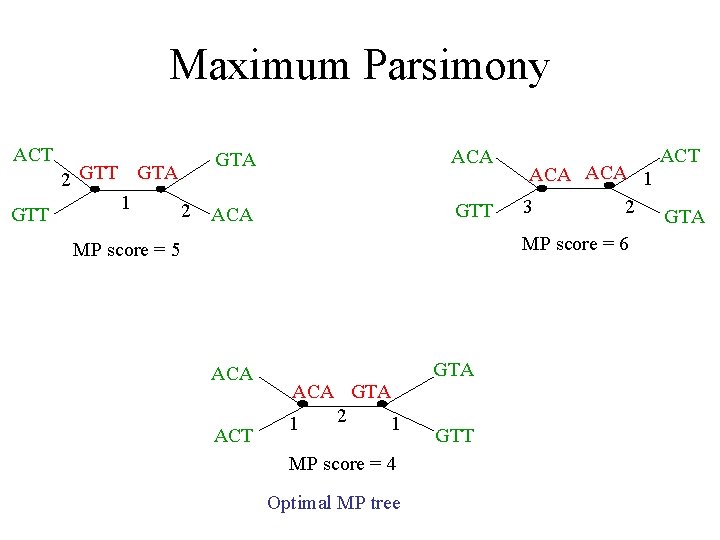
Maximum parsimony (example) • Input: Four sequences – ACT – ACA – GTT – GTA • Question: which of the three trees has the best MP scores?
Maximum Parsimony ACT GTA ACT GTT ACA GTT GTA ACA GTA ACT GTT
Maximum Parsimony ACT GTT 2 GTT GTA 1 2 GTA ACA GTT ACA 1 3 2 MP score = 6 MP score = 5 ACA ACT GTA ACA GTA 2 1 1 MP score = 4 Optimal MP tree GTT ACT GTA
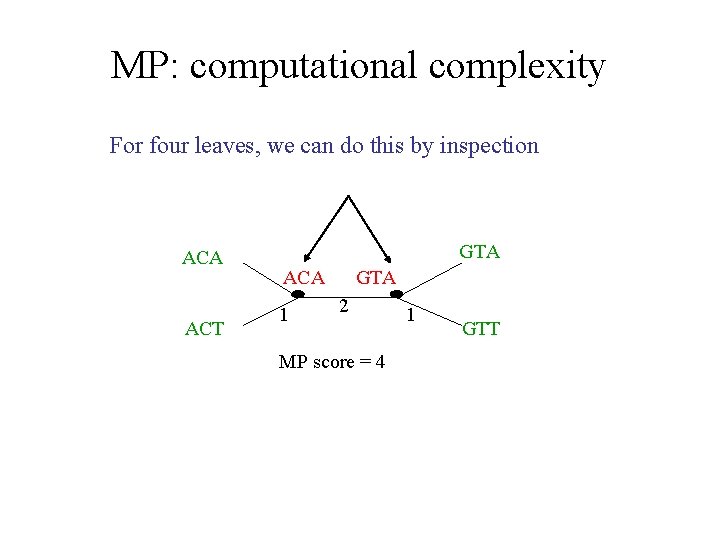
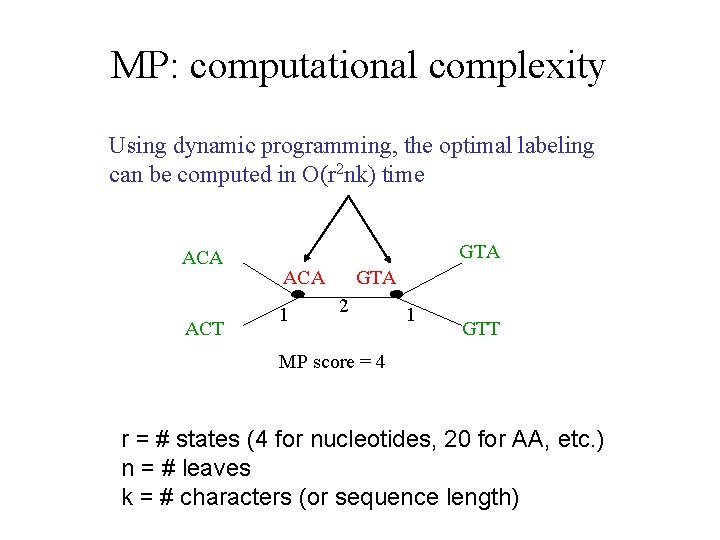
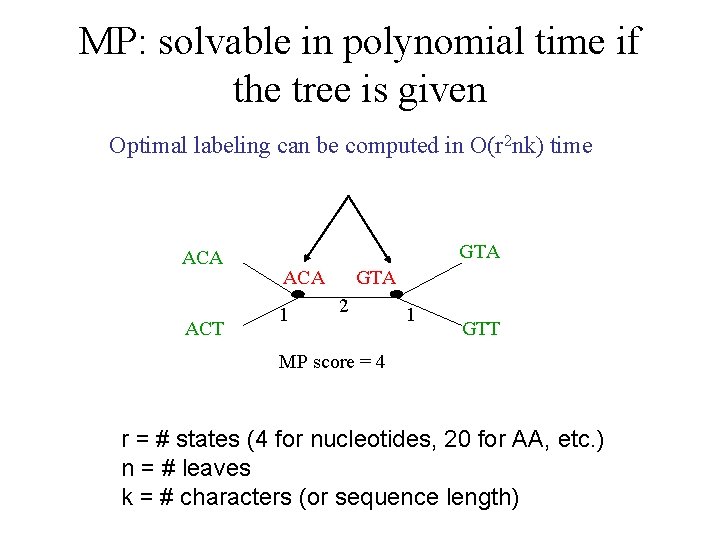
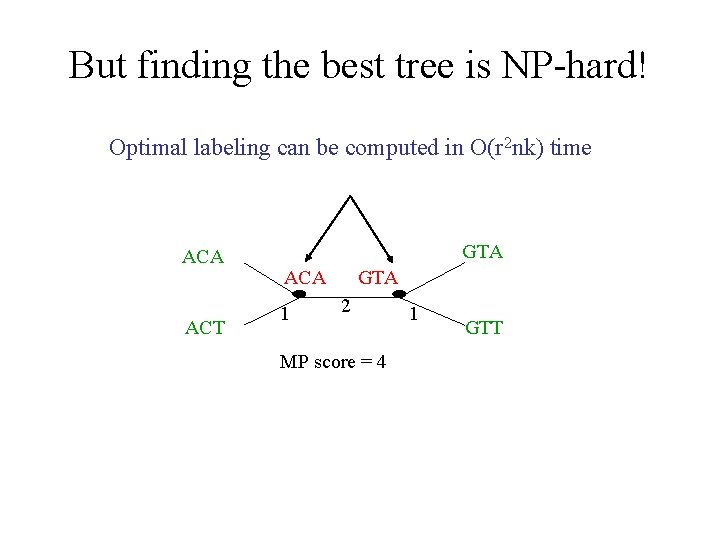
MP: computational complexity For four leaves, we can do this by inspection ACA ACT GTA ACA 1 GTA 2 MP score = 4 1 GTT
MP: computational complexity Using dynamic programming, the optimal labeling can be computed in O(r 2 nk) time ACA ACT GTA ACA 1 GTA 2 1 GTT MP score = 4 r = # states (4 for nucleotides, 20 for AA, etc. ) n = # leaves k = # characters (or sequence length)
DP algorithm • Dynamic programming algorithms on trees are common – there is a natural ordering on the nodes given by the tree. • Example: computing the longest leaf-toleaf path in a tree can be done in linear time, using dynamic programming (bottom-up).
Two variants of MP • Unweighted MP: all substitutions have the same cost • Weighted MP: there is a substitution cost matrix that allows different substitutions to have different costs. For example: transversions and transitions can have different costs. Even if symmetric, this complicates the calculation – but not by much.
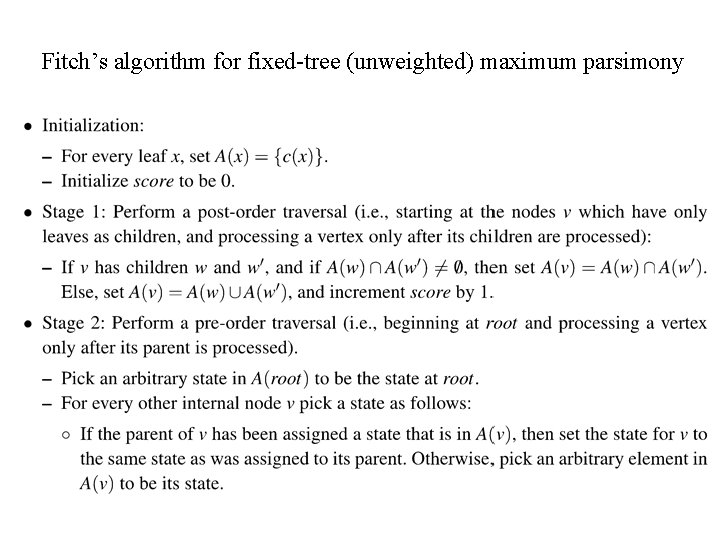
Fitch’s algorithm for unweighted MP on a fixed tree • We process the characters independently. • Let c be the character we are examining, and let c(v) be the state of leaf v. • Let A(v) denote the set of optimal nucleotides at node v (for an MP solution to the subtree rooted at v). Hence A(v)={c(v)} if v is a leaf.
Fitch’s algorithm for fixed-tree (unweighted) maximum parsimony
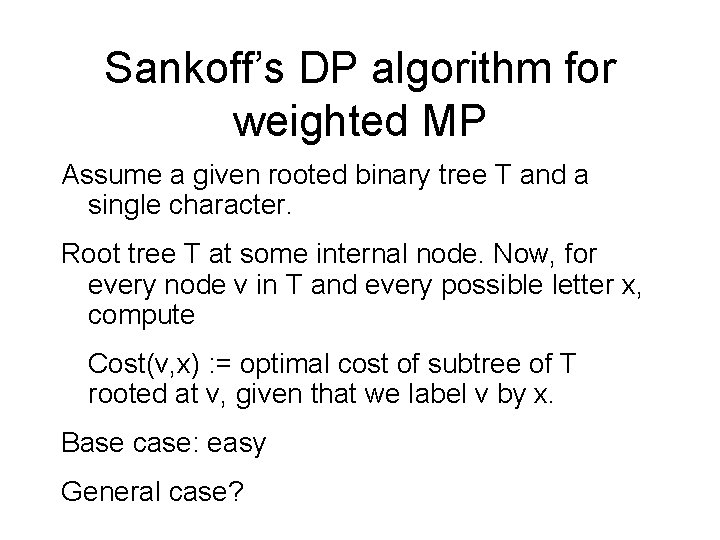
Sankoff’s DP algorithm for weighted MP Assume a given rooted binary tree T and a single character. Root tree T at some internal node. Now, for every node v in T and every possible letter x, compute Cost(v, x) : = optimal cost of subtree of T rooted at v, given that we label v by x. Base case: easy General case?
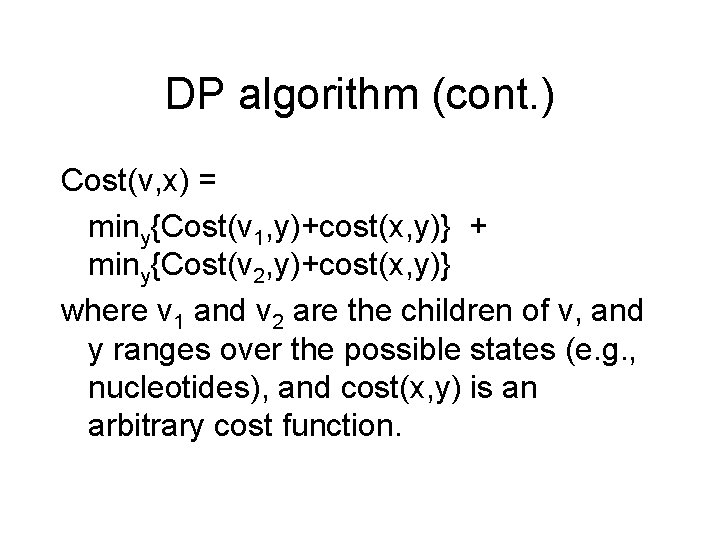
DP algorithm (cont. ) Cost(v, x) = miny{Cost(v 1, y)+cost(x, y)} + miny{Cost(v 2, y)+cost(x, y)} where v 1 and v 2 are the children of v, and y ranges over the possible states (e. g. , nucleotides), and cost(x, y) is an arbitrary cost function.
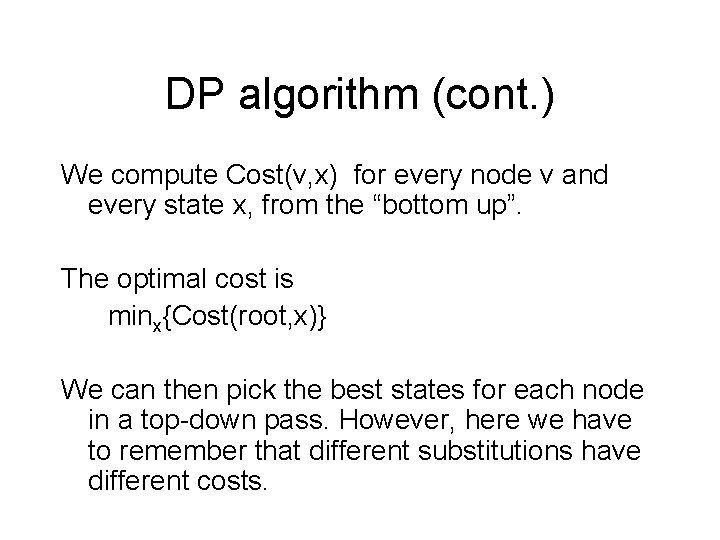
DP algorithm (cont. ) We compute Cost(v, x) for every node v and every state x, from the “bottom up”. The optimal cost is minx{Cost(root, x)} We can then pick the best states for each node in a top-down pass. However, here we have to remember that different substitutions have different costs.
MP: solvable in polynomial time if the tree is given Optimal labeling can be computed in O(r 2 nk) time ACA ACT GTA ACA 1 GTA 2 1 GTT MP score = 4 r = # states (4 for nucleotides, 20 for AA, etc. ) n = # leaves k = # characters (or sequence length)
But finding the best tree is NP-hard! Optimal labeling can be computed in O(r 2 nk) time ACA ACT GTA ACA 1 GTA 2 MP score = 4 1 GTT
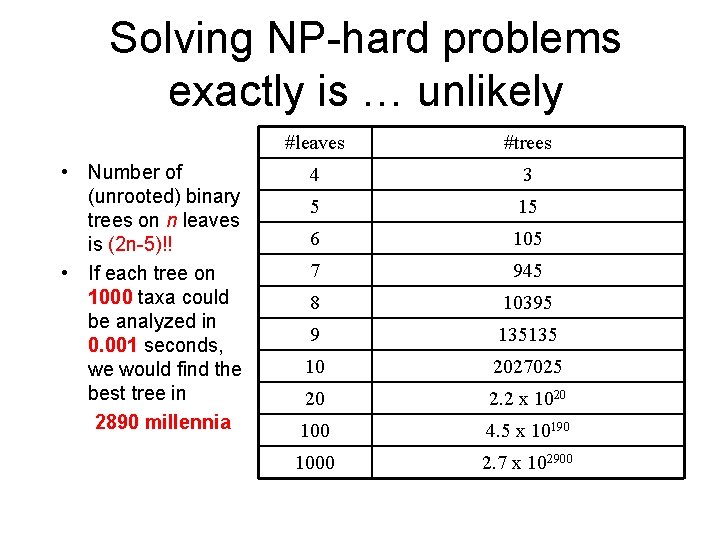
Solving NP-hard problems exactly is … unlikely • Number of (unrooted) binary trees on n leaves is (2 n-5)!! • If each tree on 1000 taxa could be analyzed in 0. 001 seconds, we would find the best tree in 2890 millennia #leaves #trees 4 3 5 15 6 105 7 945 8 10395 9 135135 10 2027025 20 2. 2 x 10²⁰ 100 4. 5 x 10190 1000 2. 7 x 102900
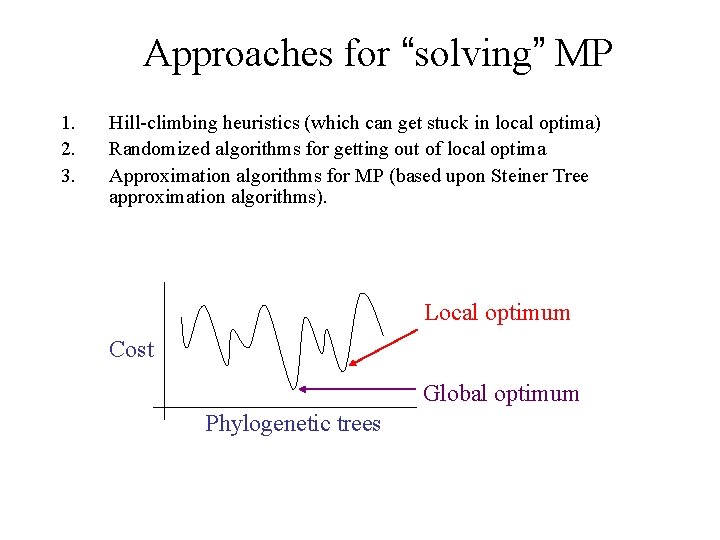
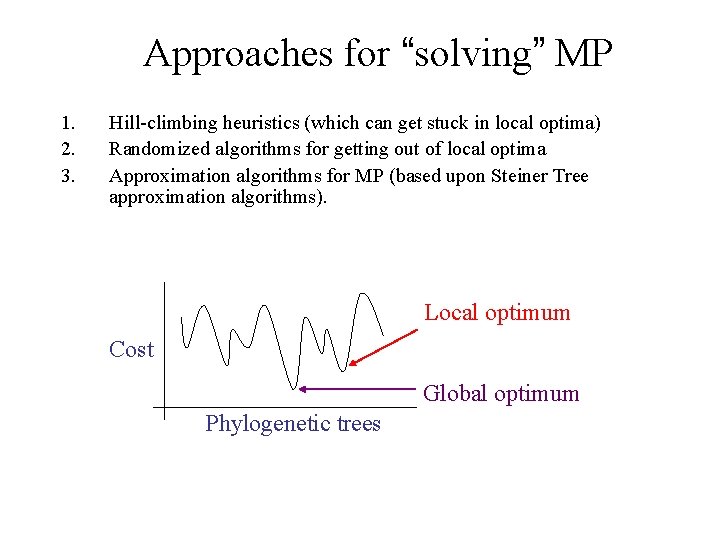
Approaches for “solving” MP 1. 2. 3. Hill-climbing heuristics (which can get stuck in local optima) Randomized algorithms for getting out of local optima Approximation algorithms for MP (based upon Steiner Tree approximation algorithms). Local optimum Cost Global optimum Phylogenetic trees
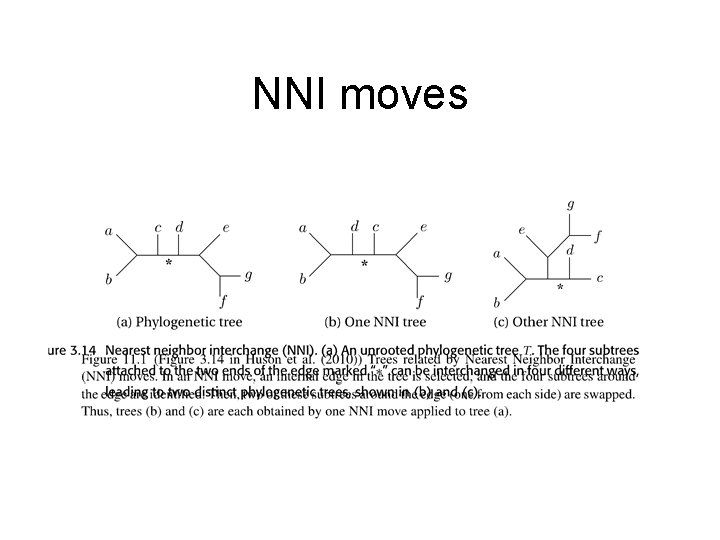
NNI moves
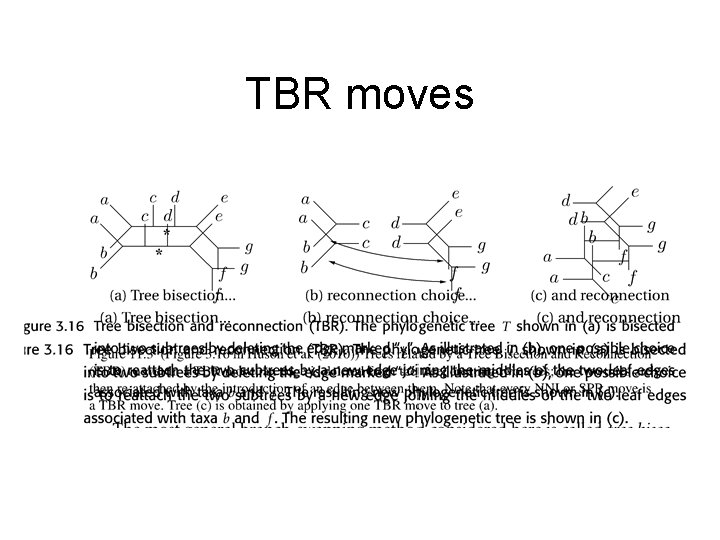
TBR moves
Approaches for “solving” MP 1. 2. 3. Hill-climbing heuristics (which can get stuck in local optima) Randomized algorithms for getting out of local optima Approximation algorithms for MP (based upon Steiner Tree approximation algorithms). Local optimum Cost Global optimum Phylogenetic trees
Good parsimony codes • TNT (not easy to use but is very effective) • PAUP* (much easier to use, not quite as effective on large datasets)
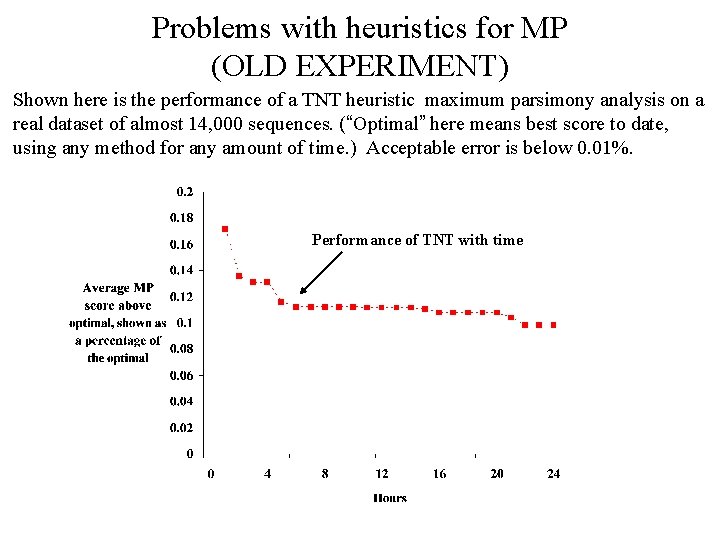
Problems with heuristics for MP (OLD EXPERIMENT) Shown here is the performance of a TNT heuristic maximum parsimony analysis on a real dataset of almost 14, 000 sequences. (“Optimal” here means best score to date, using any method for any amount of time. ) Acceptable error is below 0. 01%. Performance of TNT with time
Summary (so far) • Maximum Parsimony is an NP-hard optimization problem, but can be solved exactly (using dynamic programming) in polynomial time on a fixed tree. • Heuristics for MP are reasonably fast, but apparent convergence can be misleading. And some datasets can take a long time.
Is Maximum Parsimony statistically consistent under CFN? • Recall the CFN model of binary sequence evolution: iid site evolution, and each site changes with probability p(e) on edge e, with 0 < p(e) < 0. 5. • Is MP statistically consistent under this model?
Statistical Consistency error Data
Statistical consistency under CFN • We will say that a method M is statistically consistent under the CFN model if: – For all CFN model trees (T, Θ) (where Θ denotes the set of substitution probabilities on each of the branches of the tree T), as the number L of sites goes to infinity, the probability that M(S)=T converges to 1, where S is a set of sequences of length L.
Is MP statistically consistent? • We will start with 4 -leaf CFN trees, so the input to MP is a set of four sequences, A, B, C, D. • Note that there are only three possible unrooted trees that MP can return: – ((A, B), (C, D)) – ((A, C), (B, D)) – ((A, D), (B, C))
Analyzing what MP does on four leaves • MP has to pick the tree that has the least number of changes among the three possible trees. • Consider a single site (i. e. , all the sequences have length one). • Suppose the site is A=B=C=D=0. Can we distinguish between the three trees?
Analyzing what MP does on four leaves • • Suppose the site is A=B=C=D=0. Suppose the site is A=B=C=D=1 Suppose the site is A=B=C=0, D=1 Suppose the site is A=B=C=1, D=0 Suppose the site is A=B=D=0, C=1 Suppose the site is A=C=D=0, B=1 Suppose the site is B=C=D=0, A=1
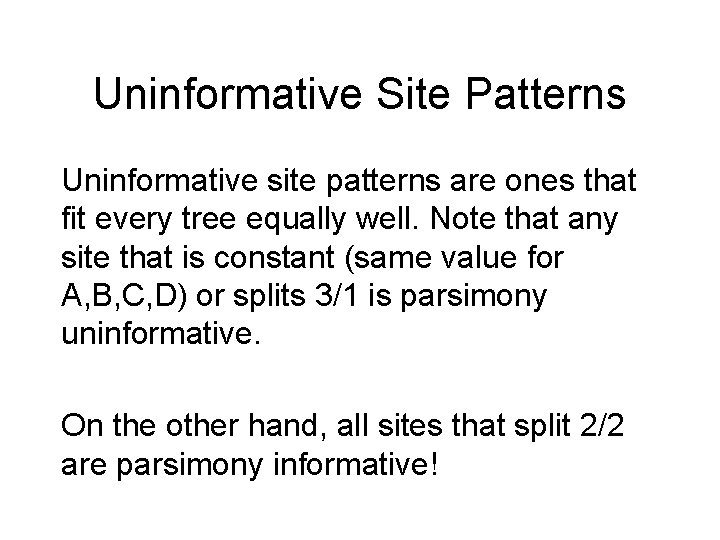
Uninformative Site Patterns Uninformative site patterns are ones that fit every tree equally well. Note that any site that is constant (same value for A, B, C, D) or splits 3/1 is parsimony uninformative. On the other hand, all sites that split 2/2 are parsimony informative!
Parsimony Informative Sites • [A=B=0, C=D=1] or [A=B=1, C=D=0] – These sites support ((A, B), (C, D)) • [A=C=1, B=D=0] or [A=C=0, B=D=1] – These sites support ((A, C), (B, D)) • [A=D=0, B=C=1] or [A=D=1, B=C=0] – These sites support ((A, D), (B, C))
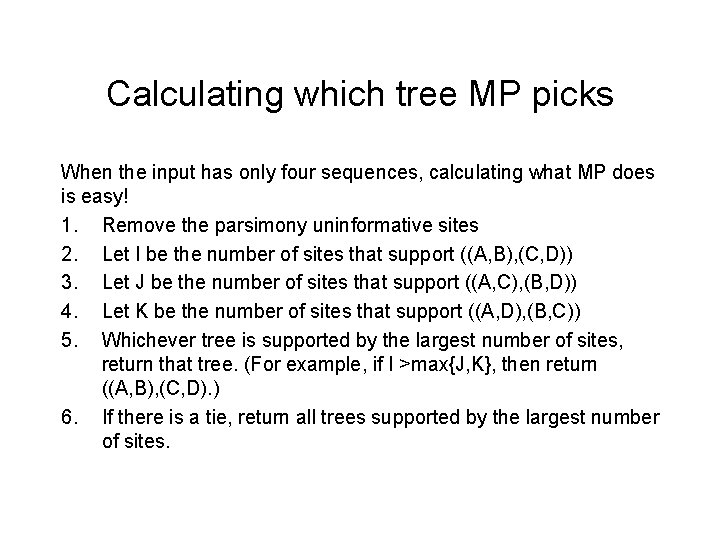
Calculating which tree MP picks When the input has only four sequences, calculating what MP does is easy! 1. Remove the parsimony uninformative sites 2. Let I be the number of sites that support ((A, B), (C, D)) 3. Let J be the number of sites that support ((A, C), (B, D)) 4. Let K be the number of sites that support ((A, D), (B, C)) 5. Whichever tree is supported by the largest number of sites, return that tree. (For example, if I >max{J, K}, then return ((A, B), (C, D). ) 6. If there is a tie, return all trees supported by the largest number of sites.
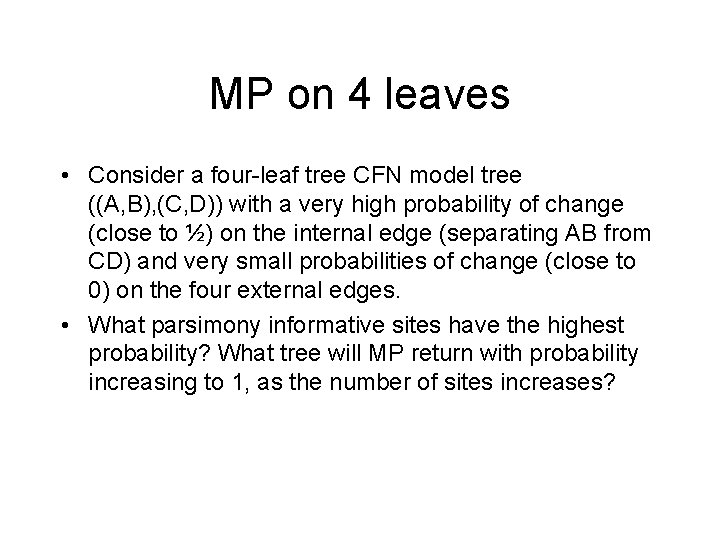
MP on 4 leaves • Consider a four-leaf tree CFN model tree ((A, B), (C, D)) with a very high probability of change (close to ½) on the internal edge (separating AB from CD) and very small probabilities of change (close to 0) on the four external edges. • What parsimony informative sites have the highest probability? What tree will MP return with probability increasing to 1, as the number of sites increases?
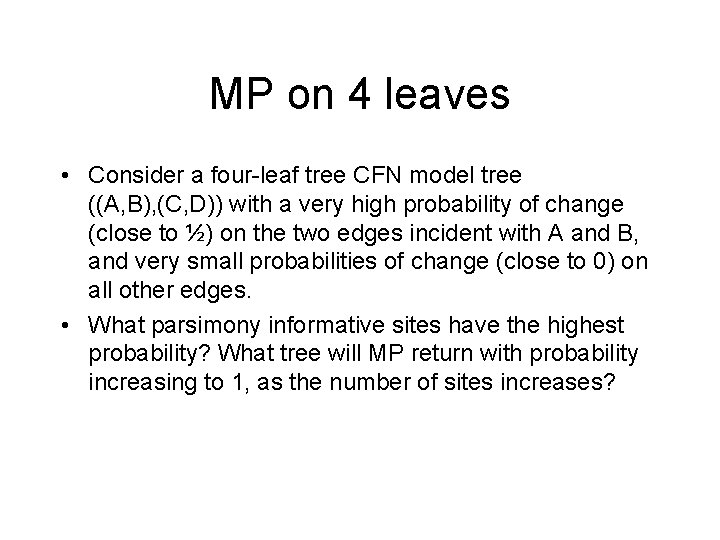
MP on 4 leaves • Consider a four-leaf tree CFN model tree ((A, B), (C, D)) with a very high probability of change (close to ½) on the two edges incident with A and B, and very small probabilities of change (close to 0) on all other edges. • What parsimony informative sites have the highest probability? What tree will MP return with probability increasing to 1, as the number of sites increases?
MP on 4 leaves • Consider a four-leaf tree CFN model tree ((A, B), (C, D)) with a very high probability of change (close to ½) on the two edges incident with A and C, and very small probabilities of change (close to 0) on all other edges. • What parsimony informative sites have the highest probability? What tree will MP return with probability increasing to 1, as the number of sites increases?
Summary (updated) • Maximum Parsimony (MP) is statistically consistent on some CFN model trees. • However, there are some other CFN model trees in which MP is not statistically consistent. Worse, MP is positively misleading on some CFN model trees. This phenomenon is called “long branch attraction”, and the trees for which MP is not consistent are referred to as “Felsenstein Zone trees” (after the paper by Felsenstein). • The problem is not limited to 4 -leaf trees…
Performance on data • Statistical consistency or inconsistency is an asymptotic statement, and requires a proof; it really has nothing much to say about performance on finite data. • To evaluate performance on finite data, we use simulations.
Quantifying Error FN FN: false negative (missing edge) FP: false positive (incorrect edge) 50% error rate FP
Performance in practice From Nakhleh et al. , PSB 2002
Summary so far • Maximum Parsimony is not statistically consistent under standard sequence evolution models, but it can be consistent on some model trees. • Maximum parsimony is NP-hard and computationally intensive in practice. • In contrast, distance-based methods can be statistically consistent and polynomial time. • Yet MP is sometimes more accurate than the leading distancebased methods such as neighbor joining. • MP remains one of the popular techniques for phylogeny estimation. What are the options?
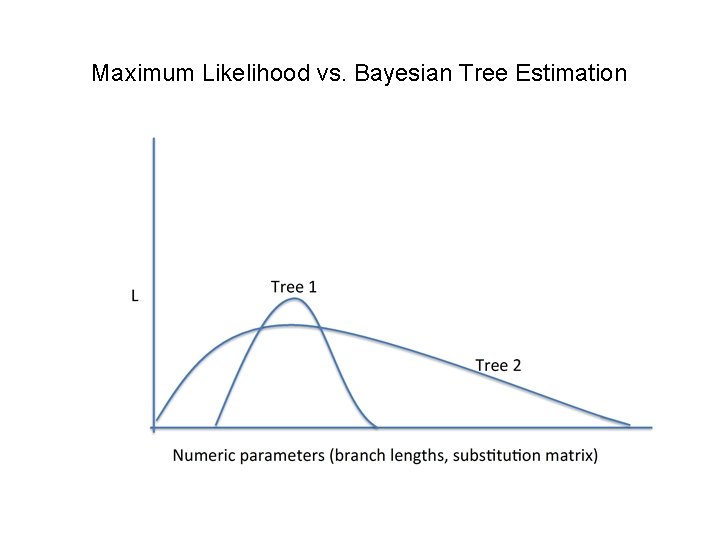
Statistical Methods • Maximum Likelihood: find model tree most likely to have generated the observed data • Bayesian Estimation: output distribution of tree topologies in proportion to their likelihood for having generated the observed data (marginalizing over all the possible numeric parameters) R (General Time Reversible) model
Maximum Likelihood • Input: sequence data S, • Output: the model tree (tree T and parameters theta) s. t. Pr(S|T, theta) is maximized. NP-hard to find best tree. Important in practice. Good heuristics (RAx. ML, Fast. Tree, IQTree, Phy. ML, and others)
Computing the probability of the data • Given a model tree (with all the parameters set) and character data at the leaves, you can compute the probability of the data. • Small trees can be done by hand. • Large examples are computationally intensive - but still polynomial time (using dynamic programming, similar to Sankoff’s algorithm for MP on a fixed tree).
Cavender-Farris model calculations • Consider an unrooted tree with topology ((a, b), (c, d)) with p(e)=0. 1 for all edges. • What is the probability of all leaves having state 0? We show the brute-force technique.
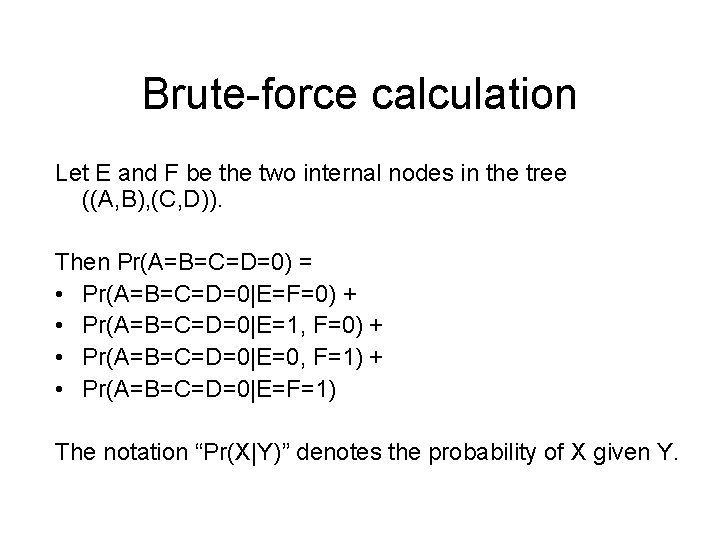
Brute-force calculation Let E and F be the two internal nodes in the tree ((A, B), (C, D)). Then Pr(A=B=C=D=0) = • Pr(A=B=C=D=0|E=F=0) + • Pr(A=B=C=D=0|E=1, F=0) + • Pr(A=B=C=D=0|E=0, F=1) + • Pr(A=B=C=D=0|E=F=1) The notation “Pr(X|Y)” denotes the probability of X given Y.
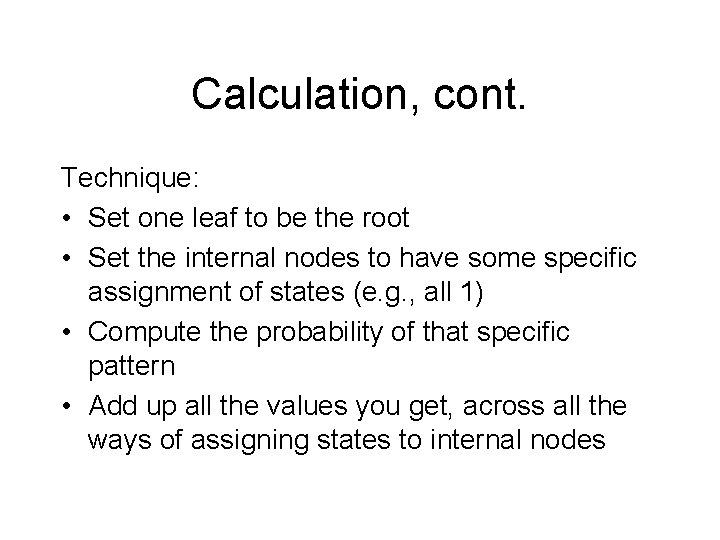
Calculation, cont. Technique: • Set one leaf to be the root • Set the internal nodes to have some specific assignment of states (e. g. , all 1) • Compute the probability of that specific pattern • Add up all the values you get, across all the ways of assigning states to internal nodes
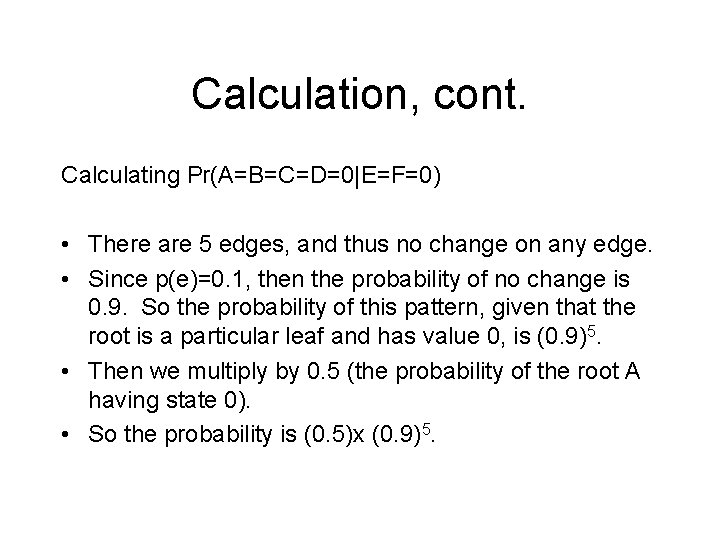
Calculation, cont. Calculating Pr(A=B=C=D=0|E=F=0) • There are 5 edges, and thus no change on any edge. • Since p(e)=0. 1, then the probability of no change is 0. 9. So the probability of this pattern, given that the root is a particular leaf and has value 0, is (0. 9)5. • Then we multiply by 0. 5 (the probability of the root A having state 0). • So the probability is (0. 5)x (0. 9)5.
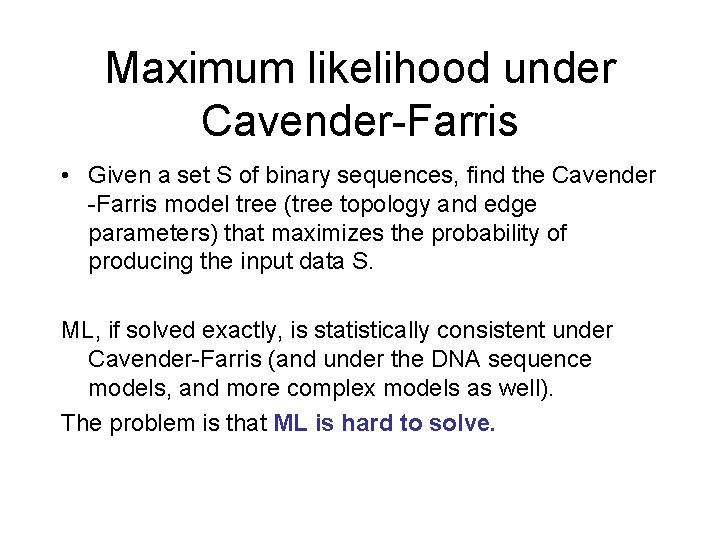
Maximum likelihood under Cavender-Farris • Given a set S of binary sequences, find the Cavender -Farris model tree (tree topology and edge parameters) that maximizes the probability of producing the input data S. ML, if solved exactly, is statistically consistent under Cavender-Farris (and under the DNA sequence models, and more complex models as well). The problem is that ML is hard to solve.
“Solving ML” • Technique 1: compute the probability of the data under each model tree, and return the best solution. • Problem: Exponentially many trees on n sequences, and infinitely many ways of setting the parameters on each of these trees!
“Solving ML” • Technique 2: For each of the tree topologies, find the best parameter settings. • Problem: Exponentially many trees on n sequences, and calculating the best setting of the parameters on any given tree is hard! Even so, there are hill-climbing heuristics for both of these calculations (finding parameter settings, and finding trees).
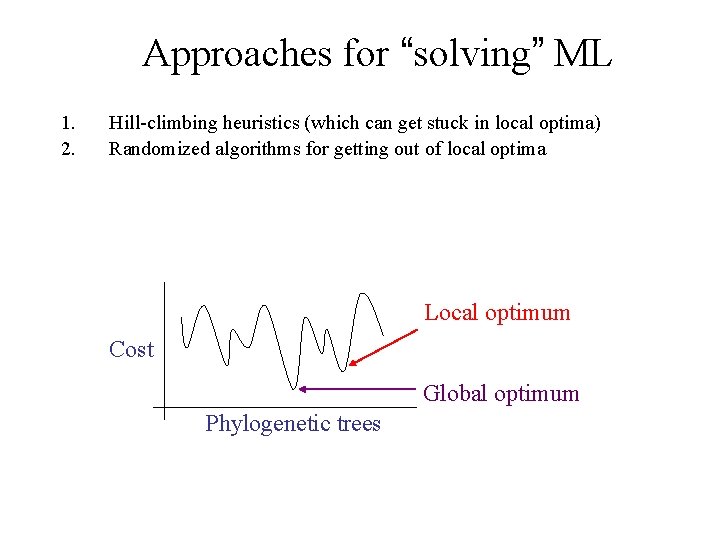
Approaches for “solving” ML 1. 2. Hill-climbing heuristics (which can get stuck in local optima) Randomized algorithms for getting out of local optima Local optimum Cost Global optimum Phylogenetic trees
Bayesian analyses • Algorithm is a random walk through space of all possible model trees (trees with substitution matrices on edges, etc. ). • From your current model tree, you perturb the tree topology and numerical parameters to obtain a new model tree. • Compute the probability of the data (character states at the leaves) for the new model tree. – If the probability increases, accept the new model tree. – If the probability is lower, then accept with some probability (that depends upon the algorithm design and the new probability). • Run for a long time…
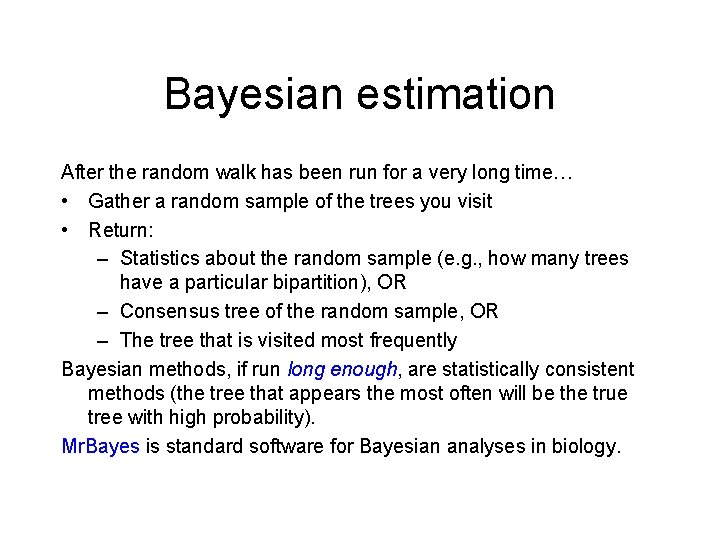
Bayesian estimation After the random walk has been run for a very long time… • Gather a random sample of the trees you visit • Return: – Statistics about the random sample (e. g. , how many trees have a particular bipartition), OR – Consensus tree of the random sample, OR – The tree that is visited most frequently Bayesian methods, if run long enough, are statistically consistent methods (the tree that appears the most often will be the true tree with high probability). Mr. Bayes is standard software for Bayesian analyses in biology.
Maximum Likelihood vs. Bayesian Tree Estimation
Summary There are many statistically consistent methods: • Maximum Likelihood • Bayesian MCMC methods • Distance-based methods (like Neighbor Joining and the Naïve Quartet Method) But not maximum parsimony, not maximum compatibility, and not UPGMA (a distance-based method) But statistical consistency is not the only important thing – performance on data matters at least as much. Also, the model assumptions under which methods are statistically consistent are not particularly realistic!
Classical Sequence Evolution -3 mil yrs AAGACTT AAGGCCT AGGGCAT TAGCCCA -2 mil yrs TGGACTT TAGACTT AGCACAA AGCGCTT -1 mil yrs today
Standard DNA site evolution models Figure 3. 9 from Huson et al. , 2010
DNA sequence evolution models • The models in this figure are the standard ones: – Every edge has a substitution probability – The model also allows 4 x 4 substitution matrices on the edges: • Simplest model: Jukes-Cantor (JC) assumes that all substitutions are equiprobable • General Time Reversible (GTR) Model: one 4 x 4 substitution matrix for all edges • Not in this figure: – General Markov (GM) model: different 4 x 4 matrices allowed on each edge – No Common Mechanism model: different substitution probabilities for each combination of edge and site • All of these models assume substitution-only evolution
DNA sequence evolution models • The models in this figure are the standard ones: – Every edge has a substitution probability – The model also allows 4 x 4 substitution matrices on the edges: • Simplest model: Jukes-Cantor (JC) assumes that all substitutions are equiprobable • General Time Reversible (GTR) Model: one 4 x 4 substitution matrix for all edges • Not in this figure: – General Markov (GM) model: different 4 x 4 matrices allowed on each edge – No Common Mechanism model: different substitution probabilities for each combination of edge and site • All of these models assume substitution-only evolution
DNA sequence evolution models • The models in this figure are the standard ones: – Every edge has a substitution probability – The model also allows 4 x 4 substitution matrices on the edges: • Simplest model: Jukes-Cantor (JC) assumes that all substitutions are equiprobable • General Time Reversible (GTR) Model: one 4 x 4 substitution matrix for all edges • Not in this figure: – General Markov (GM) model: different 4 x 4 matrices allowed on each edge – No Common Mechanism model: different substitution probabilities for each combination of edge and site • All of these models assume substitution-only evolution
The Classical Phylogeny Problem U AGGGCAT V W TAGCCCA X TAGACTT Y TGCACAA X U Y V W TGCGCTT
Much is known about this problem from a mathematical and empirical viewpoint U AGGGCAT V W TAGCCCA X TAGACTT Y TGCACAA X U Y V W TGCGCTT
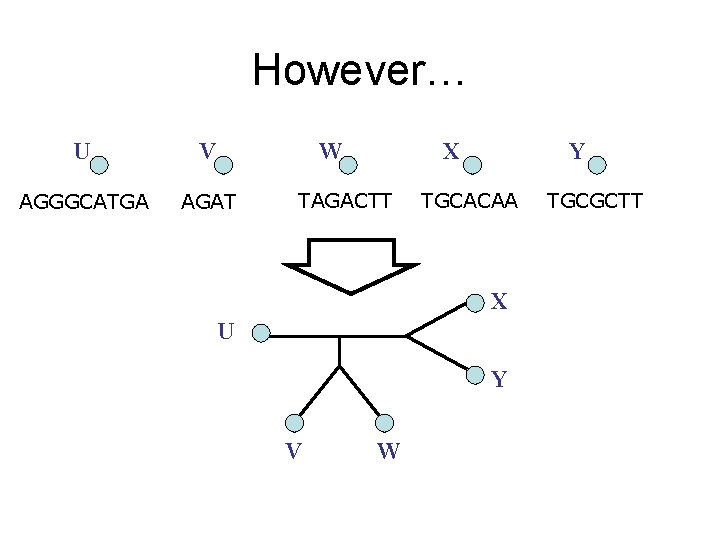
However… U V W AGGGCATGA AGAT X TAGACTT Y TGCACAA X U Y V W TGCGCTT