Statistical Quality Control N Obeidi Descriptive Statistics Descriptive


Statistical Quality Control N. Obeidi

Descriptive Statistics • Descriptive Statistics include: – The Mean- measure of central tendency – The Range- difference between largest/smallest observations in a set of data – Standard Deviation measures the amount of data dispersion around mean – Distribution of Data shape • Normal or bell shaped or • Skewed

Statistics – ‘Mode’ l Mode = most frequently occurring value Find the mode of 4, 6, 7, 9, 4 The most popular, or mode is 4

Frequency Normal Distribution 4. 7’ 4. 8’ 4. 9’Mean 5. 1’ 5. 2’ 5. 3’

Normal Distribution Mean

Distribution of Data • Normal distributions • Skewed distribution

Setting Control Limits • Percentage of values under normal curve

Constructing an X-bar Chart: A quality control inspector at the Cocoa Fizz soft drink company has taken three samples with four observations each of the volume of bottles filled. If the standard deviation of the bottling operation is. 2 ounces, use the below data to develop control charts with limits of 3 standard deviations for the 16 oz. bottling operation. Time 1 Time 2 Time 3 Observation 1 15. 8 16. 1 16. 0 Observation 2 16. 0 15. 9 Observation 3 15. 8 15. 9 Observation 4 15. 9 15. 8 Sample means (X-bar) 15. 875 15. 9 0. 2 0. 3 0. 2 Sample ranges (R)
 • Center line (x-double bar):")
Solution and Control Chart (x-bar) • Center line (x-double bar):

Levey-Jennings Chart

Levey-Jennings Chart 12

Levey-Jennings Chart
")
Introduction to Statistical Quality Control, 5 th Edition by Douglas C. Montgomery. Copyright (c) 2005 John Wiley 14 Chapter 8

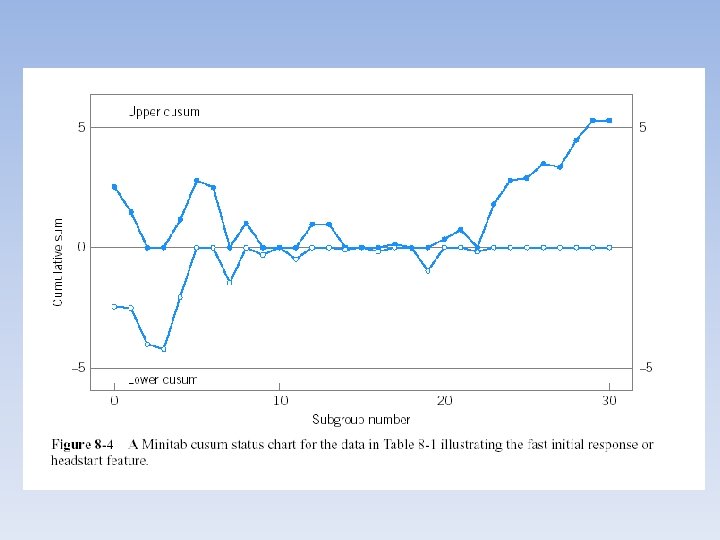
Cusum Chart

C-Chart Example: The number of weekly customer complaints are monitored in a large hotel using a c-chart. Develop three sigma control limits using the data table below. Week Number of Complaints 1 3 2 2 3 3 4 1 5 3 6 3 7 2 8 1 9 3 10 1 Total 22 Solution:

Interpreting patterns in control charts Downward trend in R-chart…

Moving Range I-chart

Levey-Jennings Chart - Record and Evaluate the Control Values +3 SD +2 SD +1 SD Mean -1 SD -2 SD -3 SD Day

Westgard Rules • “Multirule Quality Control” • Uses a combination of decision criteria or control rules • Allows determination of whether an analytical run is “in-control” or “out-ofcontrol”
")
Westgard Rules (Generally used where 2 levels of control material are analyzed per run) • 12 S • 13 S • 22 S rule • R 4 S rule • 41 S rule • 10 X rule

Westgard – 12 S Rule • “warning rule” • One of two control results falls outside ± 2 SD • Alerts tech to possible problems • Not cause for rejecting a run • Must then evaluate the 13 S rule

12 S Rule = A warning to trigger careful inspection of the control data +3 SD +2 SD +1 SD Mean 12 S rule violation -1 SD -2 SD -3 SD Day

Westgard – 13 S Rule • If either of the two control results falls outside of ± 3 SD, rule is violated • Run must be rejected • If 13 S not violated, check 22 S

13 S Rule = Reject the run when a single control measurement exceeds the +3 SD or -3 SD control limit +3 SD +2 SD +1 SD Mean -1 SD 13 S rule violation -2 SD -3 SD Day

Westgard – 22 S Rule • 2 consecutive control values for the same level fall outside of ± 2 SD in the same direction, or • Both controls in the same run exceed ± 2 SD • Patient results cannot be reported • Requires corrective action

22 S Rule = Reject the run when 2 consecutive control measurements exceed the same +2 SD or -2 SD control limit +3 SD +2 SD +1 SD Mean -1 SD 22 S rule violation -2 SD -3 SD Day

Westgard – R 4 S Rule • One control exceeds the mean by – 2 SD, and the other control exceeds the mean by +2 SD • The range between the two results will therefore exceed 4 SD • Random error has occurred, test run must be rejected

R 4 S Rule = Reject the run when 1 control measurement exceed the +2 SD and the other exceeds the -2 SD control limit +3 SD +2 SD +1 SD Mean -1 SD R 4 S rule violation -2 SD -3 SD Day

Westgard – 41 S Rule • Requires control data from previous runs • Four consecutive QC results for one level of control are outside ± 1 SD, or • Both levels of control have consecutive results that are outside ± 1 SD

Westgard – 10 X Rule • Requires control data from previous runs • Ten consecutive QC results for one level of control are on one side of the mean, or • Both levels of control have five consecutive results that are on the same side of the mean

10 x Rule = Reject the run when 10 consecutive control measurements fall on one side of the mean +3 SD +2 SD +1 SD Mean -1 SD 10 x rule violation -2 SD -3 SD Day

Westgard Multirule QC

- Slides: 35