Statistical Process Controls Standard Distribution Curve Statistical Process

Statistical Process Controls Standard Distribution Curve

Statistical Process Controls Class 2 This Photo by Unknown Author is licensed under CC BY-SA MR. ZBORIL | CINCINNATI STATE WDC This Photo by Unknown Author is licensed under CC BY-NC

Statistical Process Controls What do you think your customers would prefer?

Statistical Process Controls Standard Distribution Curve

Statistical Process Controls Standard Distribution Curve

Statistical Process Controls Class 2 Mean and Range • We need to introduce a few more terms… • The process average or mean (x ) is the result of dividing the total or sum of group (Σ) of measurements by the number of things measured. • The range (R) is the difference between the smallest and largest in a group of measurements.

Statistical Process Controls Class 2 Find the Mean and Range • Find the mean and range for the following data: x y z 5 10 15 0 10 20 9 10 11

Statistical Process Controls Class 2 Find the Mean and Range • Find the mean and range for the following data: x y z 1 2 3 9 10 11 4 5 6

Statistical Process Controls • Standard Deviation The standard deviation is a calculation that describes how closely the measurements cluster around the middle of a normal curve. The equation below is the equation to use for calculating the standard deviation.

Statistical Process Controls • Class 2 Standard Deviation The values charted on the right are grouped (or centered) closer to the average / mean. 32, 5 USL LS L 33 Bolt Length Distribution Number per Sample Bolt Length Distribution 33, 5 34 Bolt Length 34, 5 35 35, 5 32, 5 LS L 33 USL 33, 5 34 Bolt Length 34, 5 35 35, 5

Statistical Process Controls • Class 2 Standard Deviation Larger data spread on the left (thus larger R value) makes for a larger σ value. 32, 5 USL LS L 33 Bolt Length Distribution Number per Sample Bolt Length Distribution 33, 5 34 Bolt Length 34, 5 35 35, 5 32, 5 LS L 33 USL 33, 5 34 Bolt Length 34, 5 35 35, 5

Statistical Process Controls The wider 6σ spread renders the process on the left outside the customer’s tolerance. 32, 5 33 33, 5 34 Bolt Length 34, 5 35 35, 5 32, 5 LSL -3σ Number per Sample Bolt Length Distribution USL +3σ LS L -3σ Number per Sample Bolt Length Distribution +3σ USL • Class 2 Standard Deviation 33 33, 5 34 Bolt Length 34, 5 35 35, 5

Statistical Process Controls Remember – 99. 7% of the curve area rests in the 6σ spread 32, 5 33 33, 5 34 Bolt Length 34, 5 35 35, 5 32, 5 LSL -3σ Number per Sample Bolt Length Distribution USL +3σ LS L -3σ Number per Sample Bolt Length Distribution +3σ USL • Class 2 Standard Deviation 33 33, 5 34 Bolt Length 34, 5 35 35, 5

Statistical Process Controls • Standard Deviation There are other standard deviation equations that you may encounter in the workplace or in a statistics class.
 equation on the")
Statistical Process Controls • Standard Deviation Use the (s or σ) equation on the left when calculating the standard deviation for parts in a sample. This is the sample standard deviation, however we will simply refer to it as the standard deviation.

Statistical Process Controls Cp and Cpk • The next two equations (also found on page 6) are the Process Capability Potential (Cp) and the Process Capability Index (Cpk). • Both terms help determine if our process will meet the customer’s need. • The Process Capability Potential (Cp) does not consider how centered the process is. • The Process Capability Index (Cpk) does consider how centered the process is.
 - does not consider")
Statistical Process Controls • Class 1 Process Capability Potential (Cp) - does not consider how centered the process is, only how “widespread” the data falls.

Statistical Process Controls Class 1 Process Capability Potential Cp > 1: We will fit in the customer’s garage IF our process is centered at the middle of the tolerance range. Cp < 1: We will NOT fit in the customer’s garage IF our process is centered at the middle of the tolerance range.

Statistical Process Controls The wider 6σ spread renders the process on the left outside the customer’s tolerance. 32, 5 33 33, 5 34 Bolt Length 34, 5 35 35, 5 32, 5 LSL -3σ Number per Sample Bolt Length Distribution USL +3σ LS L -3σ Number per Sample Bolt Length Distribution +3σ USL • Class 2 Standard Deviation 33 33, 5 34 Bolt Length 34, 5 35 35, 5
")
Statistical Process Controls • Class 1 Process Capability Index The Process Capability Index (Cpk) considers the process centerline and the data spread when determining whether the process will produce units within the tolerance limits.

Statistical Process Controls Class 1 Process Capability Index

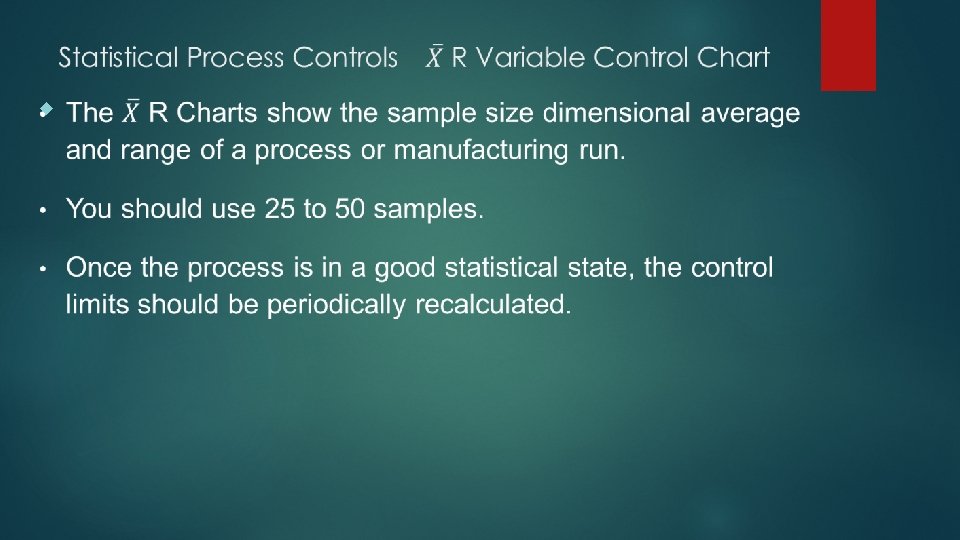
Statistical Process Controls Creating Control Charts

• Calculate the range within the sample using:

Do you know who also loved variable control forms? This Photo by Unknown Author is licensed under CC BY-SA
. • Calculate the standard deviation using the")
Step 3 Calculate the Standard Deviation (σ). • Calculate the standard deviation using the following:

Step 5 Plot your data
- Slides: 29