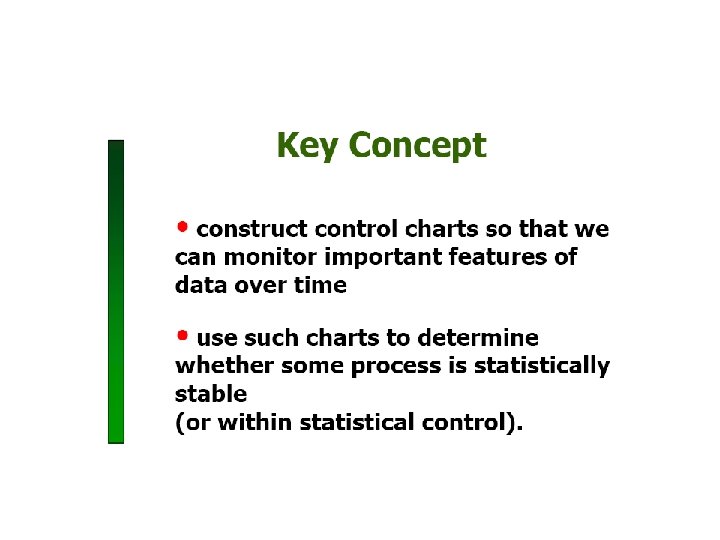
Statistical Process Control SPC Control Chart Variable and
 Control Chart Variable and Attributes PDT 310 Quality System October,")
Statistical Process Control (SPC) Control Chart Variable and Attributes PDT 310 Quality System October, 2017


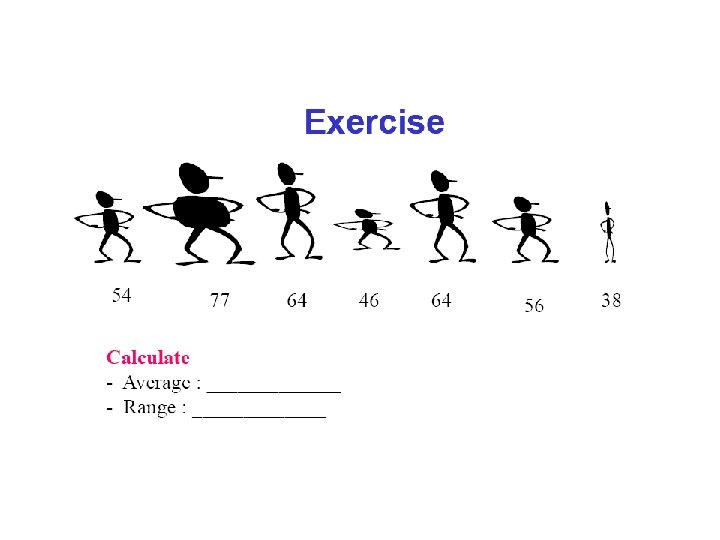
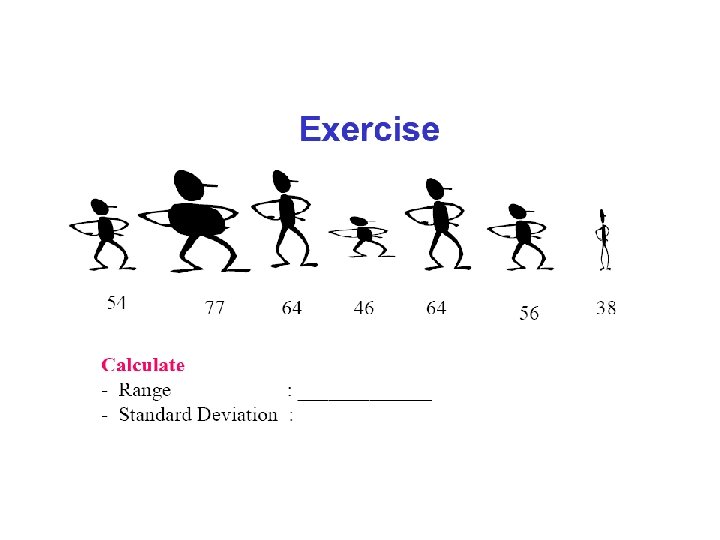
Learning Exercise
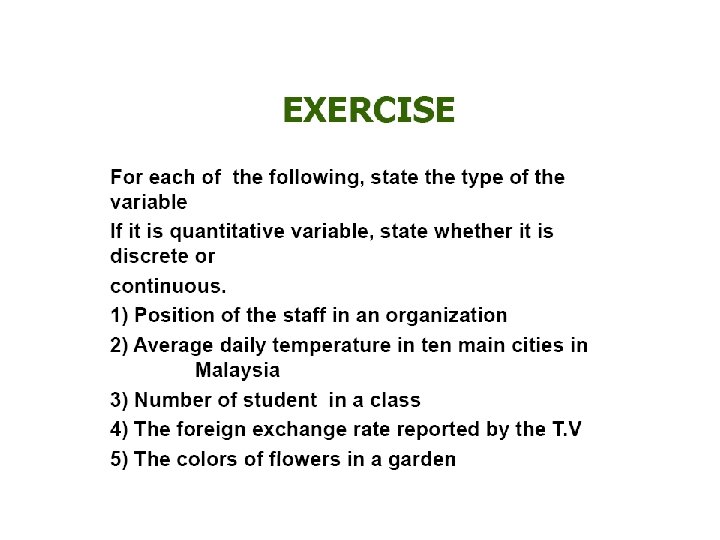

Learning Exercise

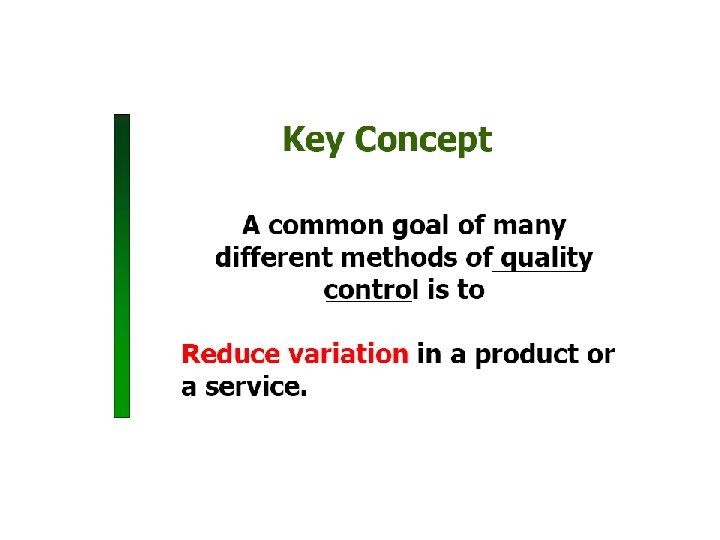
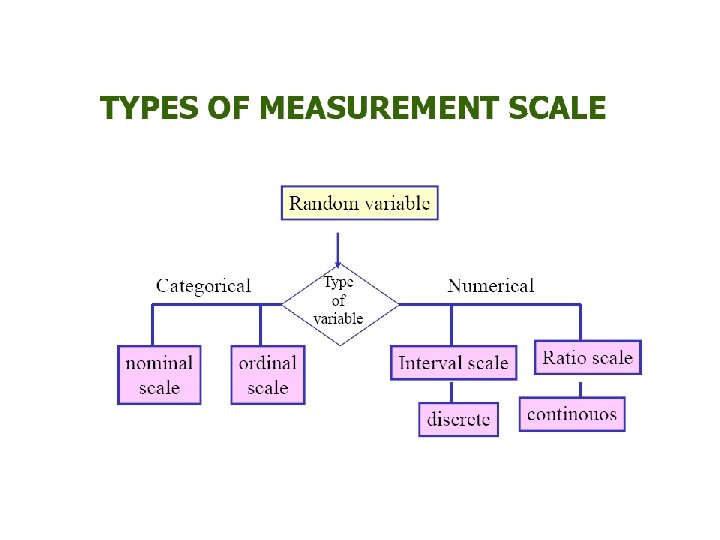
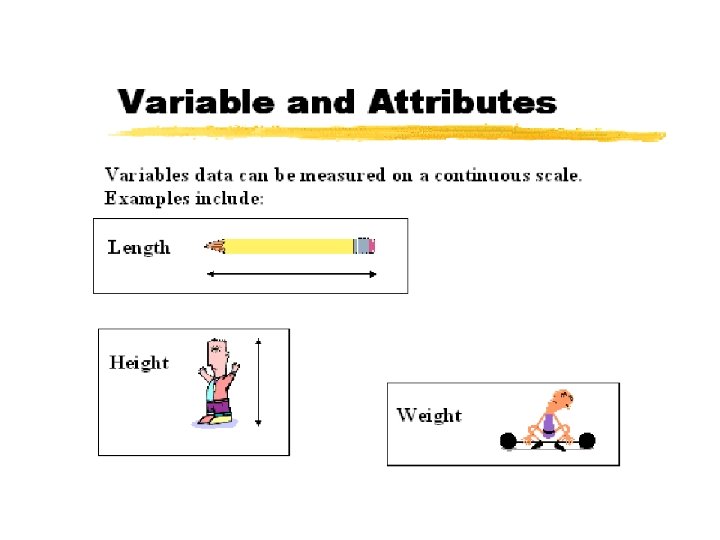
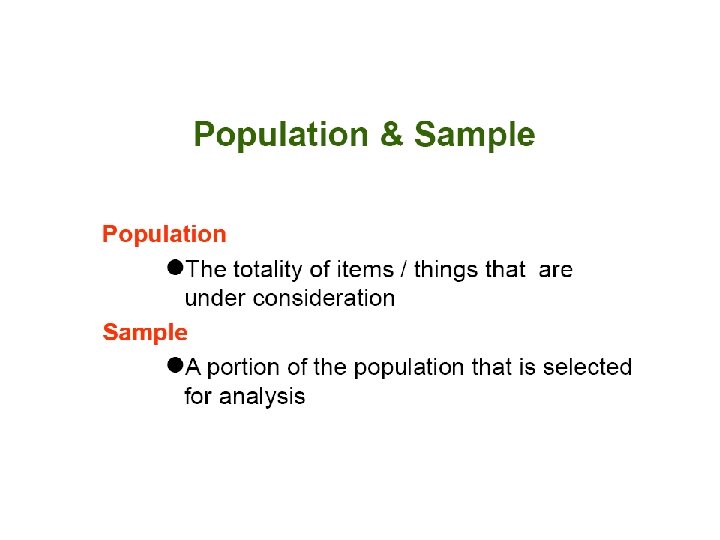
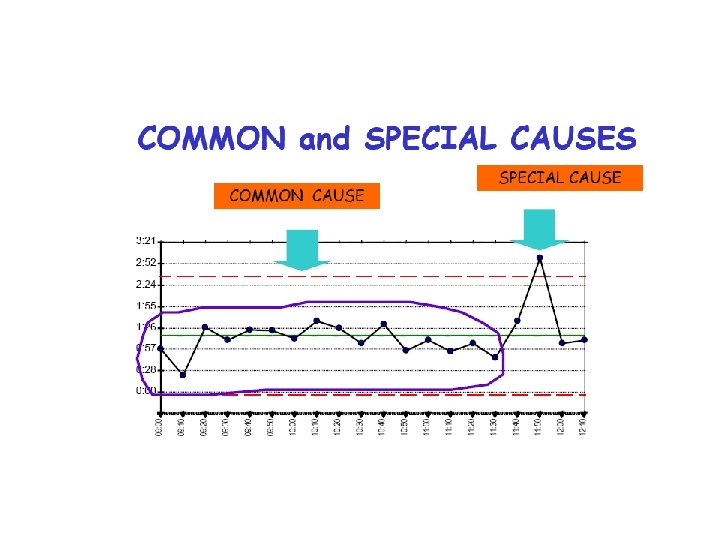
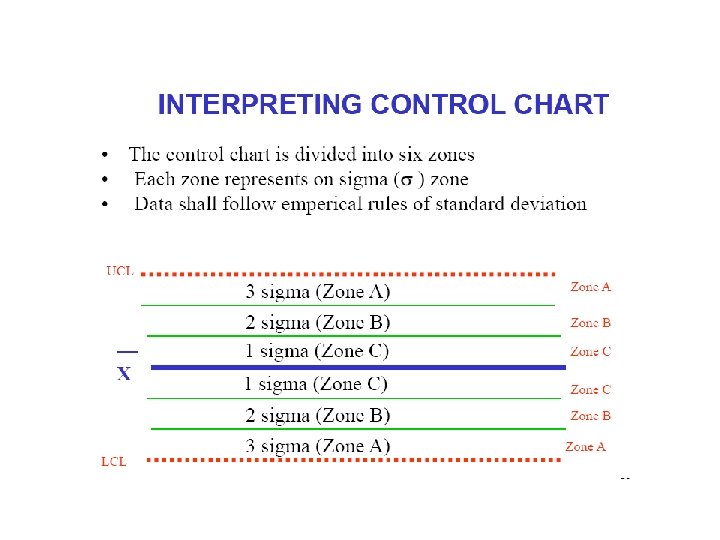
Concept of Variation
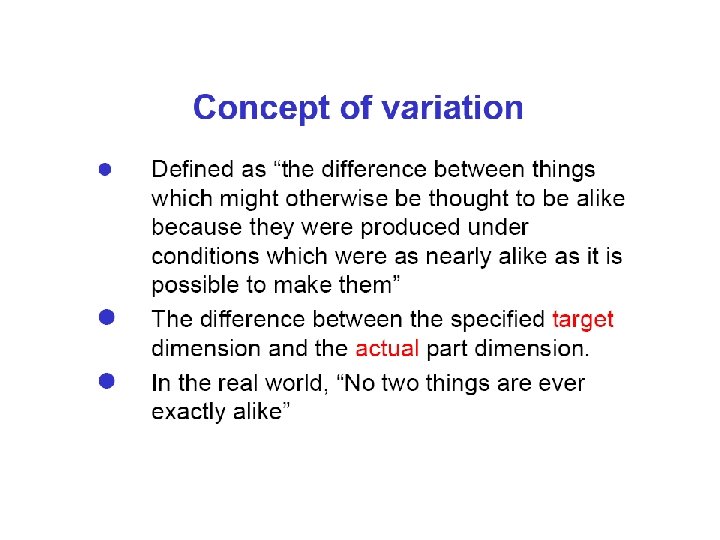

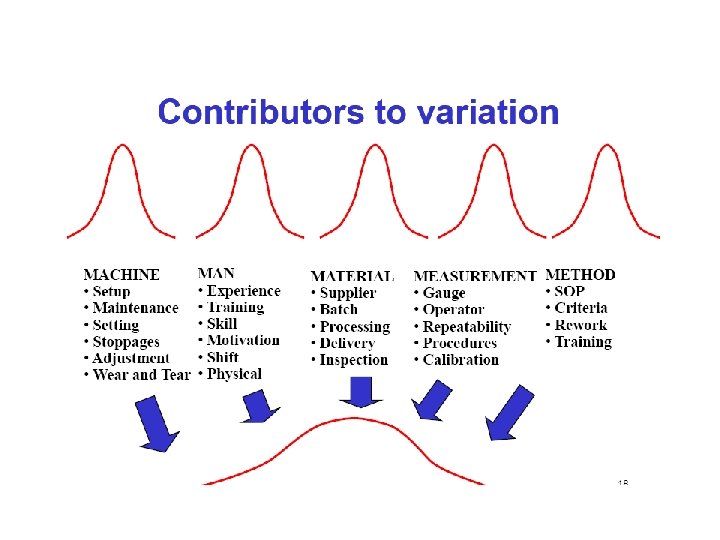
Random causes that we cannot identify Unavoidable, e. g. slight differences in process variables like diameter, weight, service time, temperature Causes can be identified and eliminated: poor employee training, worn tool, machine needing repair
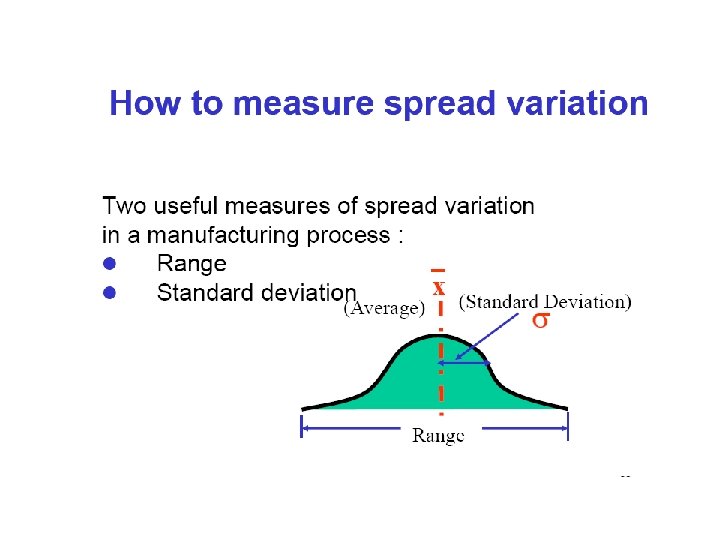

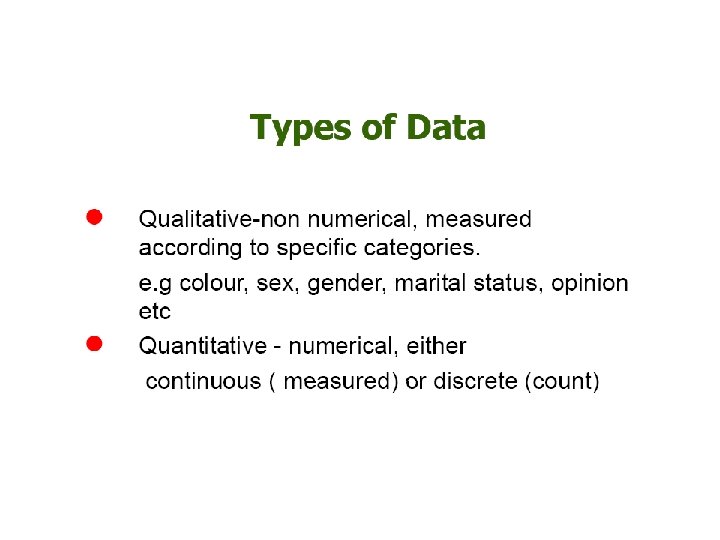
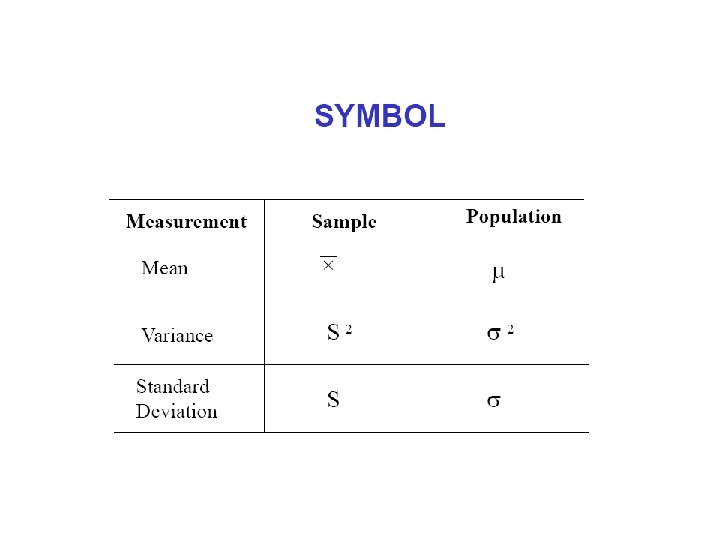
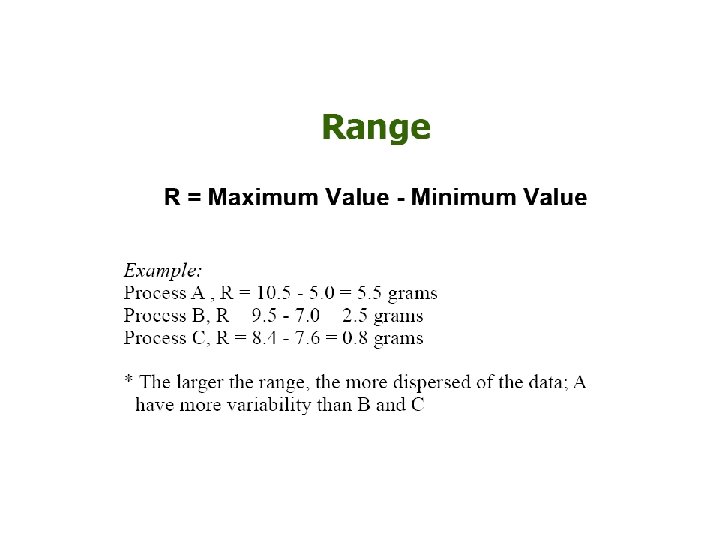
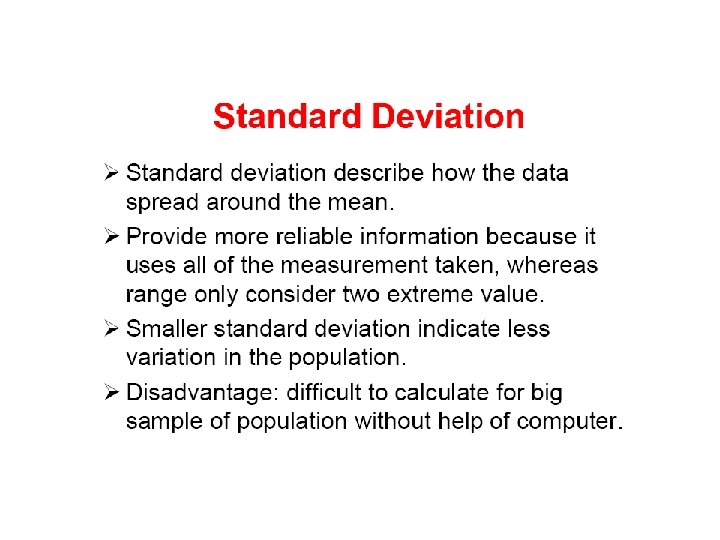
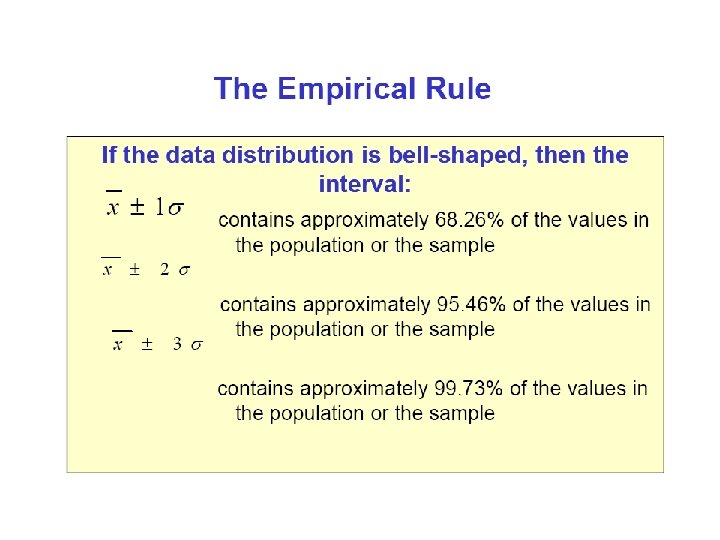
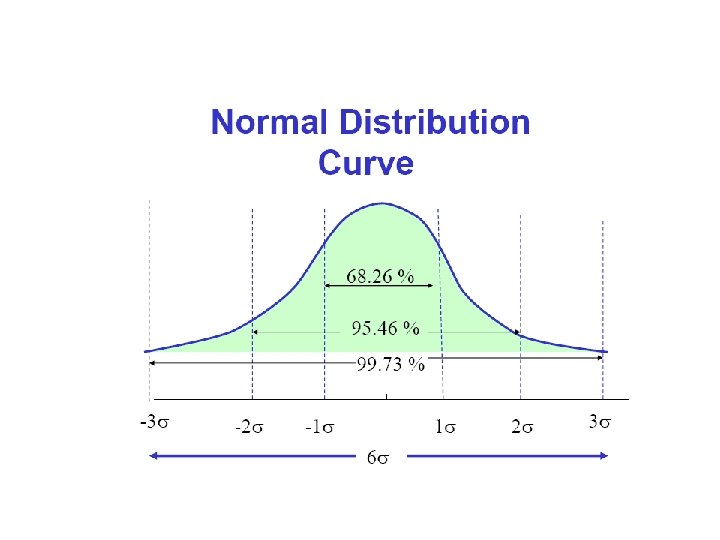
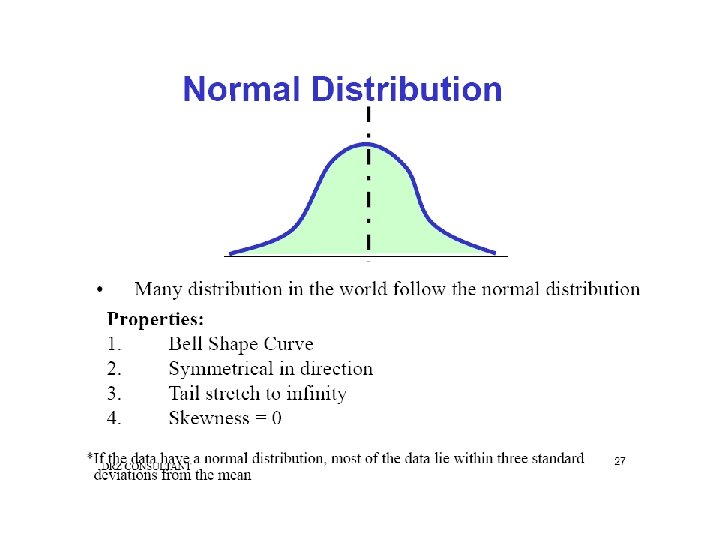
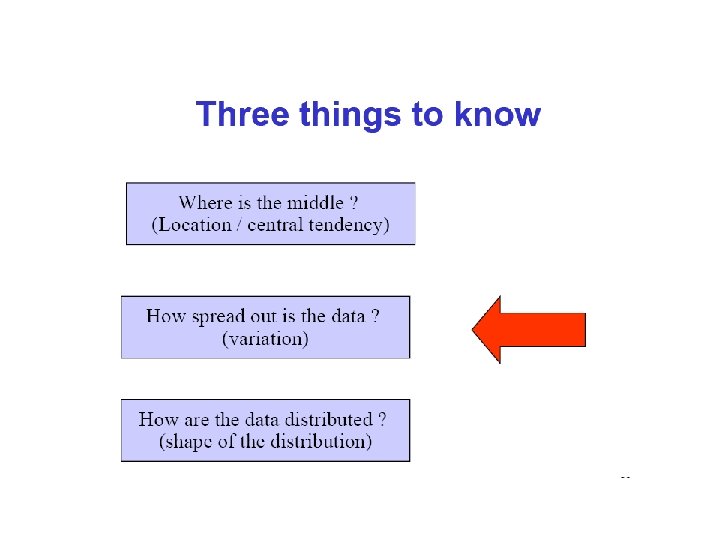
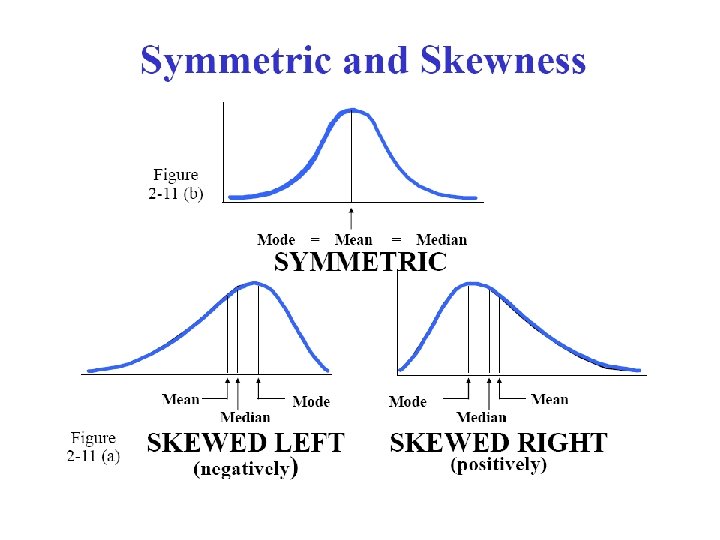
Descriptive Statistics include: The Mean- measure of central tendency The Range- difference between largest/smallest observations in a set of data Standard Deviation- measures the amount of data dispersion around mean – Measure of dispersion Distribution of Data shape § Normal or bell shaped or § Skewed
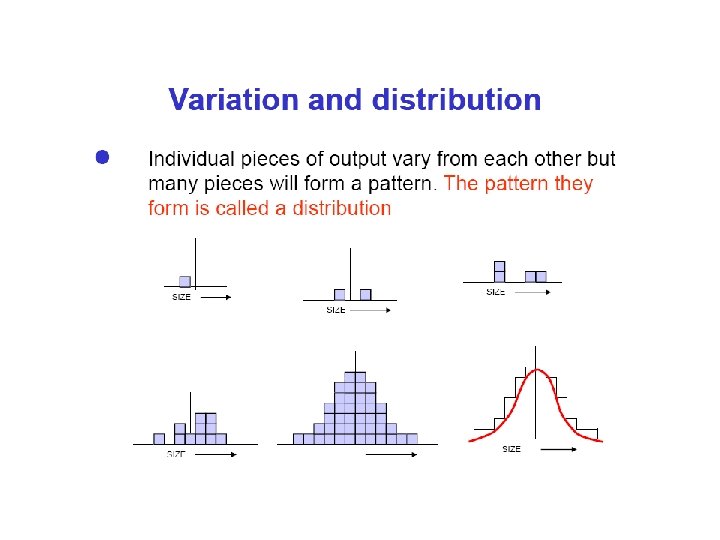

Normal distributions Skewed distribution

Learning Exercise
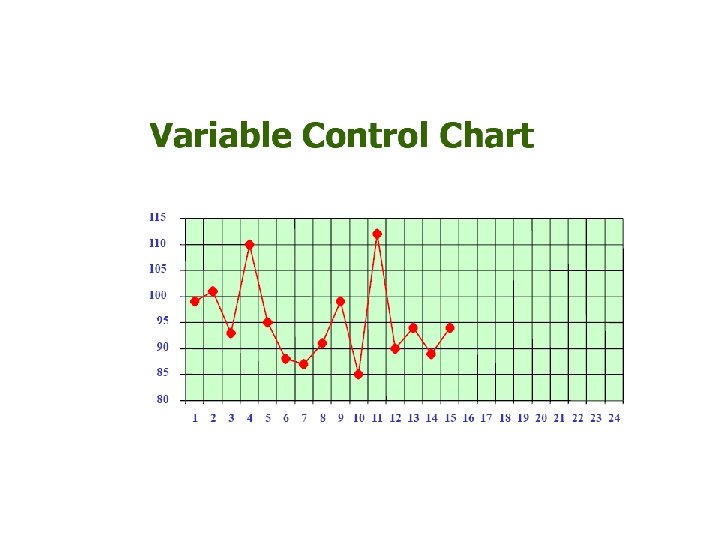

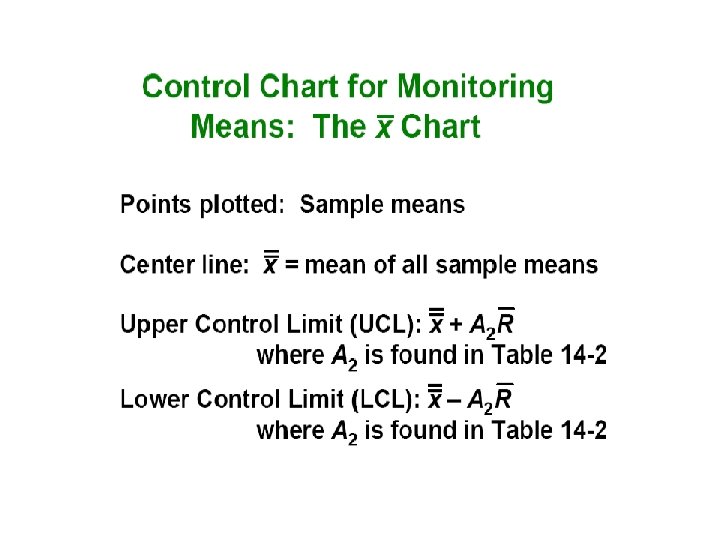
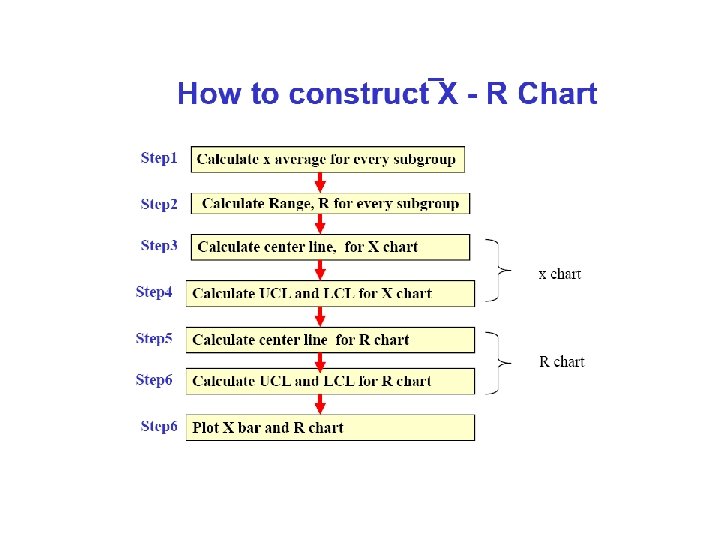
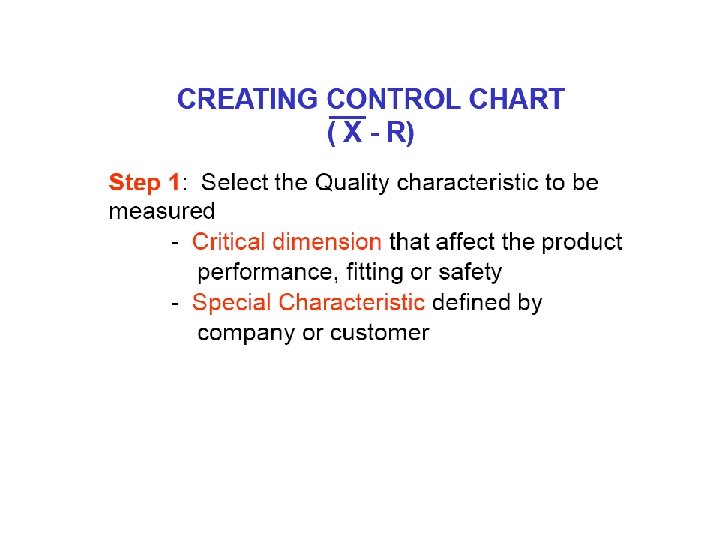
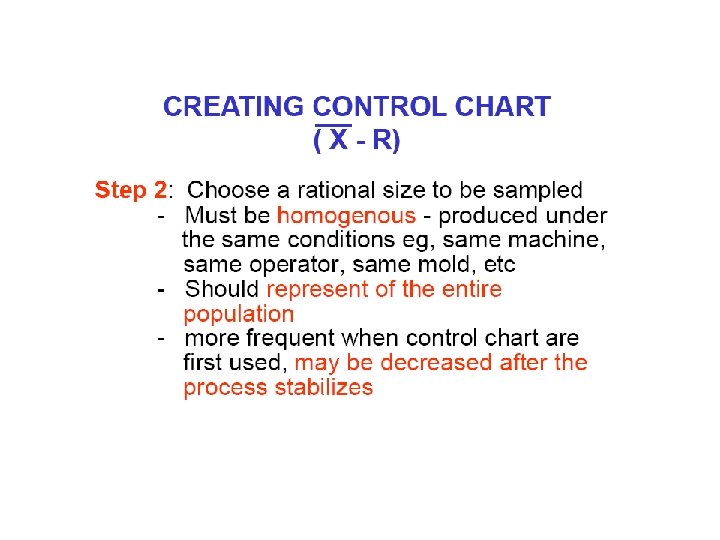
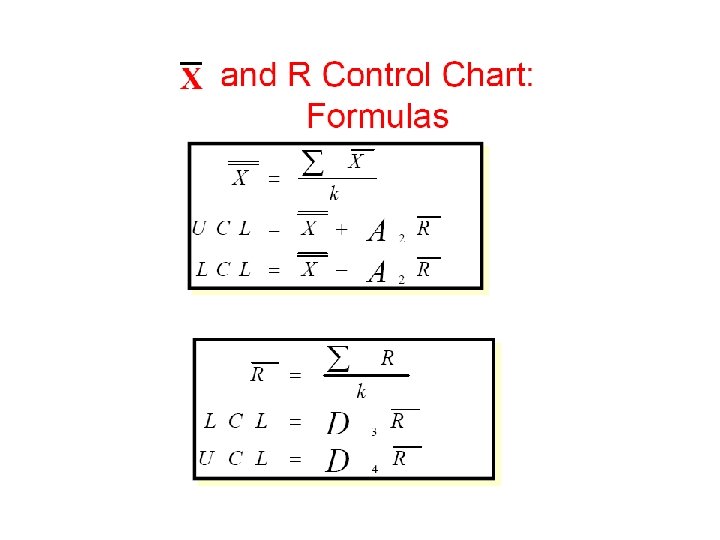
Flow Chart for Variable Control Chart

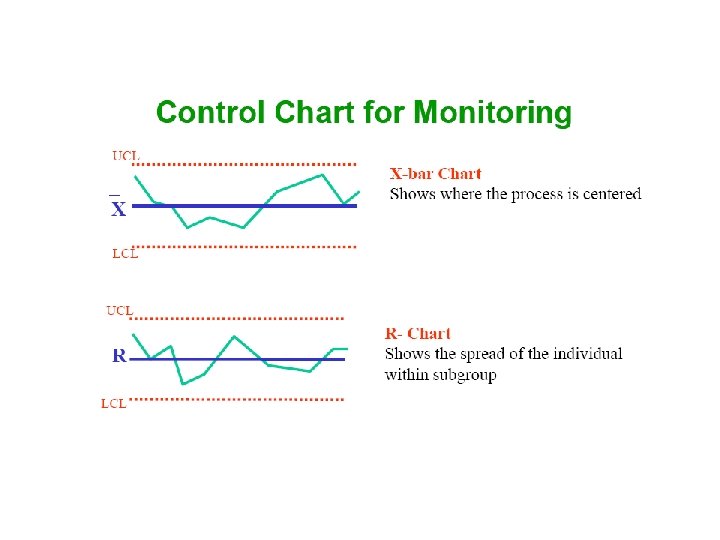
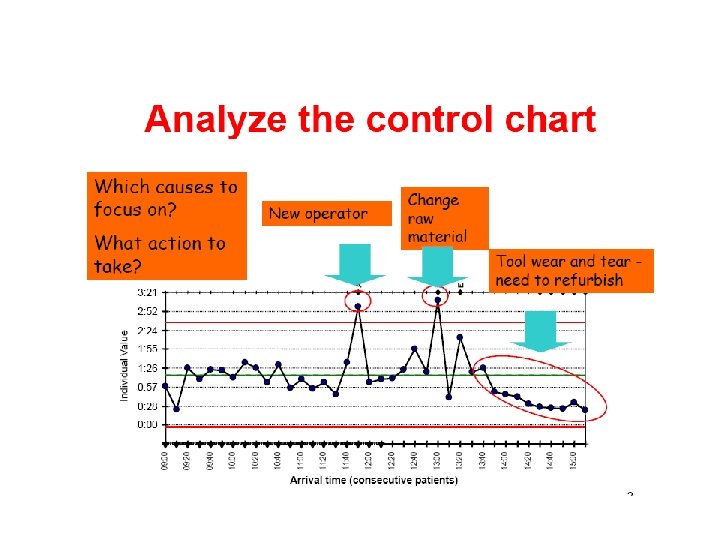
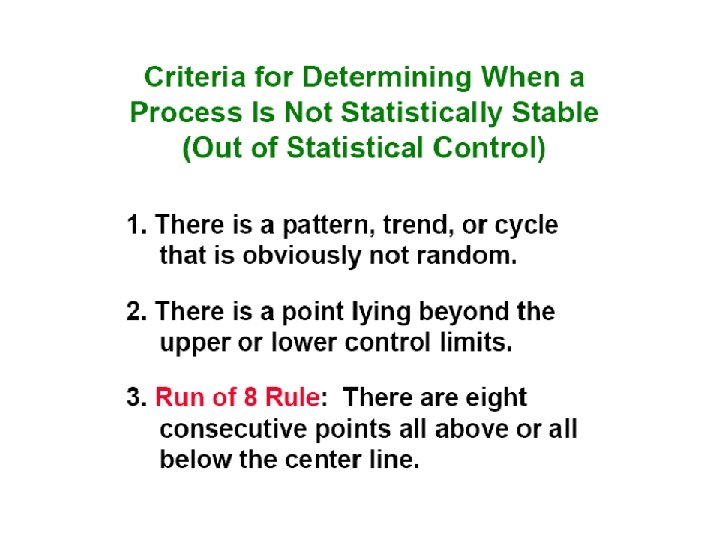
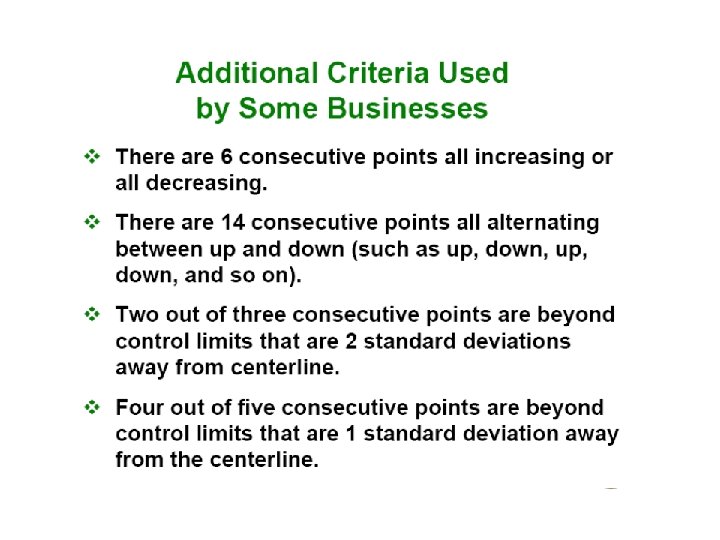
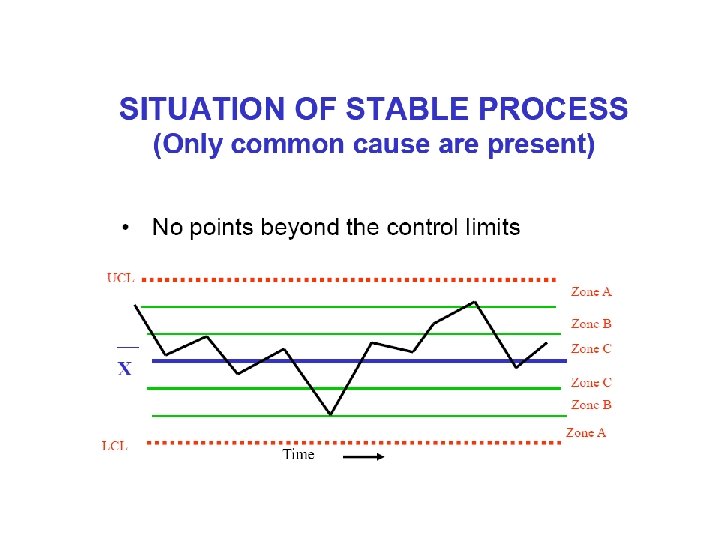
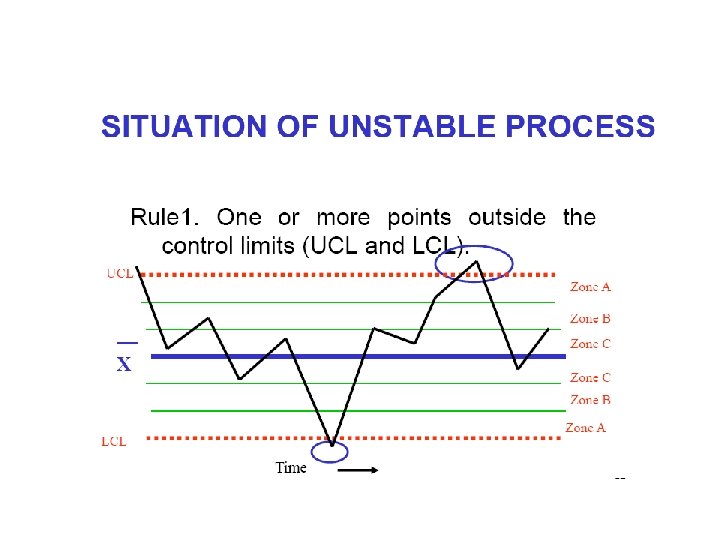
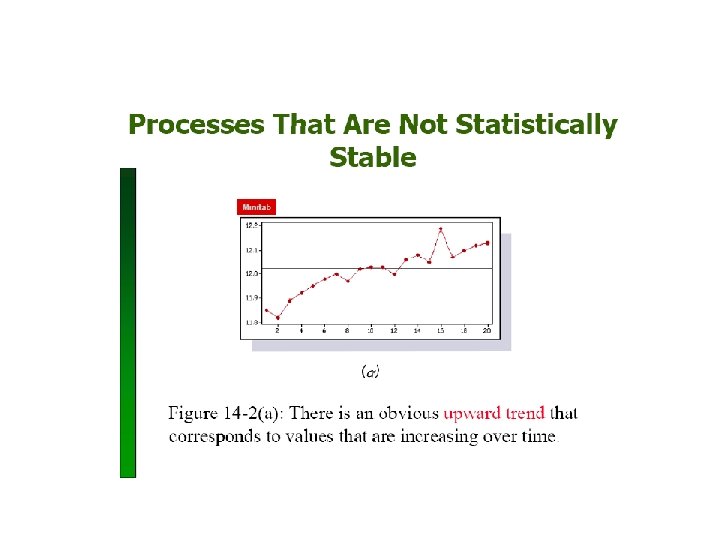
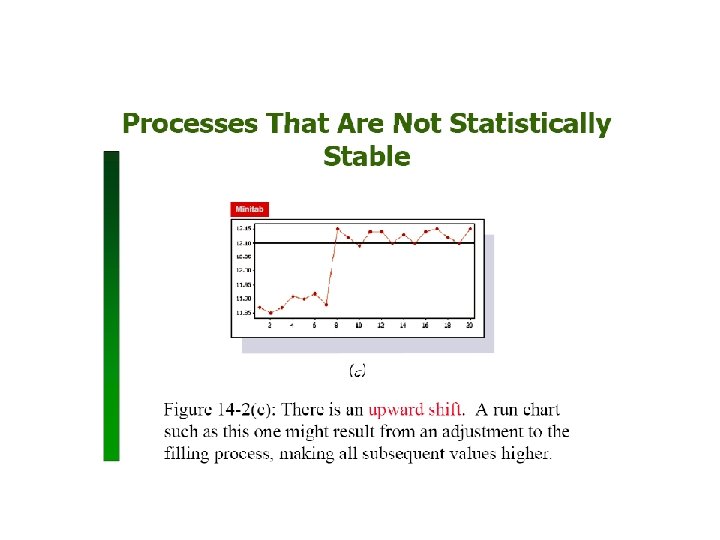
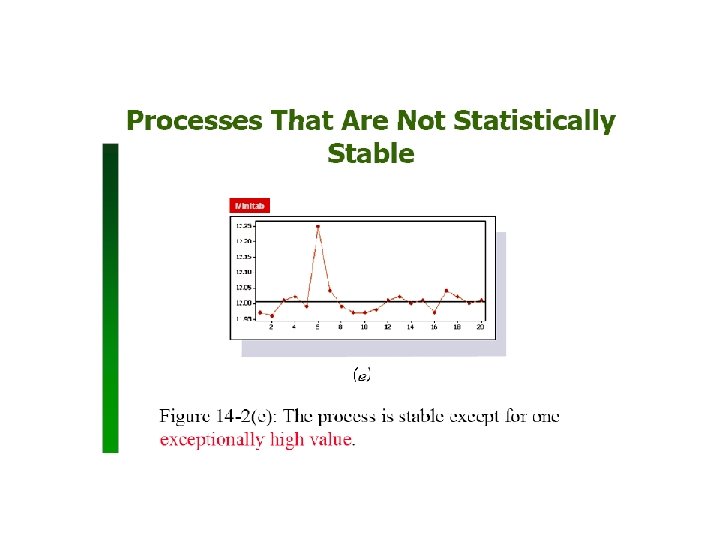
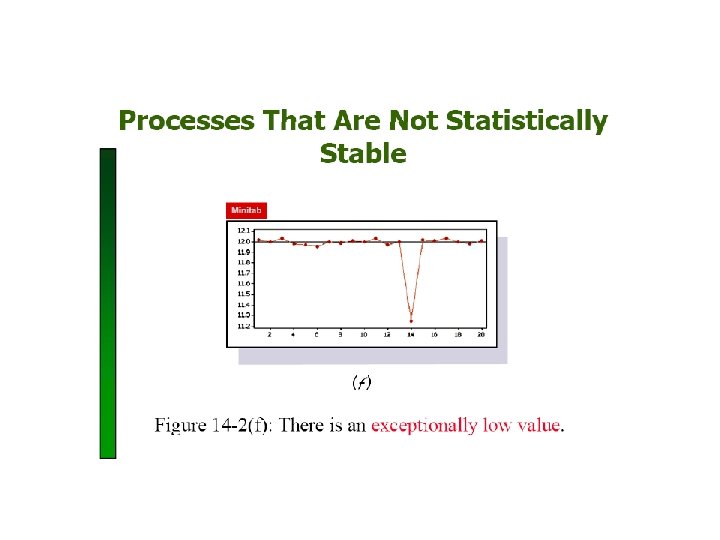
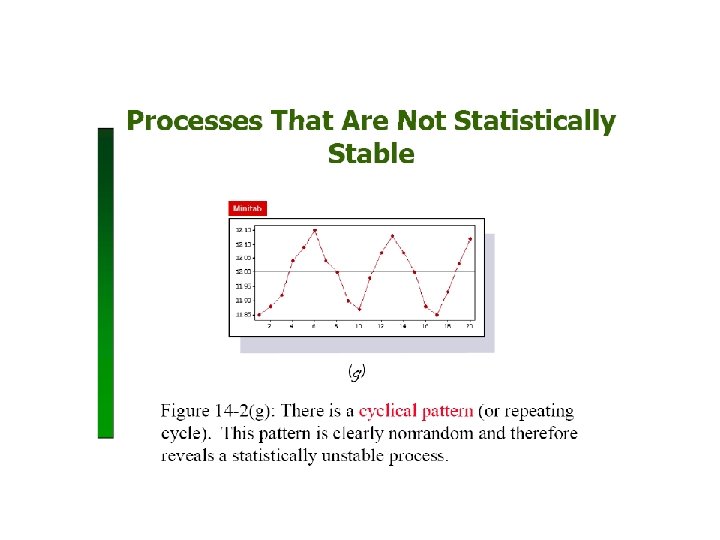
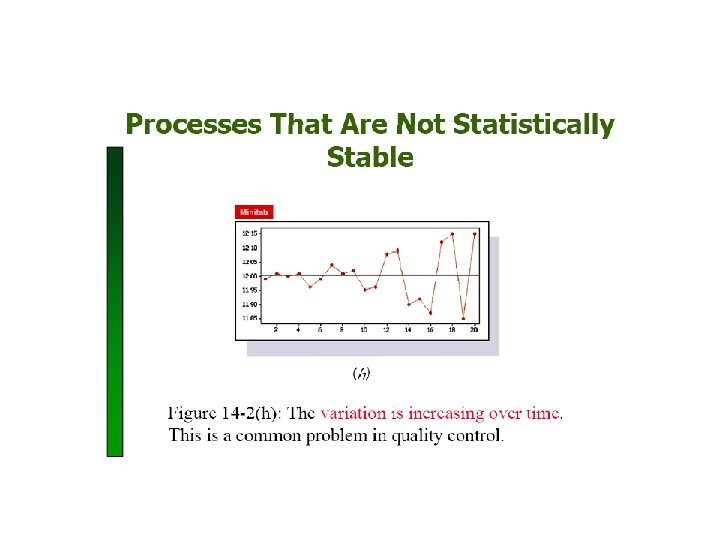
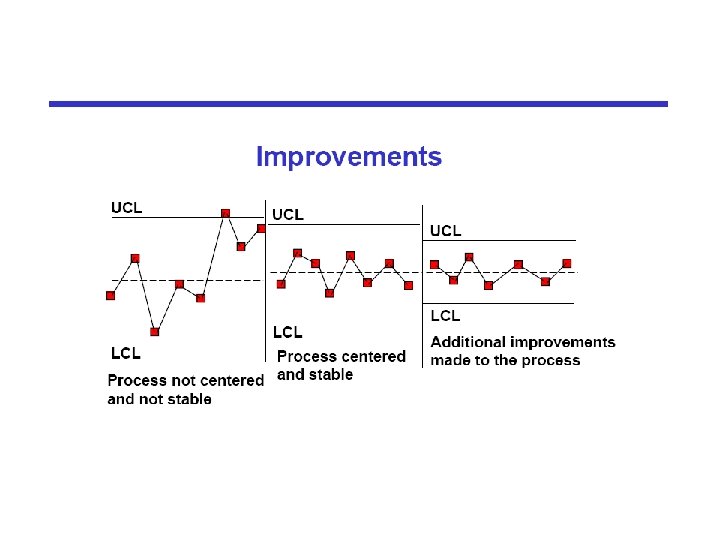
Analyze The Control Chart
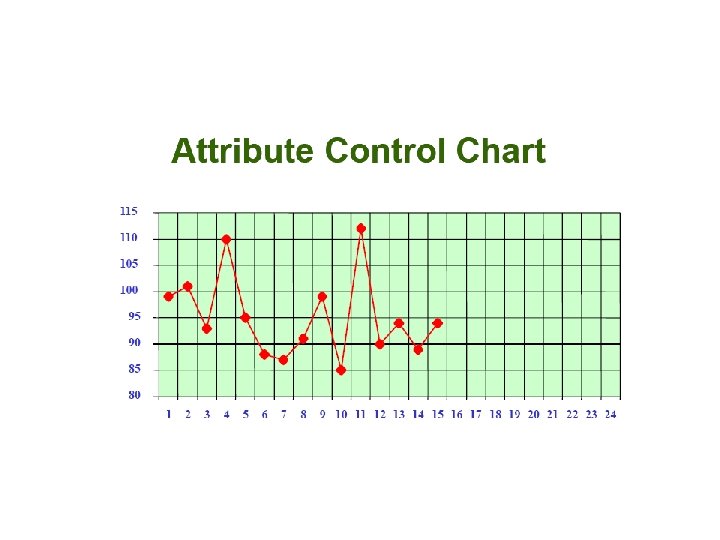

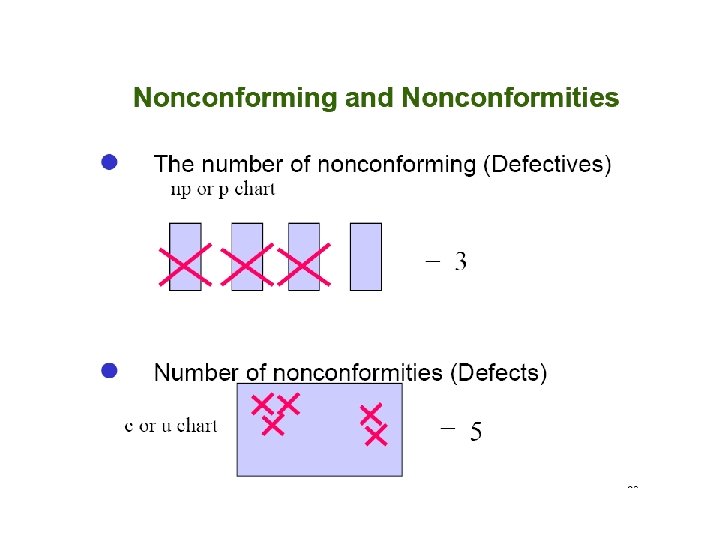
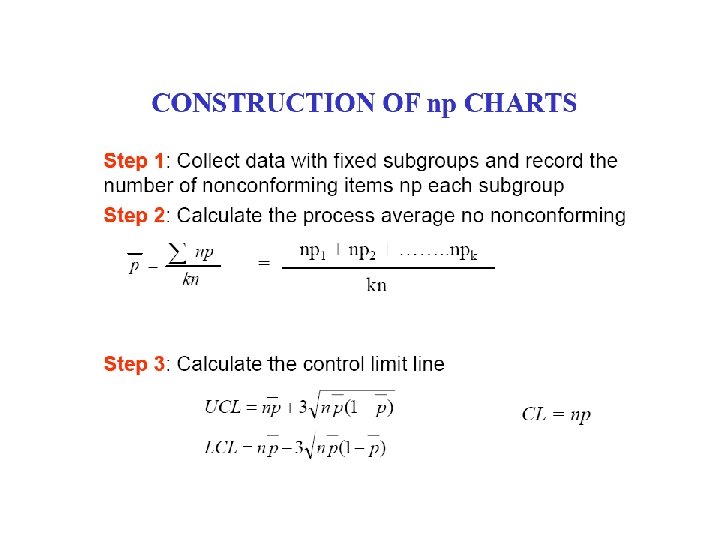
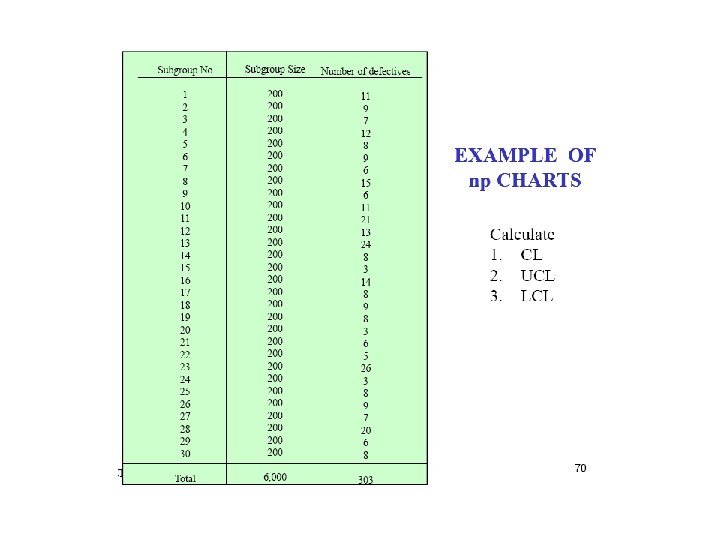
The np chart uses counts while the p chart uses percent's, or fractions of nonconforming. The same steps are used to construct the np chart that are used to construct the p chart. There is one difference the centre line for the p chart is based on the average percent nonconforming. The centerline for np chart is calculated as follows: np= (subgroup size) (total number nonconforming/ total number inspected.

End Thank you for attending!

- Slides: 81