Statistical Process Control Basic Concepts Course 4 Quality

Statistical Process Control Basic Concepts Course 4: Quality Management for Extended Enterprise Curriculum Development of Master’s Degree Program in Industrial Engineering for Thailand Sustainable Smart Industry

Outlines • Intro to statistical process control • Basic SPC tools • Control charts
 is defined as the use of statistical techniques")
SPC • Statistical process control (SPC) is defined as the use of statistical techniques to control a process or production method [1] • SPC tools and procedures can help you monitor process behavior, discover issues in internal systems, and find solutions for production issues. • Statistical process control is often used interchangeably with statistical quality control (SQC), which is also • a key continuous improvement tool • a fundamental tool in six sigma methodology [1] https: //asq. org/quality-resources/statistical-process-control


SQC vs. SPC https: //asq. org/quality-resources/statistical-process-control

SQC vs. SPC https: //asq. org/quality-resources/statistical-process-control
![Statistical Process Control (SPC) • The first control chart was developed around 1924[1] by](http://slidetodoc.com/presentation_image_h2/e966712bd97698d73b151532cd2973a6/image-7.jpg "Statistical Process Control (SPC) • The first control chart was developed around 1924[1] by")
Statistical Process Control (SPC) • The first control chart was developed around 1924[1] by Walter A. Shewhart as a method to improve or achieve quality control in a manufacturing process [1] Introduction to Statistical Quality Control, 6 th Edition by Douglas C. Montgomery. Walter A. Shewart (1891 -1967)
![Statistical Process Control (SPC) • แผนภมควบคมแรกไดรบการพฒนาประมาณป 1924[1] โดย Walter A. Shewhart เปนวธการปรบปรงหรอการควบคมคณภาพในกระบวนการผลต [1] Introduction](http://slidetodoc.com/presentation_image_h2/e966712bd97698d73b151532cd2973a6/image-8.jpg "Statistical Process Control (SPC) • แผนภมควบคมแรกไดรบการพฒนาประมาณป 1924[1] โดย Walter A. Shewhart เปนวธการปรบปรงหรอการควบคมคณภาพในกระบวนการผลต [1] Introduction")
Statistical Process Control (SPC) • แผนภมควบคมแรกไดรบการพฒนาประมาณป 1924[1] โดย Walter A. Shewhart เปนวธการปรบปรงหรอการควบคมคณภาพในกระบวนการผลต [1] Introduction to Statistical Quality Control, 6 th Edition by Douglas C. Montgomery. Walter A. Shewart (1891 -1967)

Basic SPC Tools 1. 2. 3. 4. 5. 6. 7. Cause-and-Effect diagram Check sheet Control chart Histogram Pareto chart Scatter diagram Defect concentration diagram

Basic SPC Tools 1. 2. 3. 4. 5. 6. 7. Cause-and-Effect diagram Check sheet Control chart Histogram Pareto chart Scatter diagram Defect concentration diagram

An Application of SPC • Improving quality in a copper plating operation at a printed circuit board fabrication plant • The DMAIC process was used • During the define step, the team decided to focus on reducing flow time through the process • During the measures step, controller downtime was recognized as a major factor in excessive flow time

Cause-and-Effect Diagram

Cause-and-Effect Diagram

Check Sheet

Check Sheet

Pareto Diagram

Pareto Diagram

Control Chart X chart R chart

Control Chart X chart R chart

Control Chart Course 4: Quality Management for Extended Enterprise Curriculum Development of Master’s Degree Program in Industrial Engineering for Thailand Sustainable Smart Industry

Control Chart Course 4: Quality Management for Extended Enterprise Curriculum Development of Master’s Degree Program in Industrial Engineering for Thailand Sustainable Smart Industry

Process Center and Process Variability

Process Center and Process Variability
 =")
Two Sources of Variability 1. Due to chance causes • Chance cause (Shewhart) = common cause (Juran) = white noise (GE) = background noise = Inherent cause • The chance-cause variation is inherent in a production process and inevitable • Humidity, temperature, etc. (due to environment) • A process that is operating with only chance causes of variation (or natural variability) present is said to be in statistical control
 1. Due to assignable causes • Assignable cause")
Two Sources of Variability (cond. ) 1. Due to assignable causes • Assignable cause (Shewhart) = special cause (Juran) = black noise = external cause • The assignable-cause variation is very critical, and so the cause must be identified • Operator errors, defective raw materials, improperly adjusted machines, etc. • A process that is operating in presence of assignable causes of variation is said to be out of control

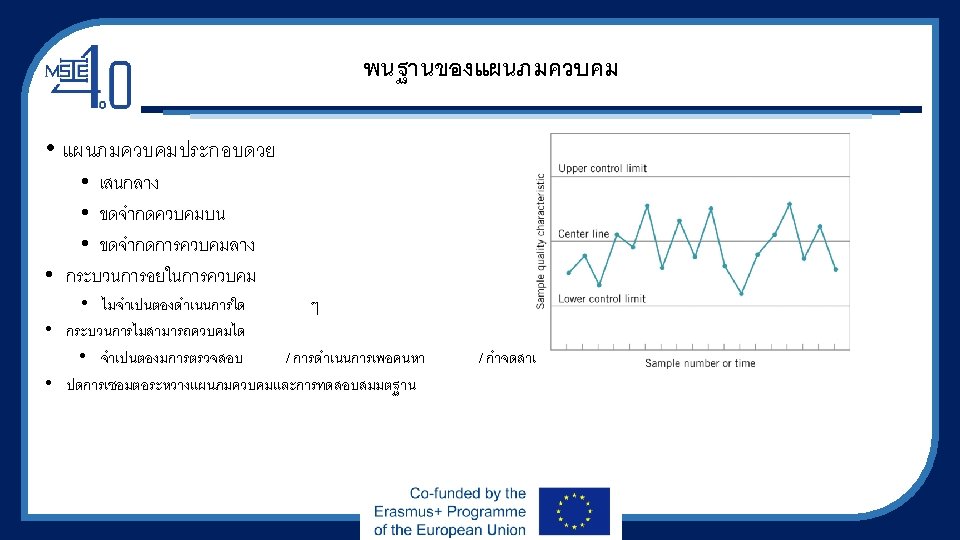
Basis of the Control Chart • A control chart contains • A center line • An upper control limit • A lower control limit • Process is in control • No action is necessary • Process is out of control • Investigation / action are required to find / eliminate assignable causes • Close connection between control charts and hypothesis testing

Main Purpose of Control Charts • Quickly detect process shifts • Identify assignable causes • Take corrective actions (before many nonconforming units are manufactured) • Reduce process variability • Improve process quality • Maximize product quality • Satisfy customers • Gain market share


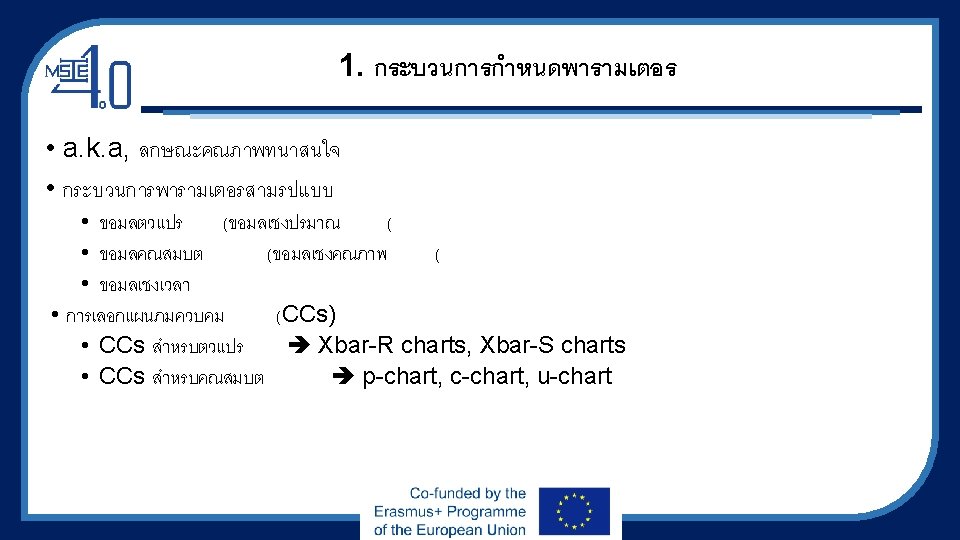
Steps of Control Charts 1. Define process parameters 2. Design Samples 3. Determine CL, UCL, and LCL 4. Plot data 5. Make judgments

Steps of Control Charts 1. Define process parameters 2. Design Samples 3. Determine CL, UCL, and LCL 4. Plot data 5. Make judgments

1. Define Process Parameter • a. k. a, Quality characteristics of interest • Three types of Process Parameter • Variables data (quantitative data) • Attributes data (qualitative data) • Time-oriented data • Selection of control charts (CCs) • CCs for variables Xbar-R charts, Xbar-S charts • CCs for attributes p-chart, c-chart, u-chart

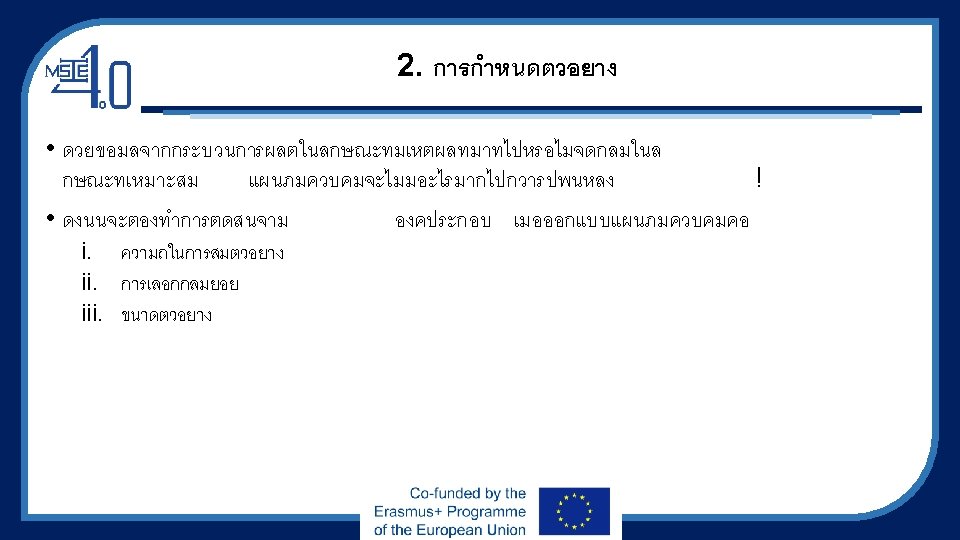
2. Design Samples • With data which are not obtained from a production process in a rational manner or not subgrouped in a rational manner, a control chart will be nothing more than wallpaper! • Therefore, three decisions must be made when designing a control chart, which are i. Sampling frequency ii. Selection of subgroup iii. Sample size

i. Sampling Frequency There are several major strategies that may be employed in sampling frequency • Use of regular intervals with grouped spacing (= clustering) or regular intervals with individual unit spacing • Use of random intervals with grouped spacing or with individual unit spacing • Use of regular interval sampling with judgment-based modification


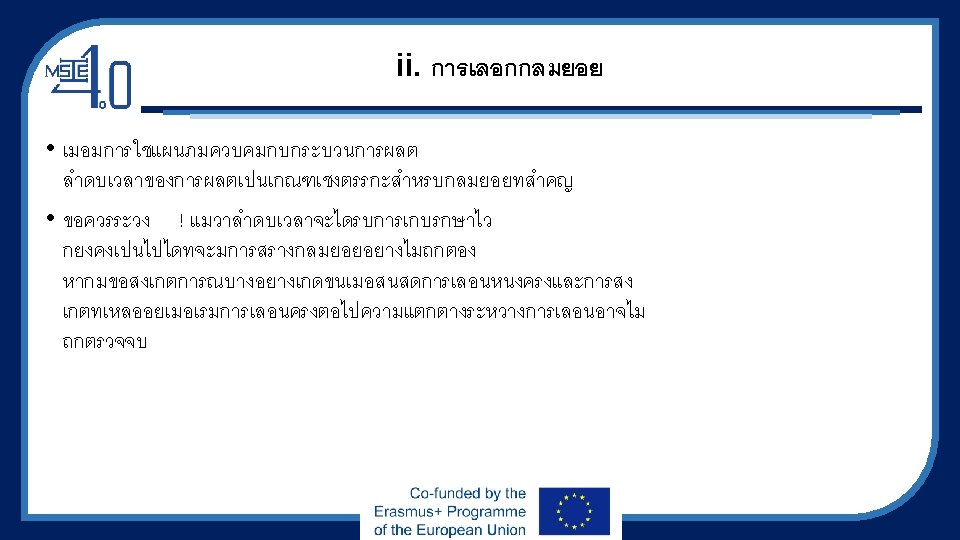
ii. Selection of subgroup • When control charts are applied to production processes, time order of production is a logical basis for rational subgroups • Be careful! Although time order is preserved, it is still possible to form subgroups erroneously. If some of the observations are taken at the end of one shift and the remaining observations are taken at the start of the next shift, then any differences between shifts might not be detected
 Two general approaches to select subgroups 1) Each")
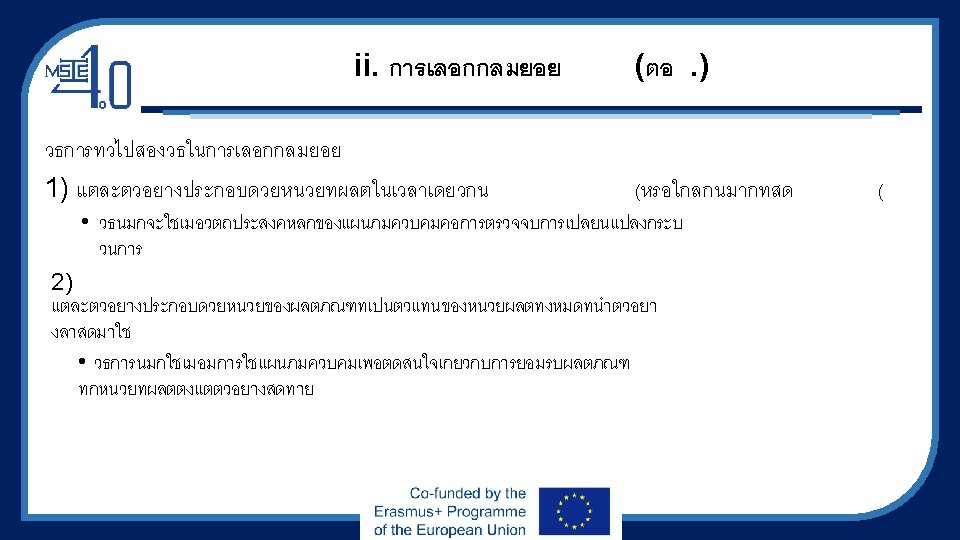
ii. Selection of subgroup (cond. ) Two general approaches to select subgroups 1) Each sample consists of units that are produced at the same time (or as closely together as possible) • This approach is often used when the primary purpose of the control chart is to detect process shifts 2) Each sample consists of units of product that are representation of all units that have been produced since the last sample was taken • This approach is often used, when the control chart is employed to make decisions about the acceptance of all units of product that have been produced since the last sample.

iii. Sample Size • In designing a control chart, we must specify both sample size to use and the sampling frequency. They are often treated as decision variables in the area called “economic design of control charts. ” In general, • Larger samples (= lager sample size) will make it easier to detect small shifts in the process. • Smaller sample sizes will make it easier to detect a large shift in the process. • Tip: When determining the sample size, you must keep in mind the size of the shift that you are trying to detect.
 Use larger sample")
Sample Size / Sampling Frequency There are four possible cases: 1) Use larger sample sizes at short intervals. 2) Use larger sample sizes at longer intervals. 3) Use small sample sizes at short intervals. 4) Use small sample sizes at longer intervals.

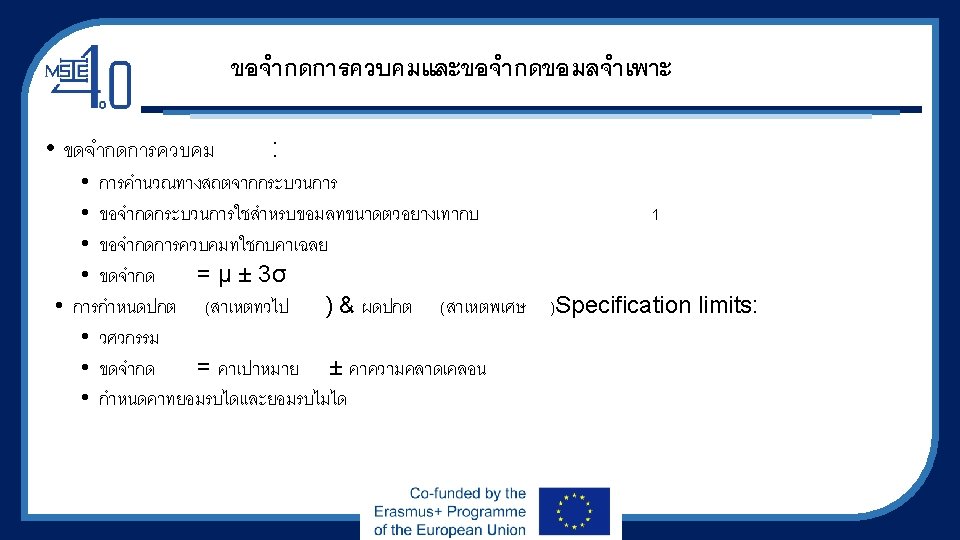
Control Limits and Specification Limits • Control limits: • • • Statistical calculation from a process Process limits are used for individual items Control limits are used with averages Limits = μ ± 3σ Define usual (common causes) & unusual (special causes) • Specification limits: • Engineered • Limits = target ± tolerance • Define acceptable & unacceptable
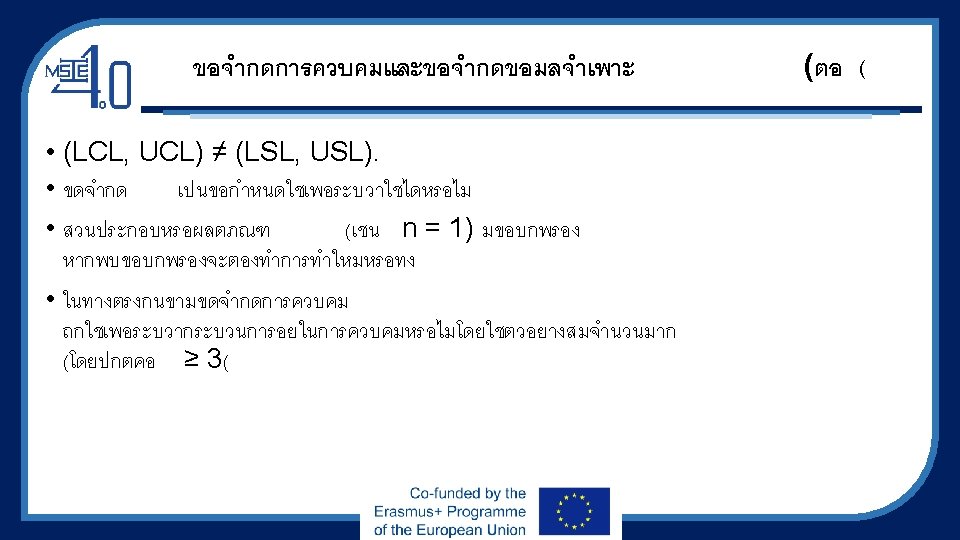
 • (LCL, UCL) ≠ (LSL, USL). •")
Control Limits and Specification Limits (cond. ) • (LCL, UCL) ≠ (LSL, USL). • Specification limits are used to identify whether or not a • component or product (i. e. , n=1) is defective. If a defect is found, it needs to be reworked or scrapped. • In contrast, control limits are used to identify whether or not a process is in control by utilizing a number of random samples (usually n ≥ 3)

Examining Variation

Examining Variation

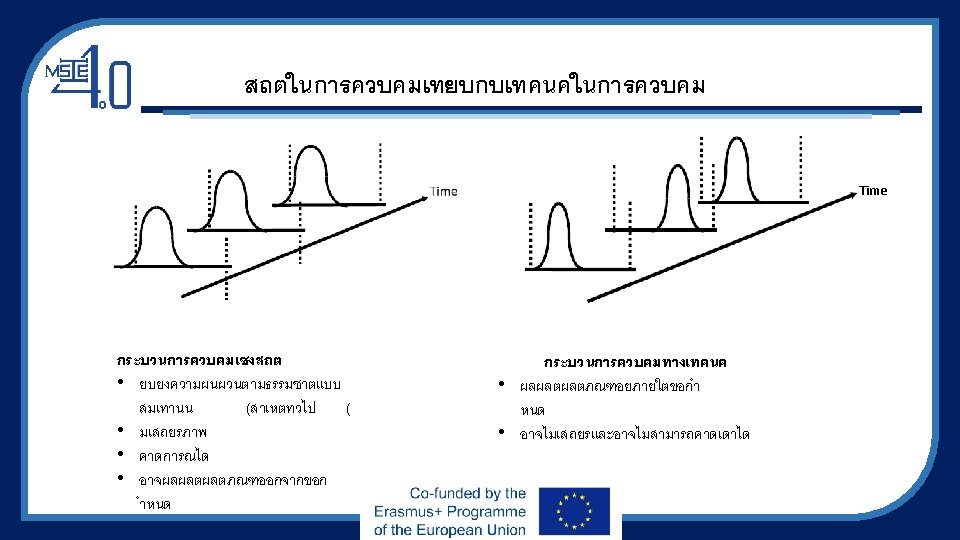
Statistically in Control vs. Technically in Control Time Statistically controlled process • inhibits only natural random fluctuations (common causes) • is stable • is predictable • may yield products out of specification Technically controlled process • yields products within specification • may not be stable and so may not be predictable

Curriculum Development of Master’s Degree Program in Industrial Engineering for Thailand Sustainable Smart Industry
- Slides: 57