Statistical NLP Lecture 8 Statistical Inference ngram Models
")


=C(w 1,")


=(C(w 1,")


 • In the Brown Corpus, suppose for n =2, N 2=4000")
")


")
")

- Slides: 23
Statistical NLP: Lecture 8 Statistical Inference: n-gram Models over Sparse Data (Ch 6)
Overview • Statistical Inference consists of taking some data (generated in accordance with some unknown probability distribution) and then making some inferences about this distribution. • There are three issues to consider: – Dividing the training data into equivalence classes – Finding a good statistical estimator for each equivalence class – Combining multiple estimators
Forming Equivalence Classes I • Classification Problem: try to predict the target feature based on various classificatory features. ==> Reliability versus discrimination • Markov Assumption: Only the prior local context affects the next entry: (n-1)th Markov Model or ngram • Size of the n-gram models versus number of parameters: we would like n to be large, but the number of parameters increases exponentially with n. • There exist other ways to form equivalence classes of the history, but they require more complicated methods ==> will use n-grams here.
Statistical Estimators I: Overview • Goal: To derive a good probability estimate for the target feature based on observed data • Running Example: From n-gram data P(w 1, . . , wn) predict P(wn+1|w 1, . . , wn) • Solutions we will look at: – – – Maximum Likelihood Estimation Laplace’s, Lidstone’s and Jeffreys-Perks’ Laws Held Out Estimation Cross-Validation Good-Turing Estimation
Statistical Estimators II: Maximum Likelihood Estimation • PMLE(w 1, . . , wn)=C(w 1, . . , wn)/N, where C(w 1, . . , wn) is the frequency of n-gram w 1, . . , wn • PMLE(wn|w 1, . . , wn-1)= C(w 1, . . , wn)/C(w 1, . . , wn-1) • This estimate is called Maximum Likelihood Estimate (MLE) because it is the choice of parameters that gives the highest probability to the training corpus. • MLE is usually unsuitable for NLP because of the sparseness of the data ==> Use a Discounting or Smoothing technique.
Example
Statistical Estimators III: Smoothing Techniques: Laplace • PLAP(w 1, . . , wn)=(C(w 1, . . , wn)+1)/(N+B), where C(w 1, . . , wn) is the frequency of n-gram w 1, . . , wn and B is the number of bins training instances are divided into. ==> Adding One Process • The idea is to give a little bit of the probability space to unseen events. • However, in NLP applications that are very sparse, Laplace’s Law actually gives far too much of the probability space to unseen events.
Example
Example
Statistical Estimators IV: Smoothing Techniques: Lidstone and Jeffrey-Perks • Since the adding one process may be adding too much, we can add a smaller value l. • PLID(w 1, . . , wn)=(C(w 1, . . , wn)+l)/(N+Bl), where C(w 1, . . , wn) is the frequency of n-gram w 1, . . , wn and B is the number of bins training instances are divided into, and l>0. ==> Lidstone’s Law • If l=1/2, Lidstone’s Law corresponds to the expectation of the likelihood and is called the Expected Likelihood Estimation (ELE) or the Jeffreys-Perks Law.
Statistical Estimators V, Robust Techniques: Held Out Estimation • For each n-gram, w 1, . . , wn , we compute C 1(w 1, . . , wn) and C 2(w 1, . . , wn), the frequencies of w 1, . . , wn in training and held out data, respectively. • Let Nr be the number of bigrams with frequency r in the training text. • Let Tr be the total number of times that all n-grams that appeared r times in the training text appeared in the held out data. • An estimate for the probability of one of these ngram is: Pho(w 1, . . , wn)= Tr/(Nr. N) where C(w 1, . . , wn)= r.
Statistical Estimators VI: Robust Techniques: Cross-Validation • Held Out estimation is useful if there is a lot of data available. If not, it is useful to use each part of the data both as training data and held out data. • Deleted Estimation [Jelinek & Mercer, 1985]: Let Nr a be the number of n-grams occurring r times in the ath part of the training data and Trab be the total occurrences of those bigrams from part a in part b. Pdel(w 1, . . , wn)= (Trab+Trba)/N(Nra+Nrb) where C(w 1, . . , wn) = r. • Leave-One-Out [Ney et al. , 1997]
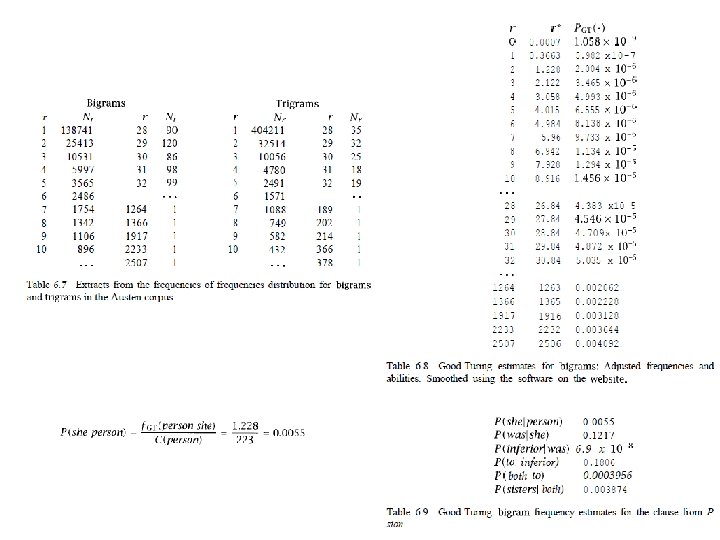
Statistical Estimators VI: Related Approach: Good-Turing Estimator • • • If C(w 1, . . , wn) = r > 0, PGT(w 1, . . , wn) = r*/N where r*=(r+1)Nr/r • If C(w 1, . . , wn) = 0, PGT(w 1, . . , wn) » N 1/(N 0 N) • Simple Good-Turing [Gale & Sampson, 1995]: • Use a smoothed estimate of the expectation of Nr. • As a smoothing curve, use Nr=arb (with b < -1) and estimate a and b by simple linear regression on the logarithmic form of this equation: log Nr= log a + b log r, if r is large. • For low values of r, use the measured Nr directly.
Good-Turing Smoothing (example) • In the Brown Corpus, suppose for n =2, N 2=4000 N 3=2400. • Then 2* = 3 (2400/4000) = 1. 8 • PGT (jungle|green) = 3*/207 = 2. 2/207 = 0. 01062
Good-Turing Smoothing (example)
Combining Estimators I: Overview • If we have several models of how the history predicts what comes next, then we might wish to combine them in the hope of producing an even better model. • Combination Methods Considered: – Simple Linear Interpolation – Katz’s Backing Off – General Linear Interpolation
Combining Estimators II: Simple Linear Interpolation • One way of solving the sparseness in a trigram model is to mix that model with bigram and unigram models that suffer less from data sparseness. • This can be done by linear interpolation (also called finite mixture models). When the functions being interpolated all use a subset of the conditioning information of the most discriminating function, this method is referred to as deleted interpolation. • Pli(wn|wn-2, Wn-1)=l 1 P 1 (wn)+ l 2 P 2 (wn|wn-1)+ l 3 P 3 (wn|wn-1, Wn-2) where 0£li £ 1 and Si li =1 • The weights can be set automatically using the Expectation. Maximization (EM) algorithm.
Combining Estimators II: Katz’s Backing Off Model • In back-off models, different models are consulted in order depending on their specificity. • If the n-gram of concern has appeared more than k times, then an n-gram estimate is used but an amount of the MLE estimate gets discounted (it is reserved for unseen n-grams). • If the n-gram occurred k times or less, then we will use an estimate from a shorter n-gram (back-off probability), normalized by the amount of probability remaining and the amount of data covered by this estimate. • The process continues recursively.
Katz’s Backing Off Model (3 -grams)
Katz’s Backing Off Model (2 -grams)
Combining Estimators II: General Linear Interpolation • In simple linear interpolation, the weights were just a single number, but one can define a more general and powerful model where the weights are a function of the history. • For k probability functions Pk, the general form for a linear interpolation model is: Pli(w|h)= Sik li (h) Pi (w|h) where 0£li (h)£ 1 and Si li (h) =1