
Statistical Methods for Particle Physics Lecture 2 further






- Slides: 77
Statistical Methods for Particle Physics Lecture 2: further topics https: //indico. fnal. gov/conference. Time. Table. py? conf. Id=11505 Lectures on Statistics HCPSS – Fermilab 11, 12 August 2016 Glen Cowan Physics Department Royal Holloway, University of London g. cowan@rhul. ac. uk www. pp. rhul. ac. uk/~cowan G. Cowan HCPSS 2016 / Statistics Lecture 2 1
Outline Lecture 1: Introduction and review of fundamentals Probability, random variables, pdfs Parameter estimation, maximum likelihood Statistical tests for discovery and limits Lecture 2: Further topics (Brief overview of multivariate methods) → extra slides Nuisance parameters and systematic uncertainties Experimental sensitivity G. Cowan HCPSS 2016 / Statistics Lecture 2 2
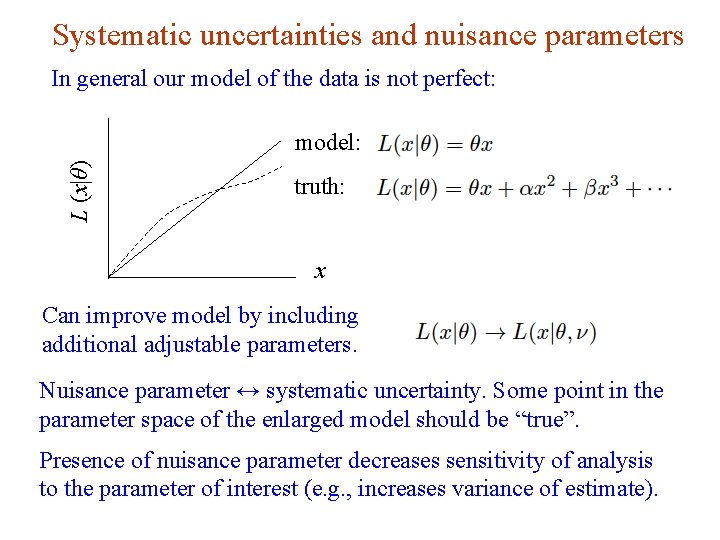
Systematic uncertainties and nuisance parameters In general our model of the data is not perfect: L (x|θ) model: truth: x Can improve model by including additional adjustable parameters. Nuisance parameter ↔ systematic uncertainty. Some point in the parameter space of the enlarged model should be “true”. Presence of nuisance parameter decreases sensitivity of analysis to the parameter of interest (e. g. , increases variance of estimate). G. Cowan HCPSS 2016 / Statistics Lecture 2 3
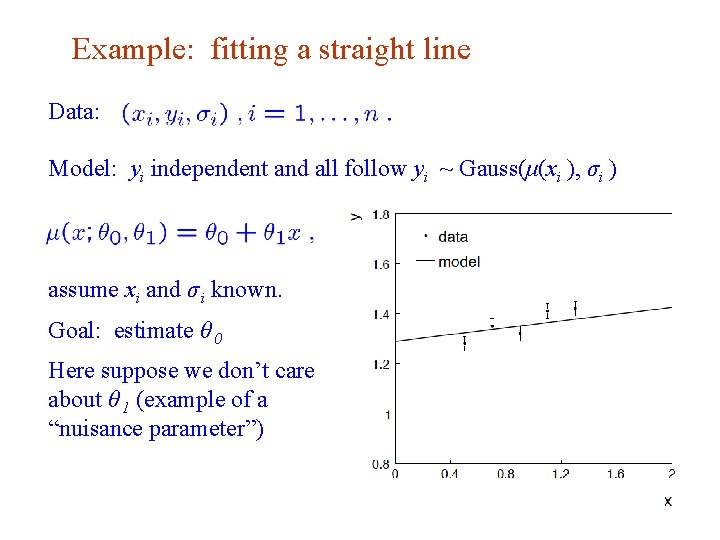
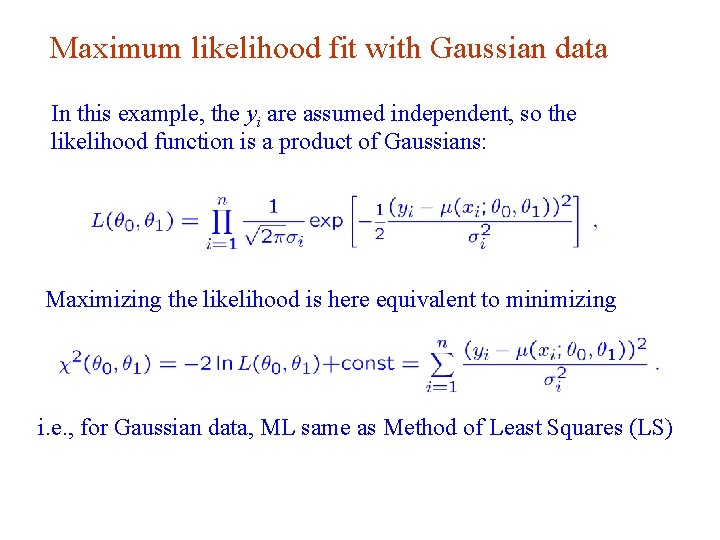
Example: fitting a straight line Data: Model: yi independent and all follow yi ~ Gauss(μ(xi ), σi ) assume xi and σ i known. Goal: estimate θ 0 Here suppose we don’t care about θ 1 (example of a “nuisance parameter”) G. Cowan HCPSS 2016 / Statistics Lecture 2 4
Maximum likelihood fit with Gaussian data In this example, the yi are assumed independent, so the likelihood function is a product of Gaussians: Maximizing the likelihood is here equivalent to minimizing i. e. , for Gaussian data, ML same as Method of Least Squares (LS) G. Cowan HCPSS 2016 / Statistics Lecture 2 5
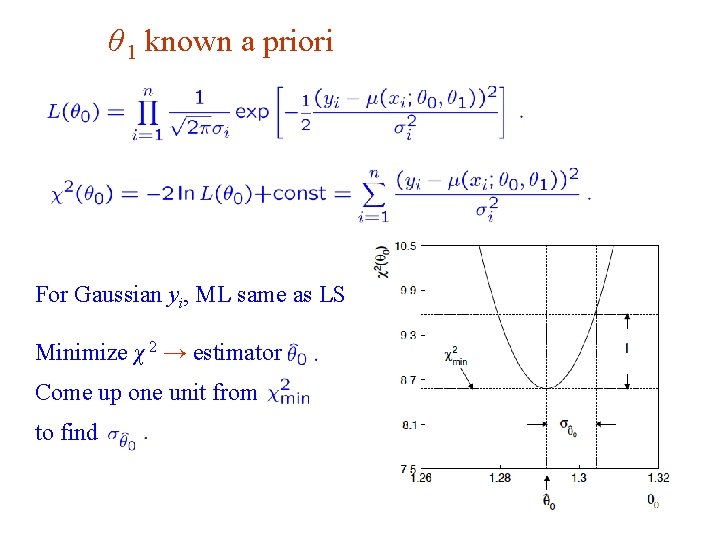
θ 1 known a priori For Gaussian yi, ML same as LS Minimize χ 2 → estimator Come up one unit from to find G. Cowan HCPSS 2016 / Statistics Lecture 2 6
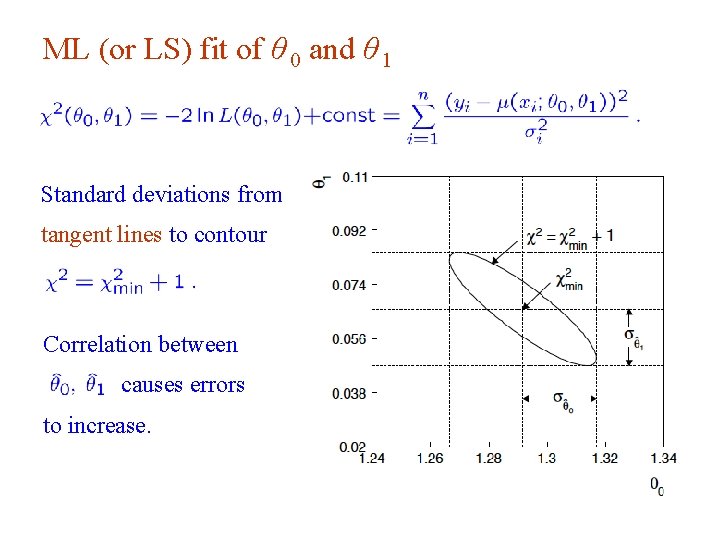
ML (or LS) fit of θ 0 and θ 1 Standard deviations from tangent lines to contour Correlation between causes errors to increase. G. Cowan HCPSS 2016 / Statistics Lecture 2 7
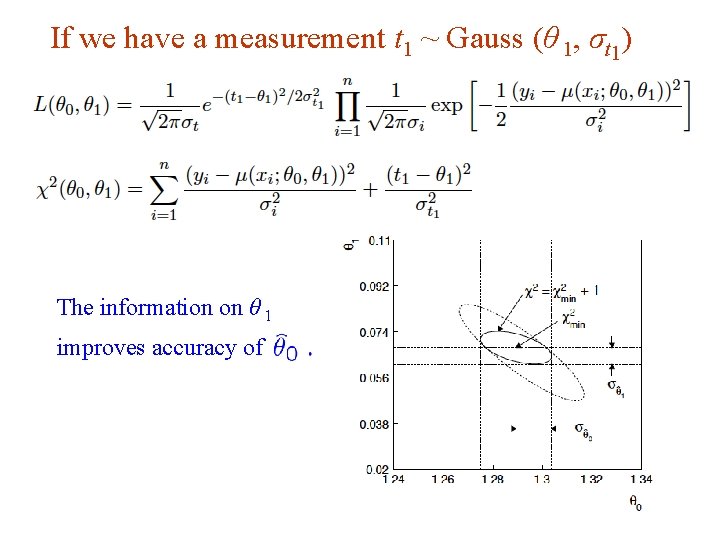
If we have a measurement t 1 ~ Gauss (θ 1, σt 1) The information on θ 1 improves accuracy of G. Cowan HCPSS 2016 / Statistics Lecture 2 8
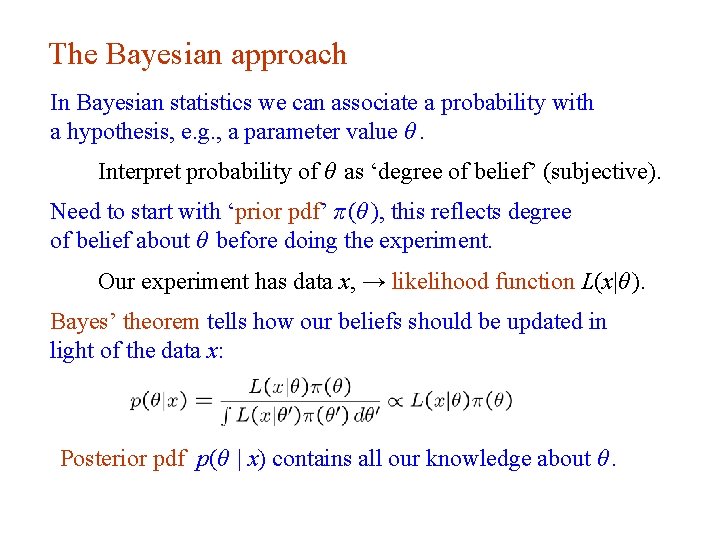
The Bayesian approach In Bayesian statistics we can associate a probability with a hypothesis, e. g. , a parameter value θ. Interpret probability of θ as ‘degree of belief’ (subjective). Need to start with ‘prior pdf’ π (θ ), this reflects degree of belief about θ before doing the experiment. Our experiment has data x, → likelihood function L(x|θ ). Bayes’ theorem tells how our beliefs should be updated in light of the data x: Posterior pdf p(θ | x) contains all our knowledge about θ. G. Cowan HCPSS 2016 / Statistics Lecture 2 Lecture 13 page 9
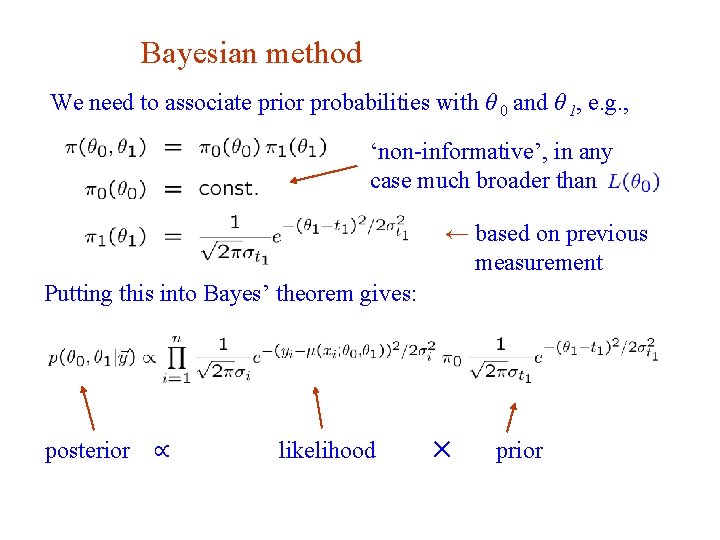
Bayesian method We need to associate prior probabilities with θ 0 and θ 1, e. g. , ‘non-informative’, in any case much broader than ← based on previous measurement Putting this into Bayes’ theorem gives: posterior G. Cowan ∝ likelihood ✕ prior HCPSS 2016 / Statistics Lecture 2 10
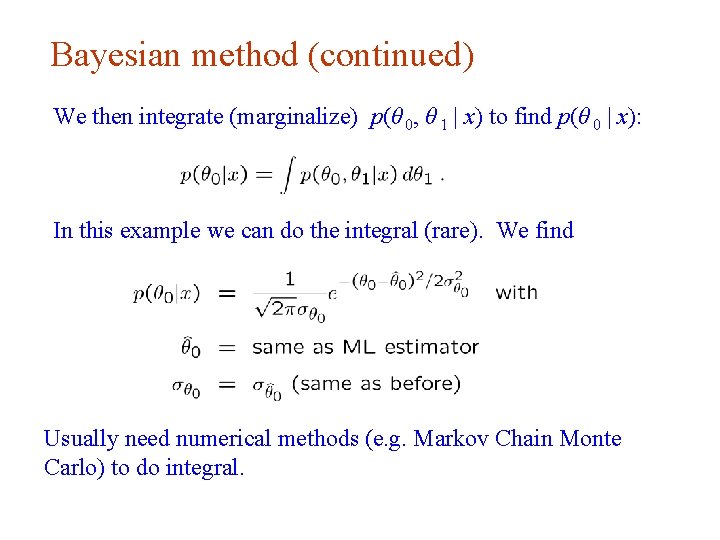
Bayesian method (continued) We then integrate (marginalize) p(θ 0, θ 1 | x) to find p(θ 0 | x): In this example we can do the integral (rare). We find Usually need numerical methods (e. g. Markov Chain Monte Carlo) to do integral. G. Cowan HCPSS 2016 / Statistics Lecture 2 11
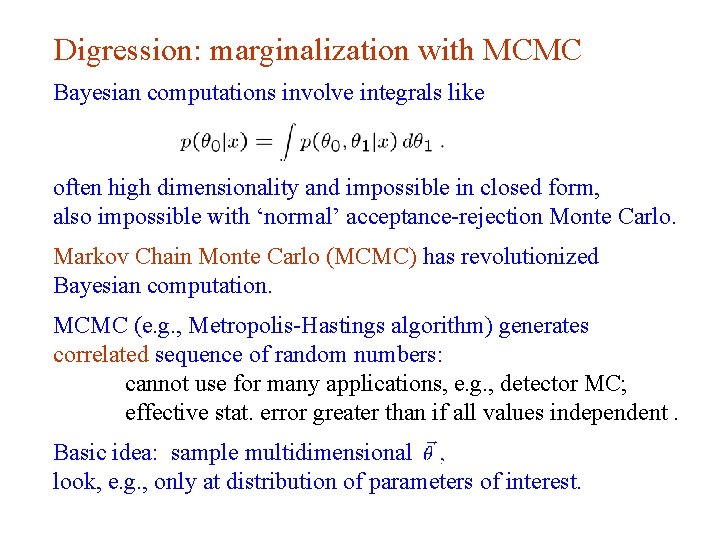
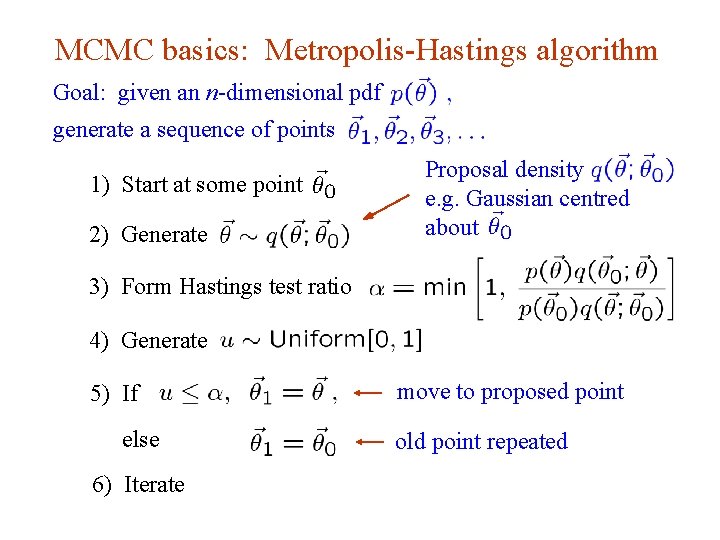
Digression: marginalization with MCMC Bayesian computations involve integrals like often high dimensionality and impossible in closed form, also impossible with ‘normal’ acceptance-rejection Monte Carlo. Markov Chain Monte Carlo (MCMC) has revolutionized Bayesian computation. MCMC (e. g. , Metropolis-Hastings algorithm) generates correlated sequence of random numbers: cannot use for many applications, e. g. , detector MC; effective stat. error greater than if all values independent. Basic idea: sample multidimensional look, e. g. , only at distribution of parameters of interest. G. Cowan HCPSS 2016 / Statistics Lecture 2 12
MCMC basics: Metropolis-Hastings algorithm Goal: given an n-dimensional pdf generate a sequence of points Proposal density e. g. Gaussian centred about 1) Start at some point 2) Generate 3) Form Hastings test ratio 4) Generate 5) If else move to proposed point old point repeated 6) Iterate G. Cowan HCPSS 2016 / Statistics Lecture 2 13
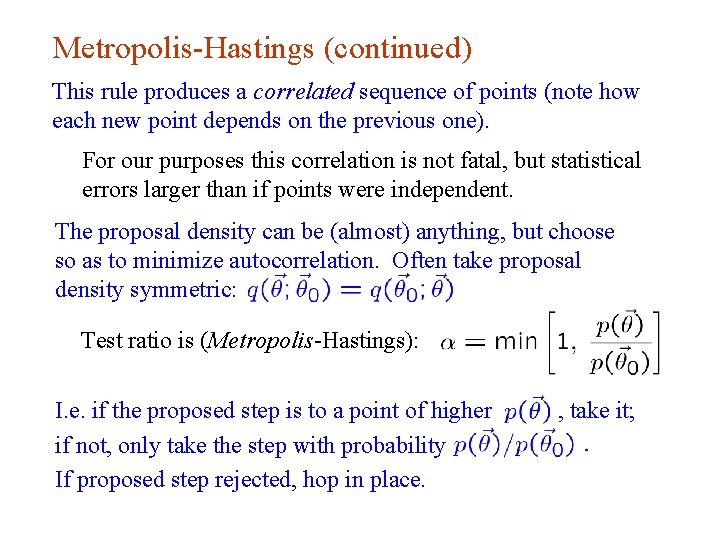
Metropolis-Hastings (continued) This rule produces a correlated sequence of points (note how each new point depends on the previous one). For our purposes this correlation is not fatal, but statistical errors larger than if points were independent. The proposal density can be (almost) anything, but choose so as to minimize autocorrelation. Often take proposal density symmetric: Test ratio is (Metropolis-Hastings): I. e. if the proposed step is to a point of higher if not, only take the step with probability If proposed step rejected, hop in place. G. Cowan HCPSS 2016 / Statistics Lecture 2 , take it; 14
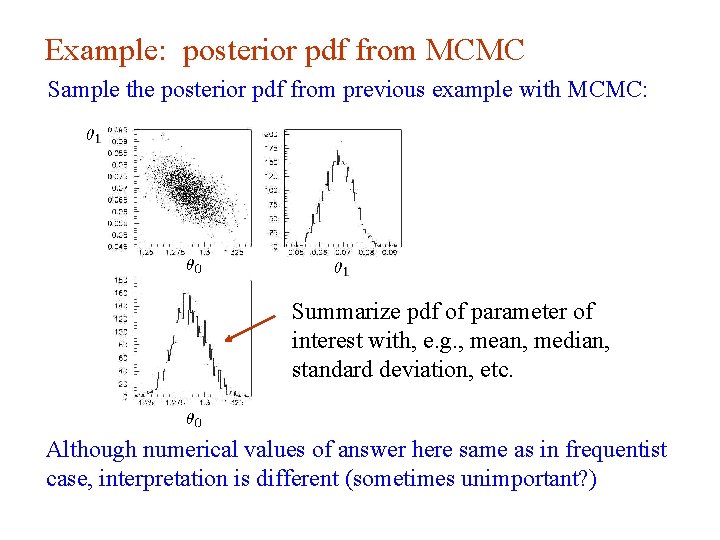
Example: posterior pdf from MCMC Sample the posterior pdf from previous example with MCMC: Summarize pdf of parameter of interest with, e. g. , mean, median, standard deviation, etc. Although numerical values of answer here same as in frequentist case, interpretation is different (sometimes unimportant? ) G. Cowan HCPSS 2016 / Statistics Lecture 2 15
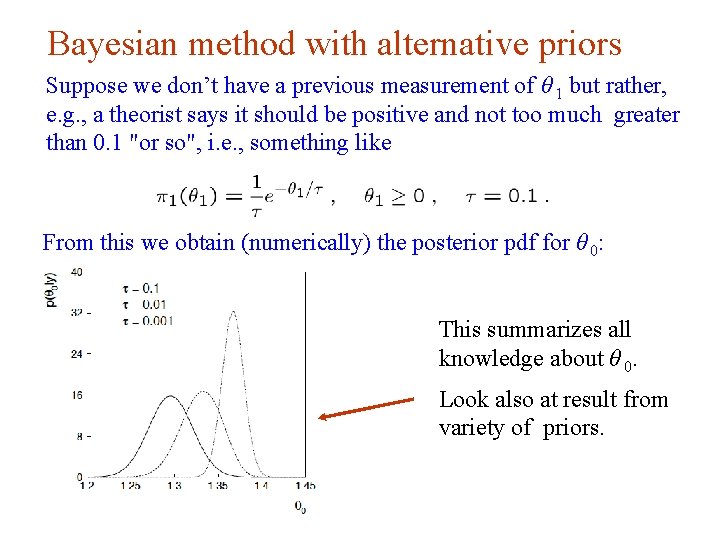
Bayesian method with alternative priors Suppose we don’t have a previous measurement of θ 1 but rather, e. g. , a theorist says it should be positive and not too much greater than 0. 1 "or so", i. e. , something like From this we obtain (numerically) the posterior pdf for θ 0: This summarizes all knowledge about θ 0. Look also at result from variety of priors. G. Cowan HCPSS 2016 / Statistics Lecture 2 16
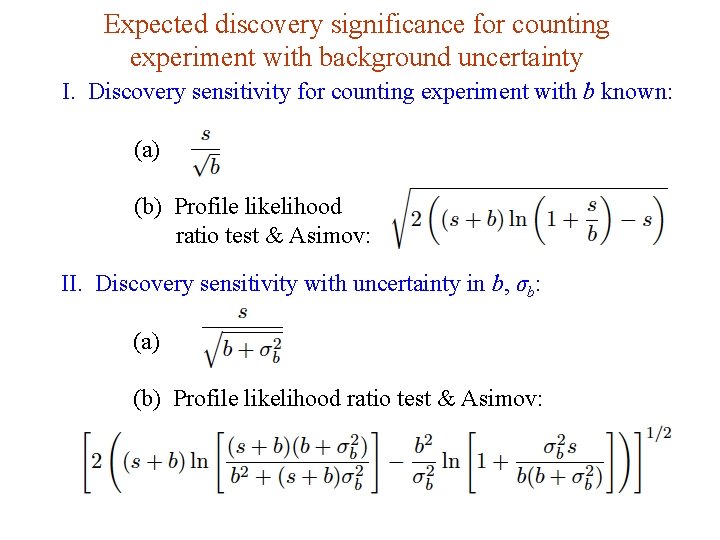
Expected discovery significance for counting experiment with background uncertainty I. Discovery sensitivity for counting experiment with b known: (a) (b) Profile likelihood ratio test & Asimov: II. Discovery sensitivity with uncertainty in b, σb: (a) (b) Profile likelihood ratio test & Asimov: G. Cowan HCPSS 2016 / Statistics Lecture 2 17
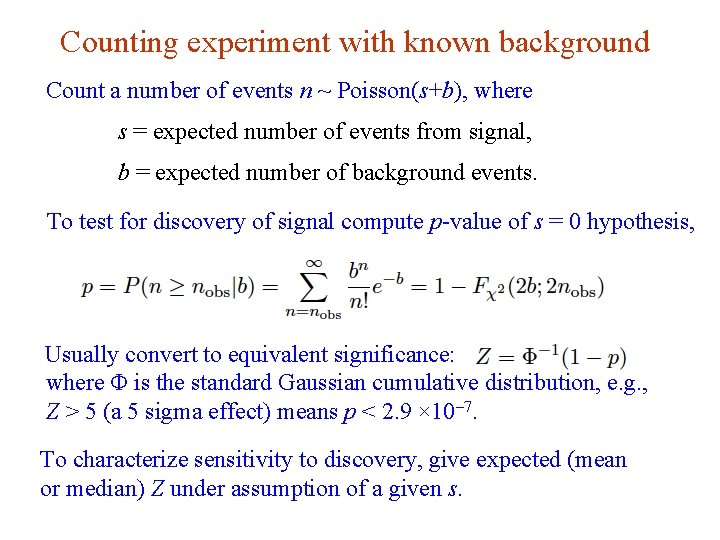
Counting experiment with known background Count a number of events n ~ Poisson(s+b), where s = expected number of events from signal, b = expected number of background events. To test for discovery of signal compute p-value of s = 0 hypothesis, Usually convert to equivalent significance: where Φ is the standard Gaussian cumulative distribution, e. g. , Z > 5 (a 5 sigma effect) means p < 2. 9 × 10 -7. To characterize sensitivity to discovery, give expected (mean or median) Z under assumption of a given s. G. Cowan HCPSS 2016 / Statistics Lecture 2 18
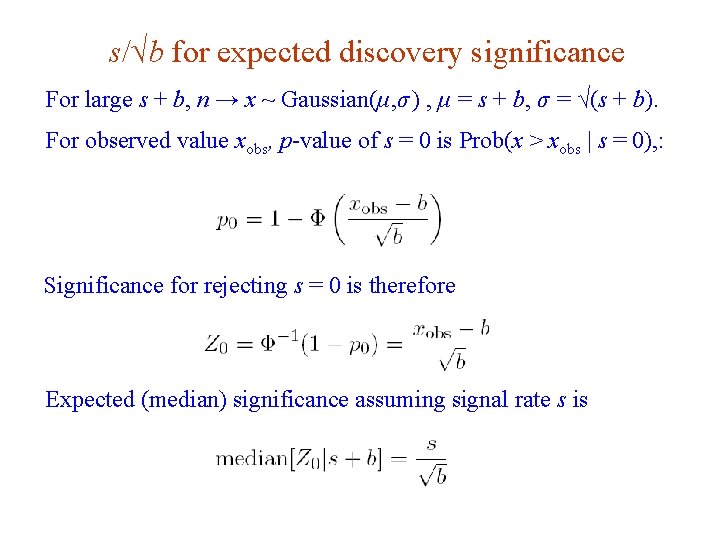
s/√b for expected discovery significance For large s + b, n → x ~ Gaussian(μ, σ ) , μ = s + b, σ = √(s + b). For observed value xobs, p-value of s = 0 is Prob(x > xobs | s = 0), : Significance for rejecting s = 0 is therefore Expected (median) significance assuming signal rate s is G. Cowan HCPSS 2016 / Statistics Lecture 2 19
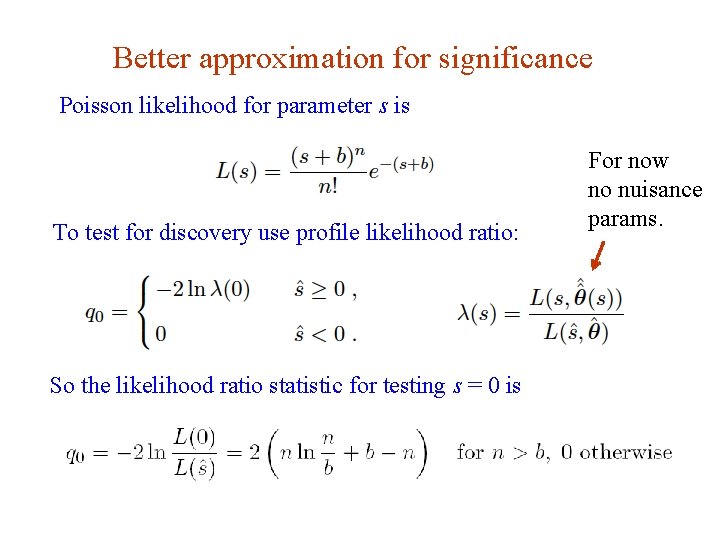
Better approximation for significance Poisson likelihood for parameter s is To test for discovery use profile likelihood ratio: For now no nuisance params. So the likelihood ratio statistic for testing s = 0 is G. Cowan HCPSS 2016 / Statistics Lecture 2 20
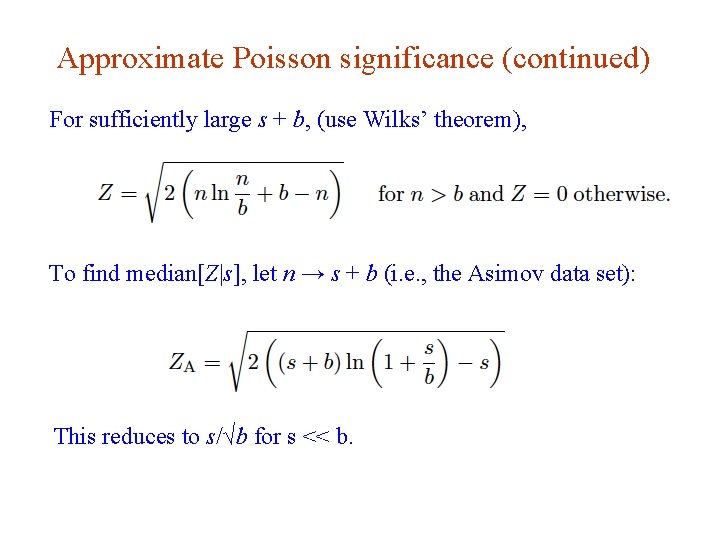
Approximate Poisson significance (continued) For sufficiently large s + b, (use Wilks’ theorem), To find median[Z|s], let n → s + b (i. e. , the Asimov data set): This reduces to s/√b for s << b. G. Cowan HCPSS 2016 / Statistics Lecture 2 21
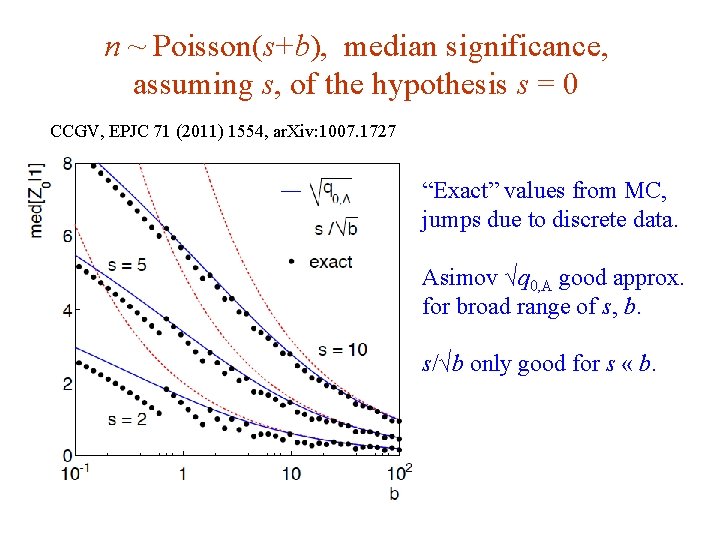
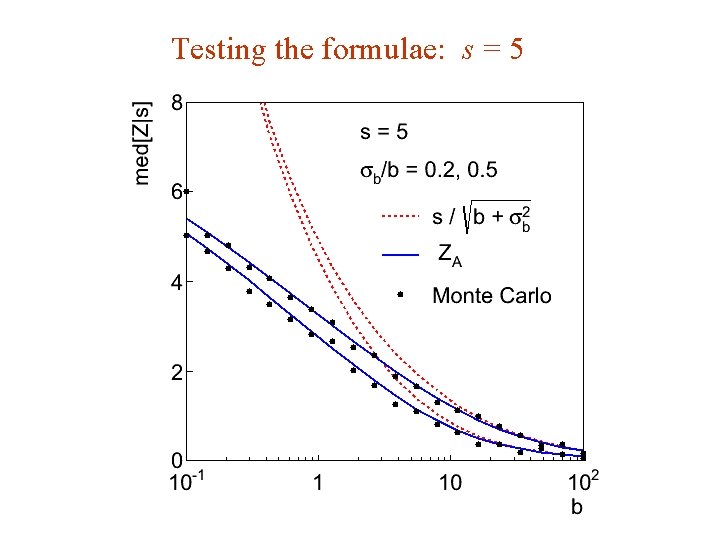
n ~ Poisson(s+b), median significance, assuming s, of the hypothesis s = 0 CCGV, EPJC 71 (2011) 1554, ar. Xiv: 1007. 1727 “Exact” values from MC, jumps due to discrete data. Asimov √q 0, A good approx. for broad range of s, b. s/√b only good for s « b. G. Cowan HCPSS 2016 / Statistics Lecture 2 22
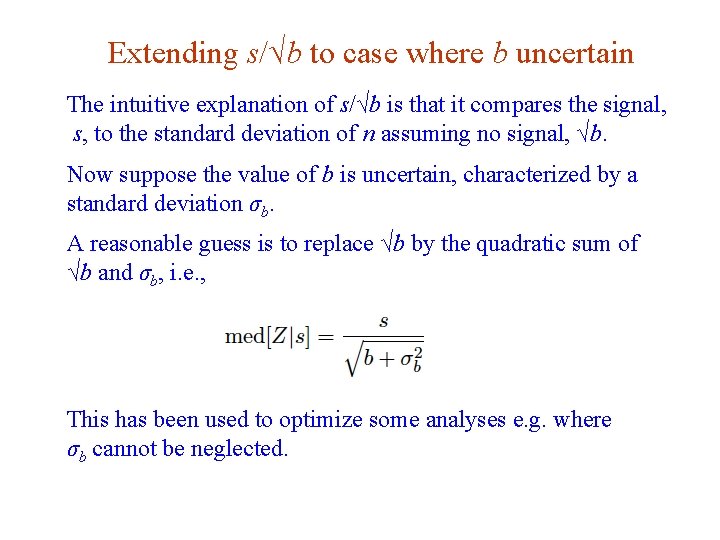
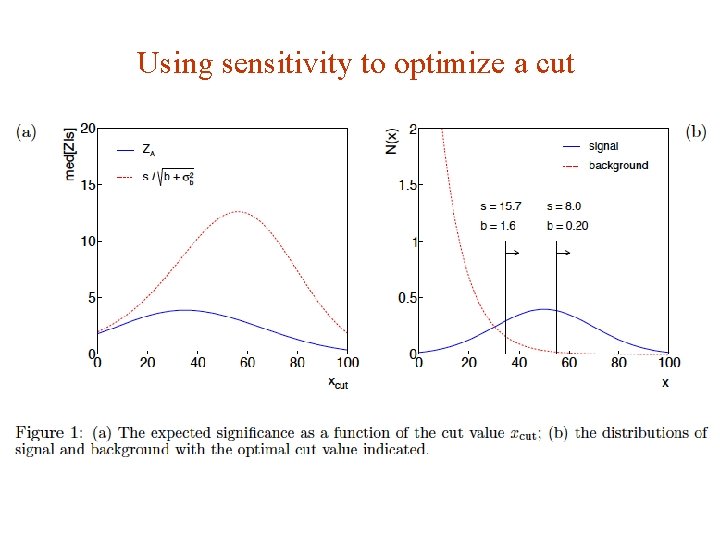
Extending s/√b to case where b uncertain The intuitive explanation of s/√b is that it compares the signal, s, to the standard deviation of n assuming no signal, √b. Now suppose the value of b is uncertain, characterized by a standard deviation σb. A reasonable guess is to replace √b by the quadratic sum of √b and σb, i. e. , This has been used to optimize some analyses e. g. where σb cannot be neglected. G. Cowan HCPSS 2016 / Statistics Lecture 2 23
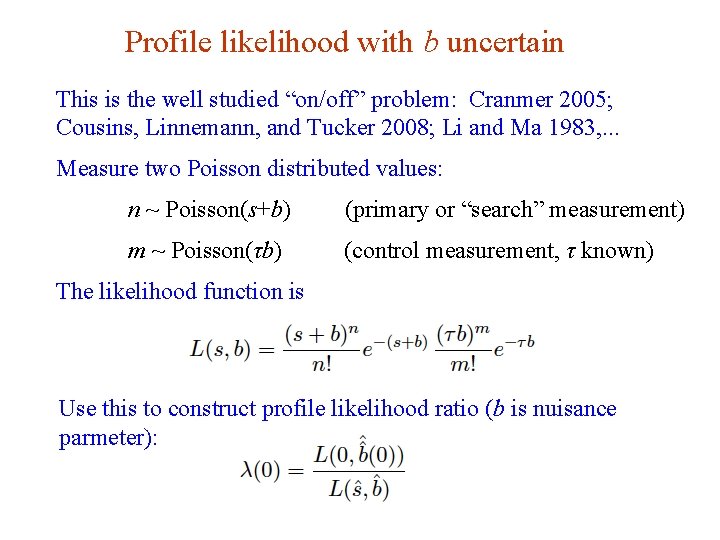
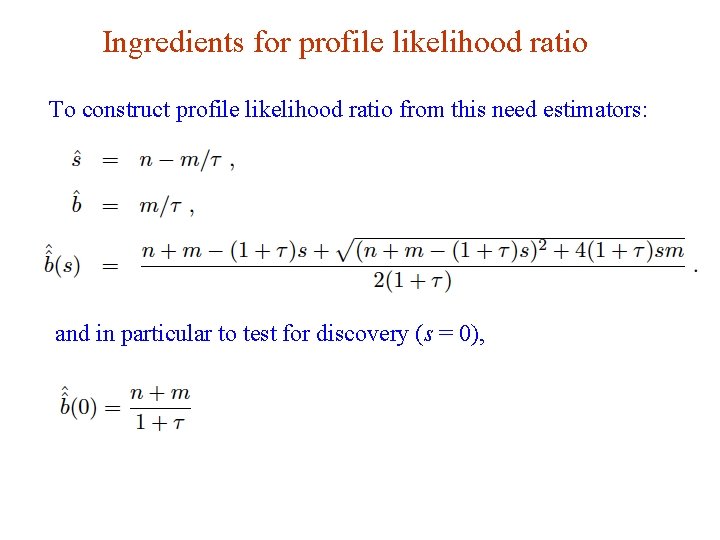
Profile likelihood with b uncertain This is the well studied “on/off” problem: Cranmer 2005; Cousins, Linnemann, and Tucker 2008; Li and Ma 1983, . . . Measure two Poisson distributed values: n ~ Poisson(s+b) (primary or “search” measurement) m ~ Poisson(τb) (control measurement, τ known) The likelihood function is Use this to construct profile likelihood ratio (b is nuisance parmeter): G. Cowan HCPSS 2016 / Statistics Lecture 2 24
Ingredients for profile likelihood ratio To construct profile likelihood ratio from this need estimators: and in particular to test for discovery (s = 0), G. Cowan HCPSS 2016 / Statistics Lecture 2 25
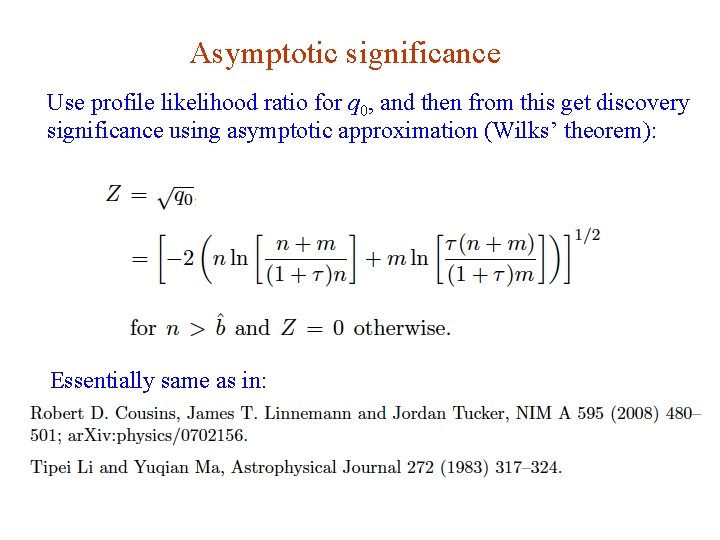
Asymptotic significance Use profile likelihood ratio for q 0, and then from this get discovery significance using asymptotic approximation (Wilks’ theorem): Essentially same as in: G. Cowan HCPSS 2016 / Statistics Lecture 2 26
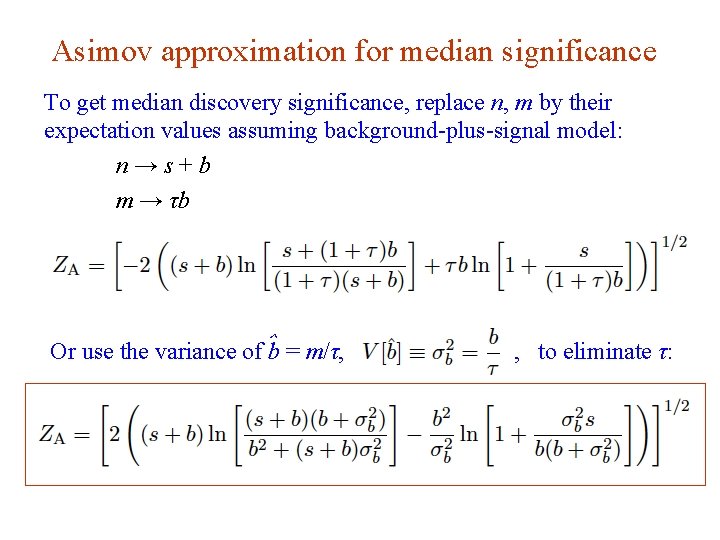
Asimov approximation for median significance To get median discovery significance, replace n, m by their expectation values assuming background-plus-signal model: n→s+b m → τb Or use the variance of ˆb = m/τ, G. Cowan HCPSS 2016 / Statistics Lecture 2 , to eliminate τ: 27
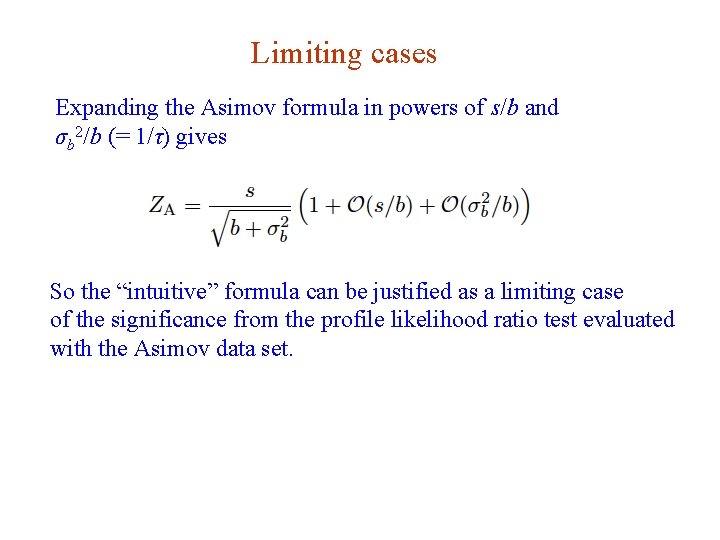
Limiting cases Expanding the Asimov formula in powers of s/b and σb 2/b (= 1/τ) gives So the “intuitive” formula can be justified as a limiting case of the significance from the profile likelihood ratio test evaluated with the Asimov data set. G. Cowan HCPSS 2016 / Statistics Lecture 2 28
Testing the formulae: s = 5 G. Cowan HCPSS 2016 / Statistics Lecture 2 29
Using sensitivity to optimize a cut G. Cowan HCPSS 2016 / Statistics Lecture 2 30
Extra slides G. Cowan HCPSS 2016 / Statistics Lecture 2 page 31
Resources on multivariate methods C. M. Bishop, Pattern Recognition and Machine Learning, Springer, 2006 T. Hastie, R. Tibshirani, J. Friedman, The Elements of Statistical Learning, 2 nd ed. , Springer, 2009 R. Duda, P. Hart, D. Stork, Pattern Classification, 2 nd ed. , Wiley, 2001 A. Webb, Statistical Pattern Recognition, 2 nd ed. , Wiley, 2002. Ilya Narsky and Frank C. Porter, Statistical Analysis Techniques in Particle Physics, Wiley, 2014. 朱永生 (�著),��数据多元��分析, 科学出版社, 北 京,2009。 G. Cowan HCPSS 2016 / Statistics Lecture 2 32
Software Rapidly growing area of development – two important resources: TMVA, Höcker, Stelzer, Tegenfeldt, Voss, physics/0703039 From tmva. sourceforge. net, also distributed with ROOT Variety of classifiers Good manual, widely used in HEP scikit-learn Python-based tools for Machine Learning scikit-learn. org Large user community G. Cowan HCPSS 2016 / Statistics Lecture 2 33
A simulated SUSY event in ATLAS high p. T jets of hadrons high p. T muons p p missing transverse energy G. Cowan HCPSS 2016 / Statistics Lecture 2 page 34
Background events This event from Standard Model ttbar production also has high p. T jets and muons, and some missing transverse energy. → can easily mimic a SUSY event. G. Cowan HCPSS 2016 / Statistics Lecture 2 page 35
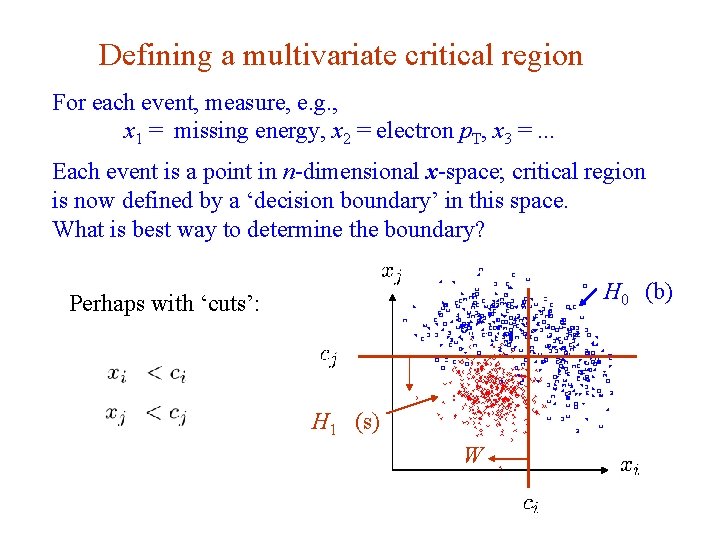
Defining a multivariate critical region For each event, measure, e. g. , x 1 = missing energy, x 2 = electron p. T, x 3 =. . . Each event is a point in n-dimensional x-space; critical region is now defined by a ‘decision boundary’ in this space. What is best way to determine the boundary? H 0 (b) Perhaps with ‘cuts’: H 1 (s) W G. Cowan HCPSS 2016 / Statistics Lecture 2 36
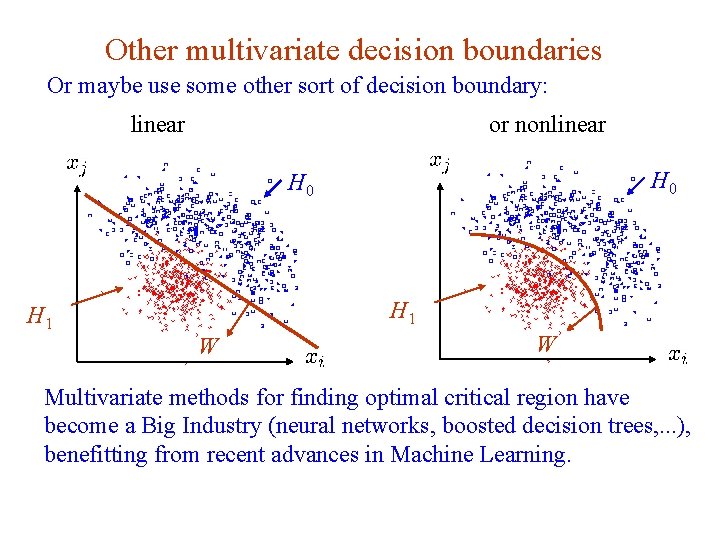
Other multivariate decision boundaries Or maybe use some other sort of decision boundary: linear or nonlinear H 0 H 1 W W Multivariate methods for finding optimal critical region have become a Big Industry (neural networks, boosted decision trees, . . . ), benefitting from recent advances in Machine Learning. G. Cowan HCPSS 2016 / Statistics Lecture 2 37
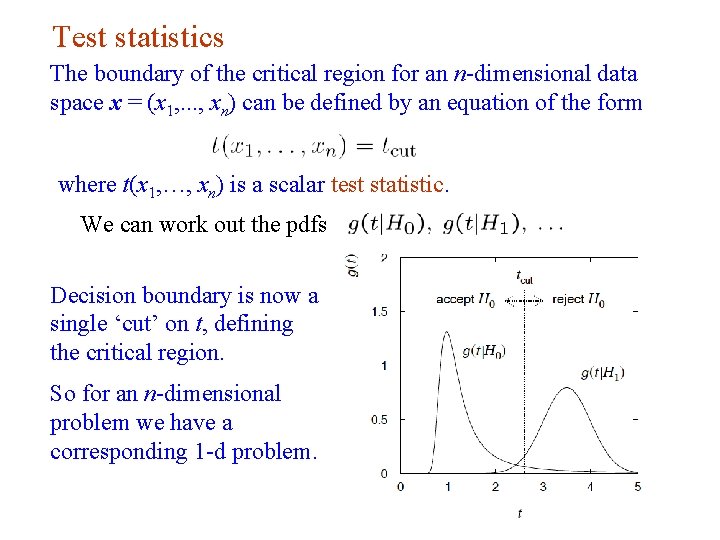
Test statistics The boundary of the critical region for an n-dimensional data space x = (x 1, . . . , xn) can be defined by an equation of the form where t(x 1, …, xn) is a scalar test statistic. We can work out the pdfs Decision boundary is now a single ‘cut’ on t, defining the critical region. So for an n-dimensional problem we have a corresponding 1 -d problem. G. Cowan HCPSS 2016 / Statistics Lecture 2 38
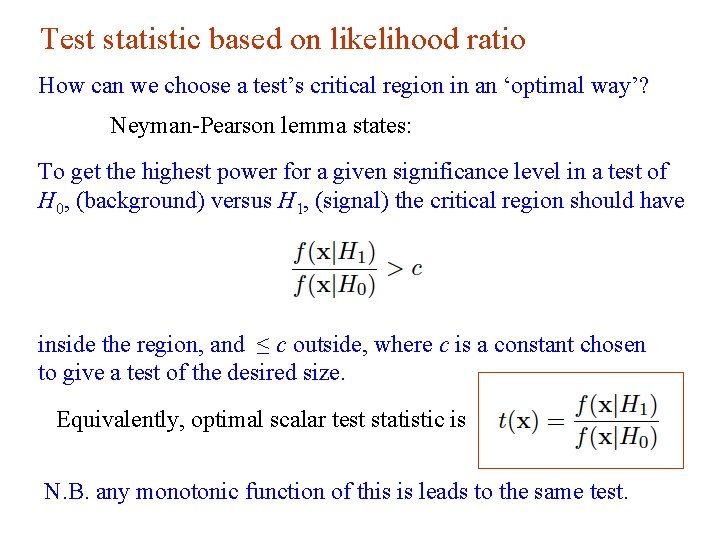
Test statistic based on likelihood ratio How can we choose a test’s critical region in an ‘optimal way’? Neyman-Pearson lemma states: To get the highest power for a given significance level in a test of H 0, (background) versus H 1, (signal) the critical region should have inside the region, and ≤ c outside, where c is a constant chosen to give a test of the desired size. Equivalently, optimal scalar test statistic is N. B. any monotonic function of this is leads to the same test. G. Cowan HCPSS 2016 / Statistics Lecture 2 39
Neyman-Pearson doesn’t usually help We usually don’t have explicit formulae for the pdfs f (x|s), f (x|b), so for a given x we can’t evaluate the likelihood ratio Instead we may have Monte Carlo models for signal and background processes, so we can produce simulated data: generate x ~ f (x|s) → x 1, . . . , x. N generate x ~ f (x|b) → x 1, . . . , x. N This gives samples of “training data” with events of known type. Can be expensive (1 fully simulated LHC event ~ 1 CPU minute). G. Cowan HCPSS 2016 / Statistics Lecture 2 40
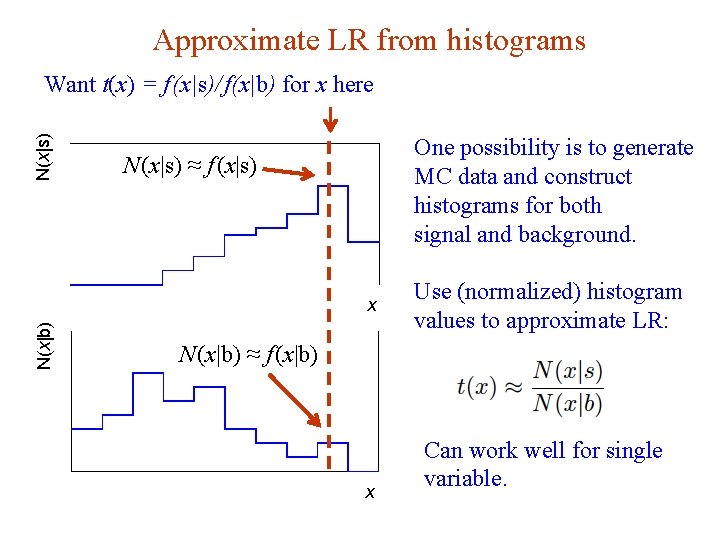
Approximate LR from histograms N(x|s) Want t(x) = f (x|s)/ f(x|b) for x here One possibility is to generate MC data and construct histograms for both signal and background. N (x|s) ≈ f (x|s) N(x|b) x N (x|b) ≈ f (x|b) x G. Cowan Use (normalized) histogram values to approximate LR: Can work well for single variable. HCPSS 2016 / Statistics Lecture 2 41
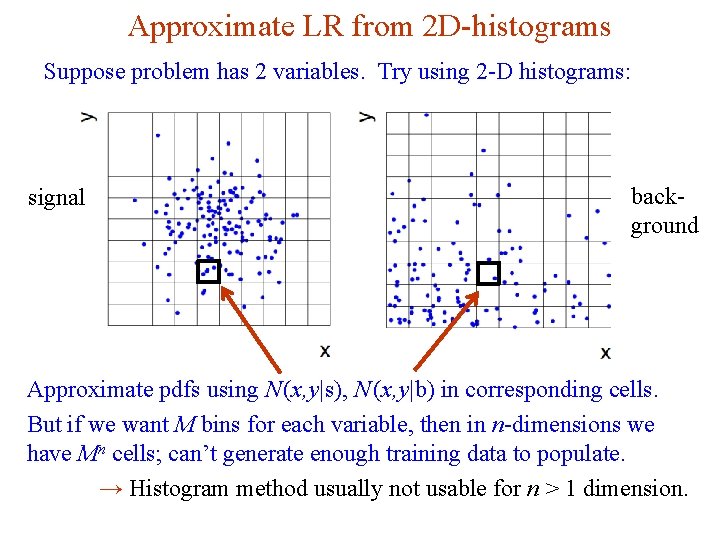
Approximate LR from 2 D-histograms Suppose problem has 2 variables. Try using 2 -D histograms: background signal Approximate pdfs using N (x, y|s), N (x, y|b) in corresponding cells. But if we want M bins for each variable, then in n-dimensions we have Mn cells; can’t generate enough training data to populate. → Histogram method usually not usable for n > 1 dimension. G. Cowan HCPSS 2016 / Statistics Lecture 2 42
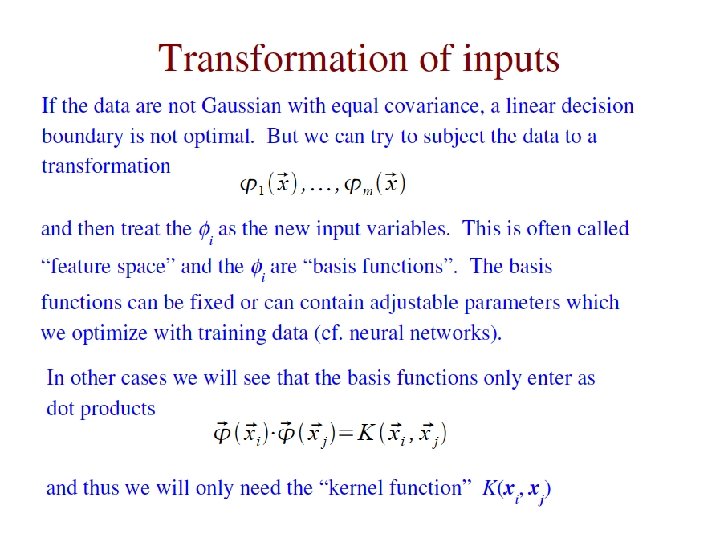
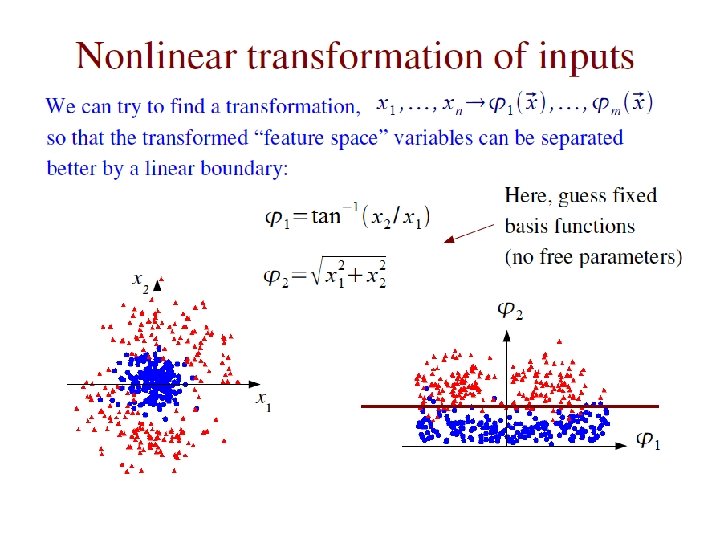
Strategies for multivariate analysis Neyman-Pearson lemma gives optimal answer, but cannot be used directly, because we usually don’t have f (x|s), f (x|b). Histogram method with M bins for n variables requires that we estimate Mn parameters (the values of the pdfs in each cell), so this is rarely practical. A compromise solution is to assume a certain functional form for the test statistic t (x) with fewer parameters; determine them (using MC) to give best separation between signal and background. Alternatively, try to estimate the probability densities f (x|s) and f (x|b) (with something better than histograms) and use the estimated pdfs to construct an approximate likelihood ratio. G. Cowan HCPSS 2016 / Statistics Lecture 2 43
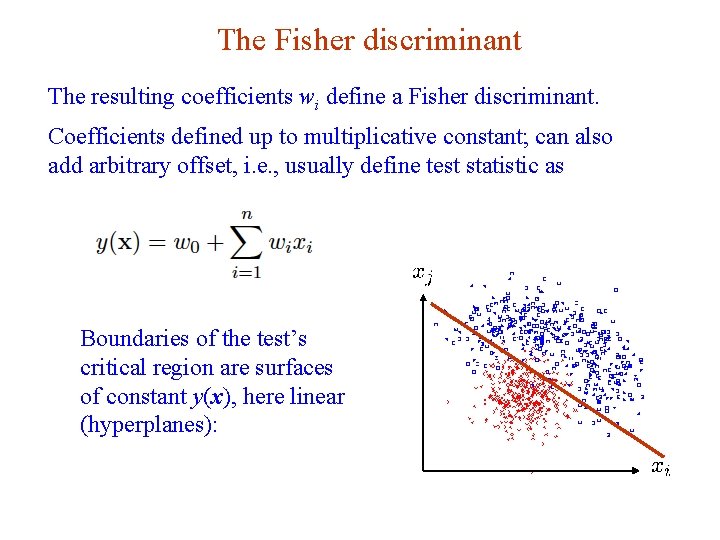
Linear test statistic Suppose there are n input variables: x = (x 1, . . . , xn). Consider a linear function: For a given choice of the coefficients w = (w 1, . . . , wn) we will get pdfs f (y|s) and f (y|b) : G. Cowan HCPSS 2016 / Statistics Lecture 2 44
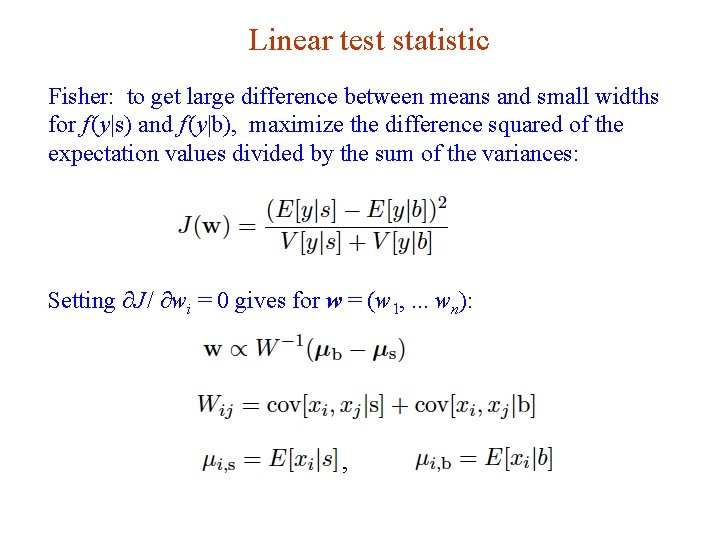
Linear test statistic Fisher: to get large difference between means and small widths for f (y|s) and f (y|b), maximize the difference squared of the expectation values divided by the sum of the variances: Setting ∂J / ∂wi = 0 gives for w = (w 1, . . . wn): , G. Cowan HCPSS 2016 / Statistics Lecture 2 45
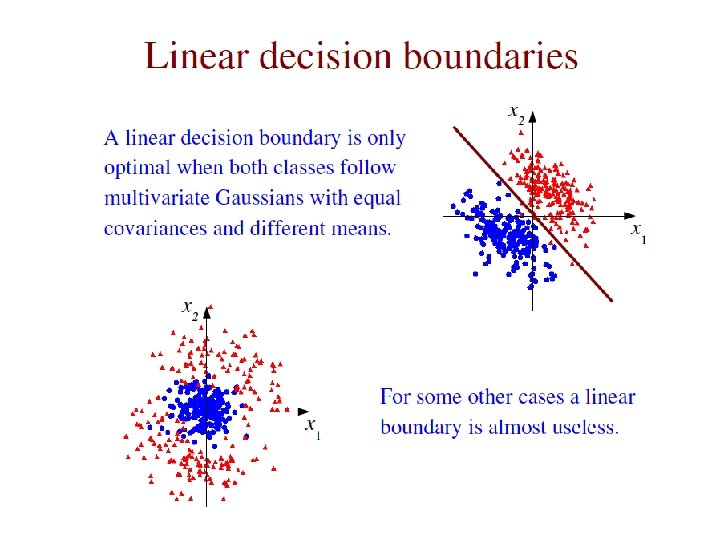
The Fisher discriminant The resulting coefficients wi define a Fisher discriminant. Coefficients defined up to multiplicative constant; can also add arbitrary offset, i. e. , usually define test statistic as Boundaries of the test’s critical region are surfaces of constant y(x), here linear (hyperplanes): G. Cowan HCPSS 2016 / Statistics Lecture 2 46
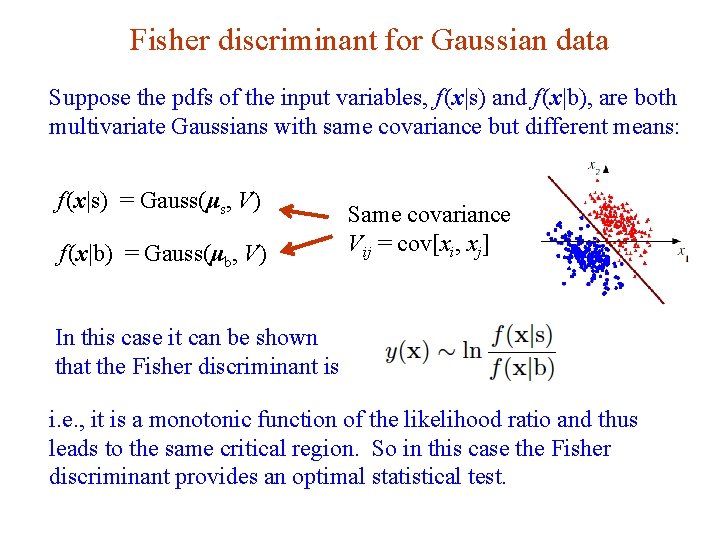
Fisher discriminant for Gaussian data Suppose the pdfs of the input variables, f (x|s) and f (x|b), are both multivariate Gaussians with same covariance but different means: f (x|s) = Gauss(μs, V) Same covariance Vij = cov[xi, xj] f (x|b) = Gauss(μb, V) In this case it can be shown that the Fisher discriminant is i. e. , it is a monotonic function of the likelihood ratio and thus leads to the same critical region. So in this case the Fisher discriminant provides an optimal statistical test. G. Cowan HCPSS 2016 / Statistics Lecture 2 47
G. Cowan HCPSS 2016 / Statistics Lecture 2 48
G. Cowan HCPSS 2016 / Statistics Lecture 2 49
G. Cowan HCPSS 2016 / Statistics Lecture 2 50
G. Cowan HCPSS 2016 / Statistics Lecture 2 51
G. Cowan HCPSS 2016 / Statistics Lecture 2 52
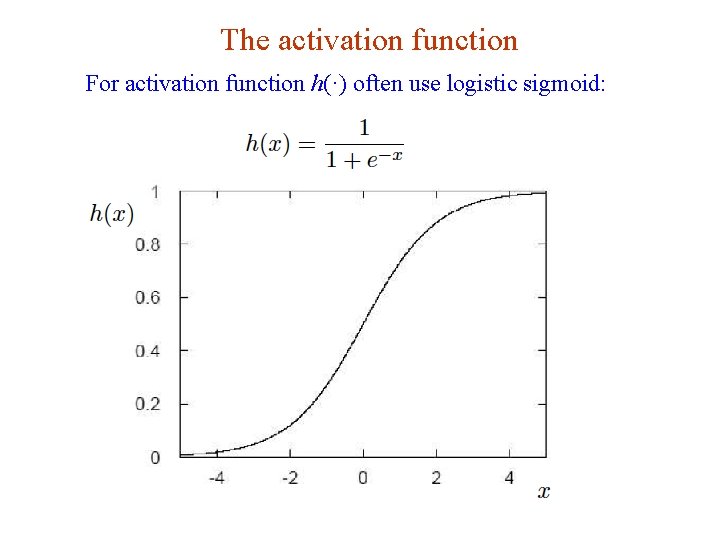
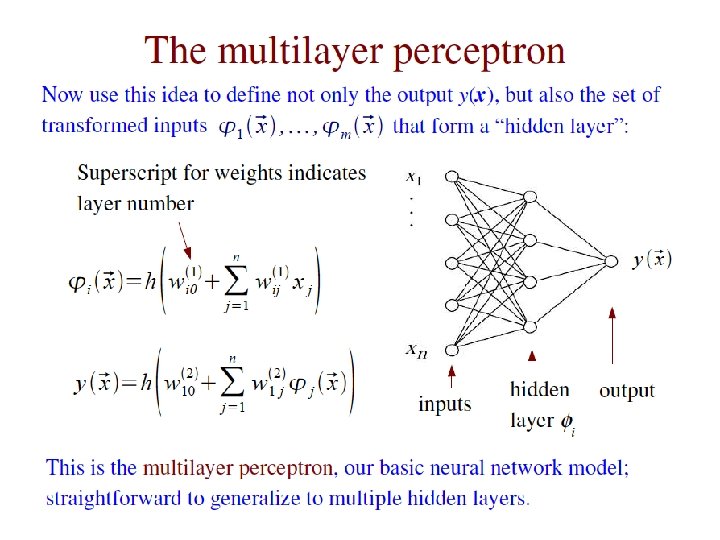
The activation function For activation function h(·) often use logistic sigmoid: G. Cowan HCPSS 2016 / Statistics Lecture 2 53
G. Cowan HCPSS 2016 / Statistics Lecture 2 54
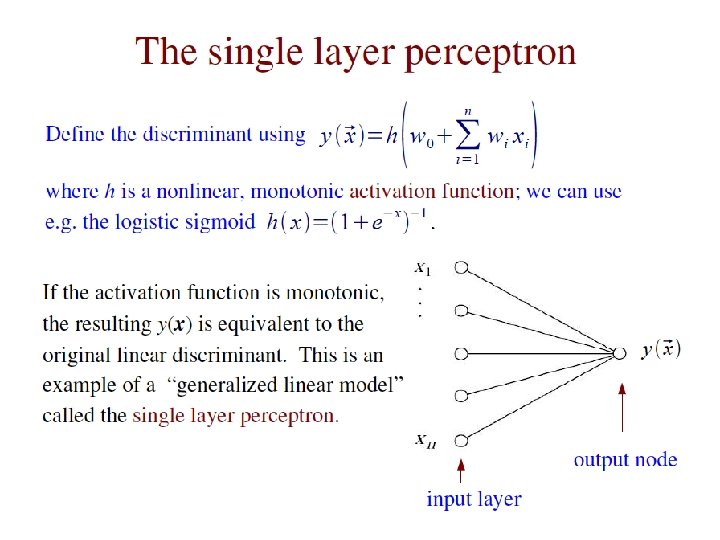
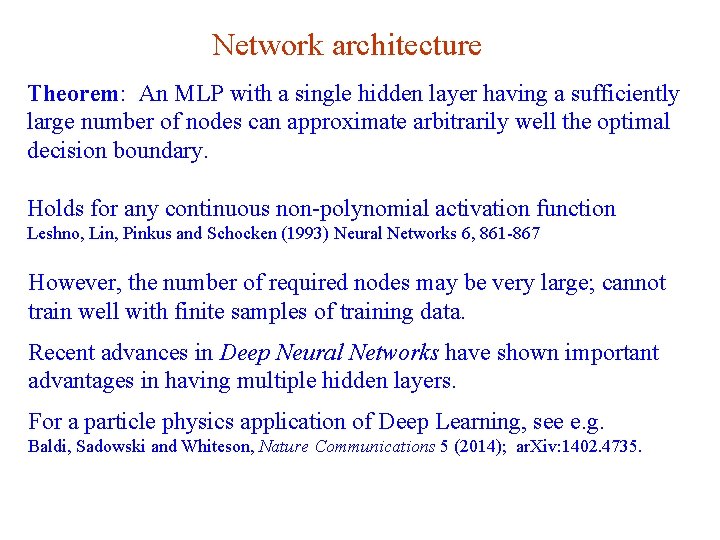
Network architecture Theorem: An MLP with a single hidden layer having a sufficiently large number of nodes can approximate arbitrarily well the optimal decision boundary. Holds for any continuous non-polynomial activation function Leshno, Lin, Pinkus and Schocken (1993) Neural Networks 6, 861 -867 However, the number of required nodes may be very large; cannot train well with finite samples of training data. Recent advances in Deep Neural Networks have shown important advantages in having multiple hidden layers. For a particle physics application of Deep Learning, see e. g. Baldi, Sadowski and Whiteson, Nature Communications 5 (2014); ar. Xiv: 1402. 4735. G. Cowan HCPSS 2016 / Statistics Lecture 2 55
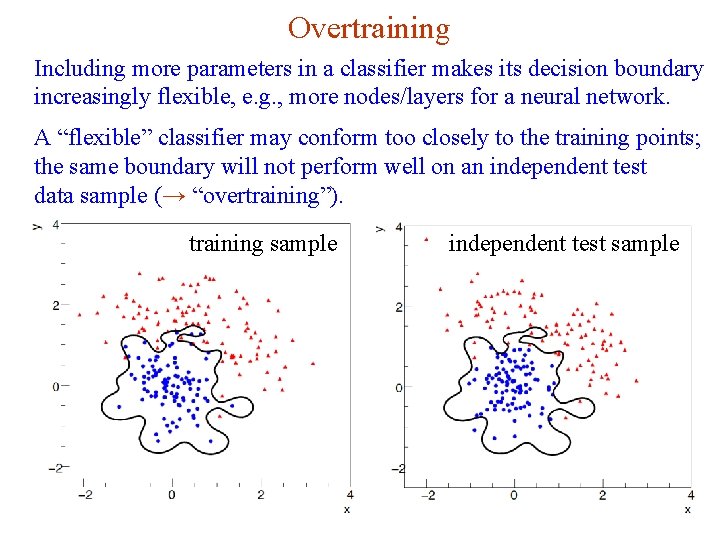
Overtraining Including more parameters in a classifier makes its decision boundary increasingly flexible, e. g. , more nodes/layers for a neural network. A “flexible” classifier may conform too closely to the training points; the same boundary will not perform well on an independent test data sample (→ “overtraining”). training sample G. Cowan independent test sample HCPSS 2016 / Statistics Lecture 2 56
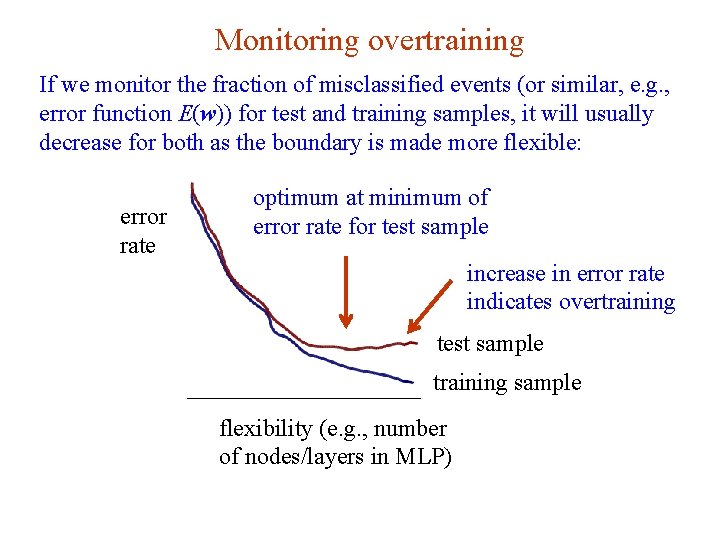
Monitoring overtraining If we monitor the fraction of misclassified events (or similar, e. g. , error function E(w)) for test and training samples, it will usually decrease for both as the boundary is made more flexible: error rate optimum at minimum of error rate for test sample increase in error rate indicates overtraining test sample training sample flexibility (e. g. , number of nodes/layers in MLP) G. Cowan HCPSS 2016 / Statistics Lecture 2 57
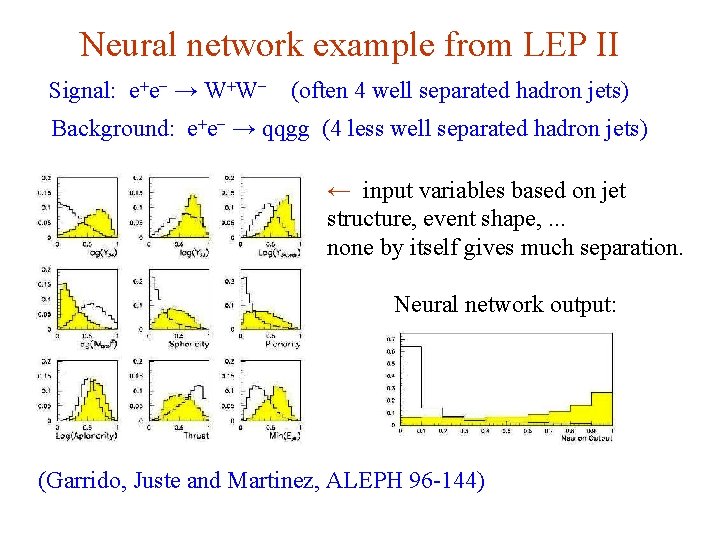
Neural network example from LEP II Signal: e+e- → W+W- (often 4 well separated hadron jets) Background: e+e- → qqgg (4 less well separated hadron jets) ← input variables based on jet structure, event shape, . . . none by itself gives much separation. Neural network output: (Garrido, Juste and Martinez, ALEPH 96 -144) G. Cowan HCPSS 2016 / Statistics Lecture 2 page 58
Summary on multivariate methods Particle physics has used several multivariate methods for many years: linear (Fisher) discriminant neural networks naive Bayes and has in recent years started to use a few more: boosted decision trees support vector machines kernel density estimation k-nearest neighbour The emphasis is often on controlling systematic uncertainties between the modeled training data and Nature to avoid false discovery. Although many classifier outputs are "black boxes", a discovery at 5σ significance with a sophisticated (opaque) method will win the competition if backed up by, say, 4σ evidence from a cut-based method. G. Cowan HCPSS 2016 / Statistics Lecture 2 page 59
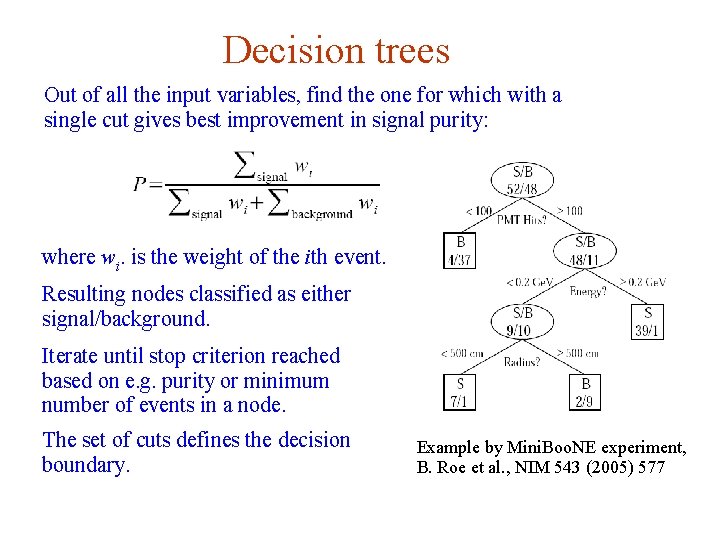
Particle i. d. in Mini. Boo. NE Detector is a 12 -m diameter tank of mineral oil exposed to a beam of neutrinos and viewed by 1520 photomultiplier tubes: Search for ν μ to ν e oscillations required particle i. d. using information from the PMTs. G. Cowan H. J. Yang, Mini. Boo. NE PID, DNP 06 HCPSS 2016 / Statistics Lecture 2 page 60
Decision trees Out of all the input variables, find the one for which with a single cut gives best improvement in signal purity: where wi. is the weight of the ith event. Resulting nodes classified as either signal/background. Iterate until stop criterion reached based on e. g. purity or minimum number of events in a node. The set of cuts defines the decision boundary. G. Cowan Example by Mini. Boo. NE experiment, B. Roe et al. , NIM 543 (2005) 577 HCPSS 2016 / Statistics Lecture 2 page 61
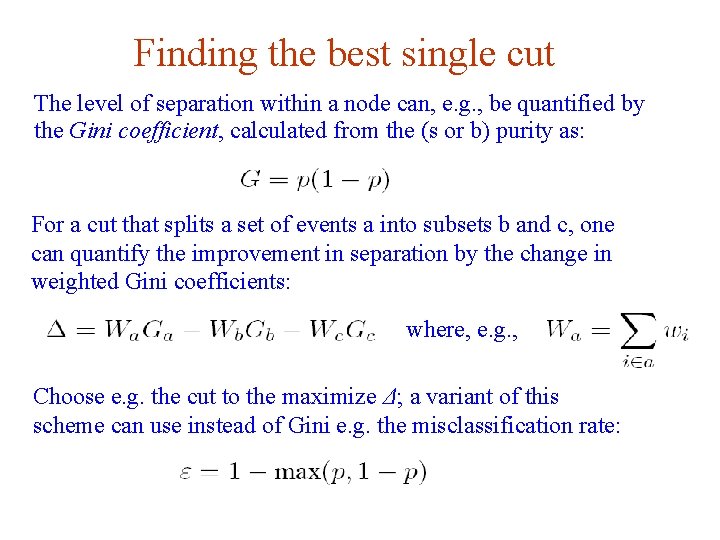
Finding the best single cut The level of separation within a node can, e. g. , be quantified by the Gini coefficient, calculated from the (s or b) purity as: For a cut that splits a set of events a into subsets b and c, one can quantify the improvement in separation by the change in weighted Gini coefficients: where, e. g. , Choose e. g. the cut to the maximize Δ; a variant of this scheme can use instead of Gini e. g. the misclassification rate: G. Cowan HCPSS 2016 / Statistics Lecture 2 page 62
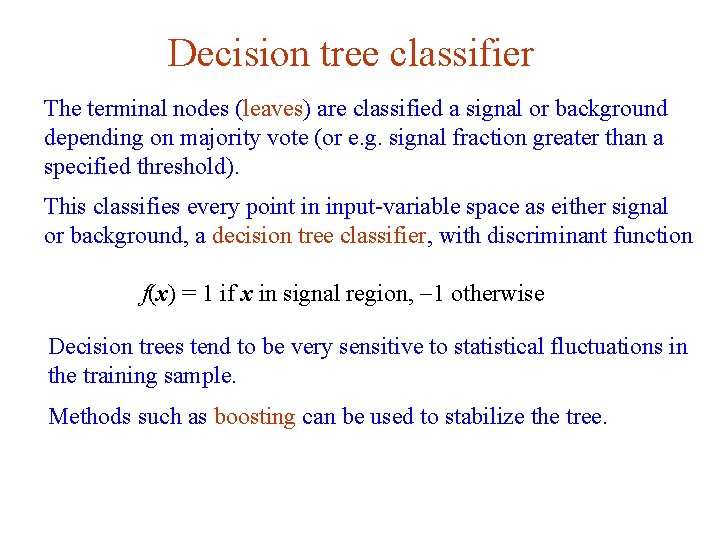
Decision tree classifier The terminal nodes (leaves) are classified a signal or background depending on majority vote (or e. g. signal fraction greater than a specified threshold). This classifies every point in input-variable space as either signal or background, a decision tree classifier, with discriminant function f(x) = 1 if x in signal region, -1 otherwise Decision trees tend to be very sensitive to statistical fluctuations in the training sample. Methods such as boosting can be used to stabilize the tree. G. Cowan HCPSS 2016 / Statistics Lecture 2 page 63
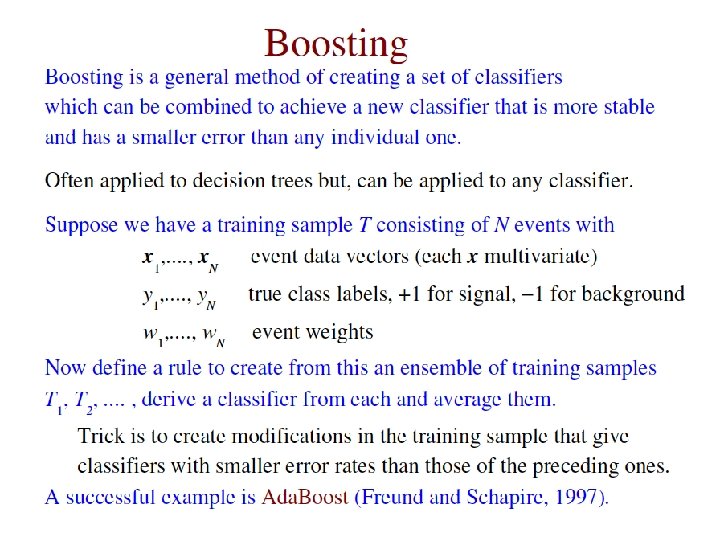
G. Cowan HCPSS 2016 / Statistics Lecture 2 page 64
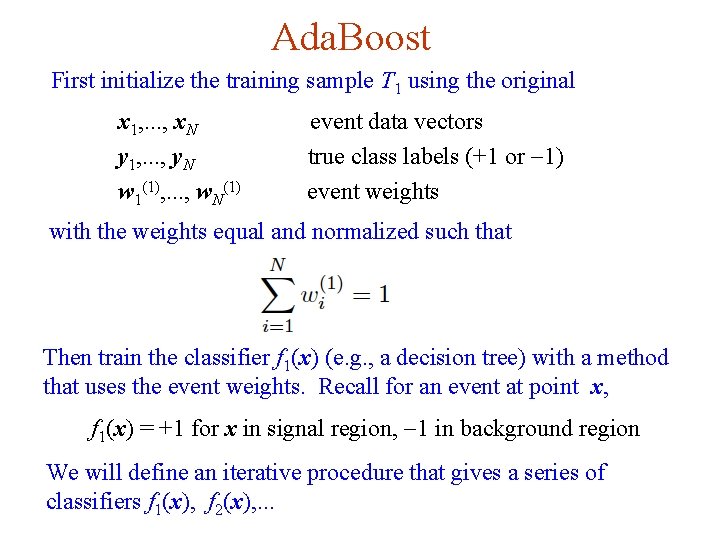
Ada. Boost First initialize the training sample T 1 using the original x 1, . . . , x. N y 1, . . . , y. N w 1(1), . . . , w. N(1) event data vectors true class labels (+1 or -1) event weights with the weights equal and normalized such that Then train the classifier f 1(x) (e. g. , a decision tree) with a method that uses the event weights. Recall for an event at point x, f 1(x) = +1 for x in signal region, -1 in background region We will define an iterative procedure that gives a series of classifiers f 1(x), f 2(x), . . . G. Cowan HCPSS 2016 / Statistics Lecture 2 page 65
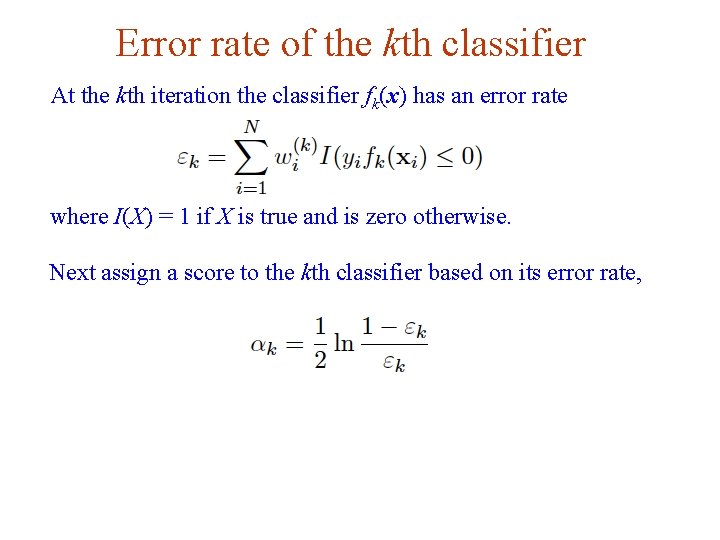
Error rate of the kth classifier At the kth iteration the classifier fk(x) has an error rate where I(X) = 1 if X is true and is zero otherwise. Next assign a score to the kth classifier based on its error rate, G. Cowan HCPSS 2016 / Statistics Lecture 2 page 66
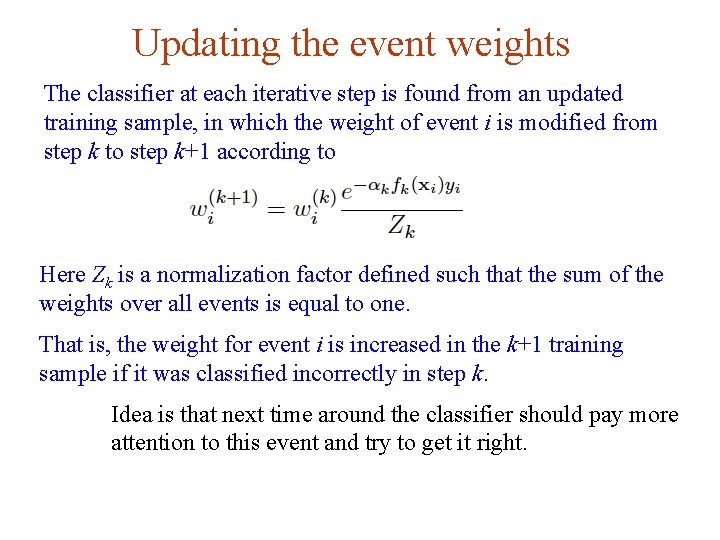
Updating the event weights The classifier at each iterative step is found from an updated training sample, in which the weight of event i is modified from step k to step k+1 according to Here Zk is a normalization factor defined such that the sum of the weights over all events is equal to one. That is, the weight for event i is increased in the k+1 training sample if it was classified incorrectly in step k. Idea is that next time around the classifier should pay more attention to this event and try to get it right. G. Cowan HCPSS 2016 / Statistics Lecture 2 page 67
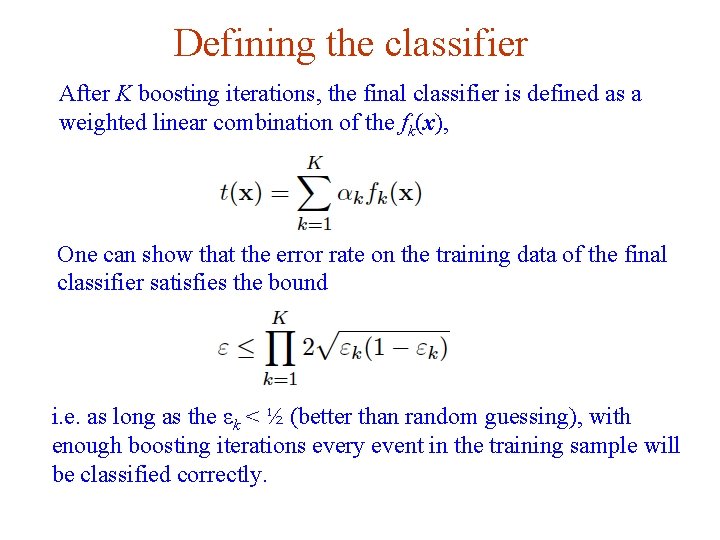
Defining the classifier After K boosting iterations, the final classifier is defined as a weighted linear combination of the fk(x), One can show that the error rate on the training data of the final classifier satisfies the bound i. e. as long as the εk < ½ (better than random guessing), with enough boosting iterations every event in the training sample will be classified correctly. G. Cowan HCPSS 2016 / Statistics Lecture 2 page 68
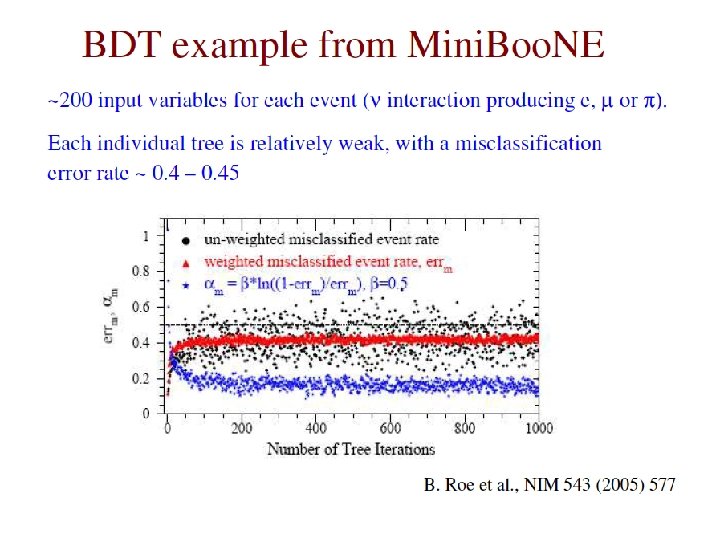
G. Cowan HCPSS 2016 / Statistics Lecture 2 page 69
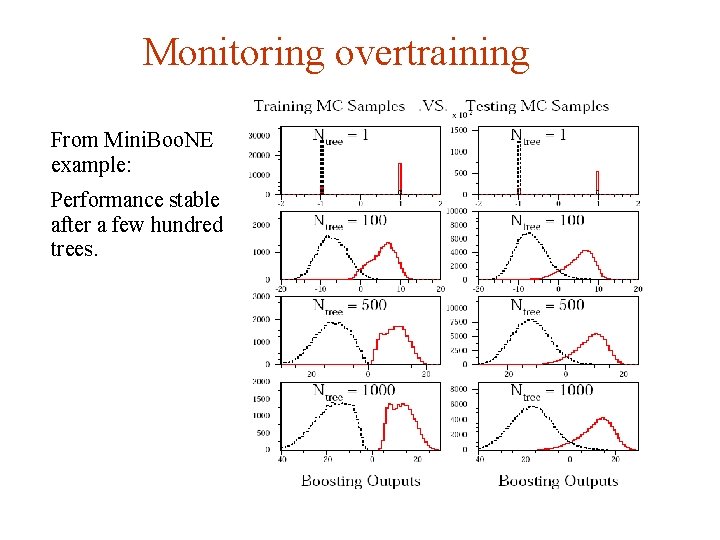
Monitoring overtraining From Mini. Boo. NE example: Performance stable after a few hundred trees. G. Cowan HCPSS 2016 / Statistics Lecture 2 page 70
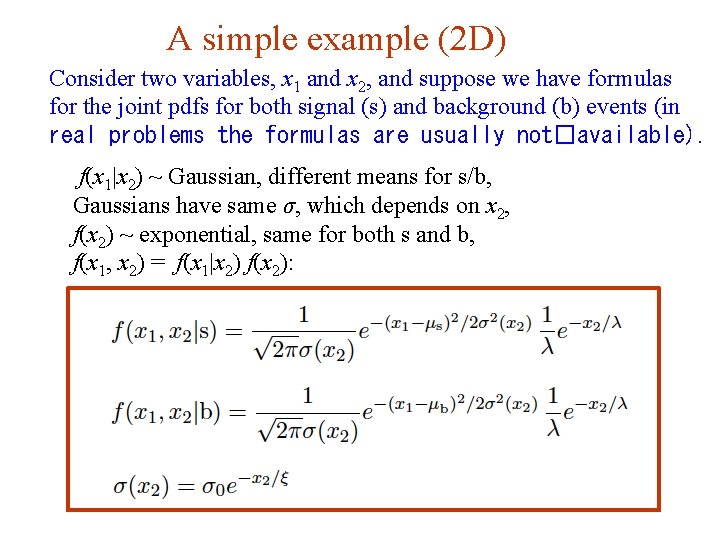
A simple example (2 D) Consider two variables, x 1 and x 2, and suppose we have formulas for the joint pdfs for both signal (s) and background (b) events (in real problems the formulas are usually not�available). f(x 1|x 2) ~ Gaussian, different means for s/b, Gaussians have same σ, which depends on x 2, f(x 2) ~ exponential, same for both s and b, f(x 1, x 2) = f(x 1|x 2) f(x 2): G. Cowan HCPSS 2016 / Statistics Lecture 2 page 71
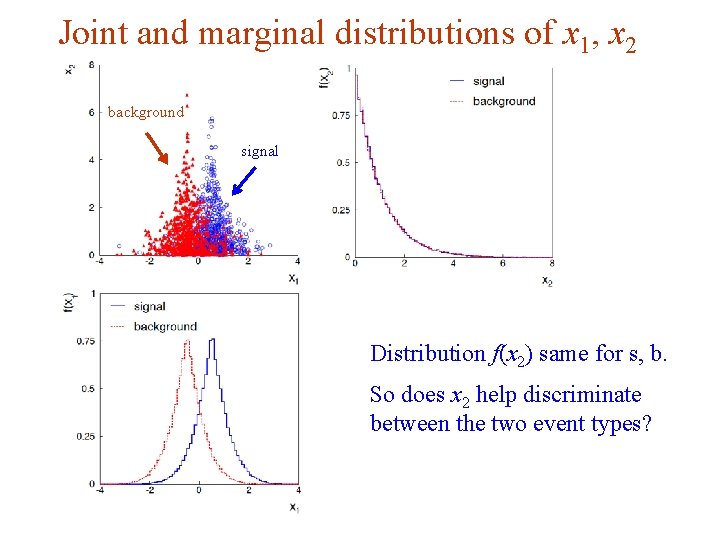
Joint and marginal distributions of x 1, x 2 background signal Distribution f(x 2) same for s, b. So does x 2 help discriminate between the two event types? G. Cowan HCPSS 2016 / Statistics Lecture 2 page 72
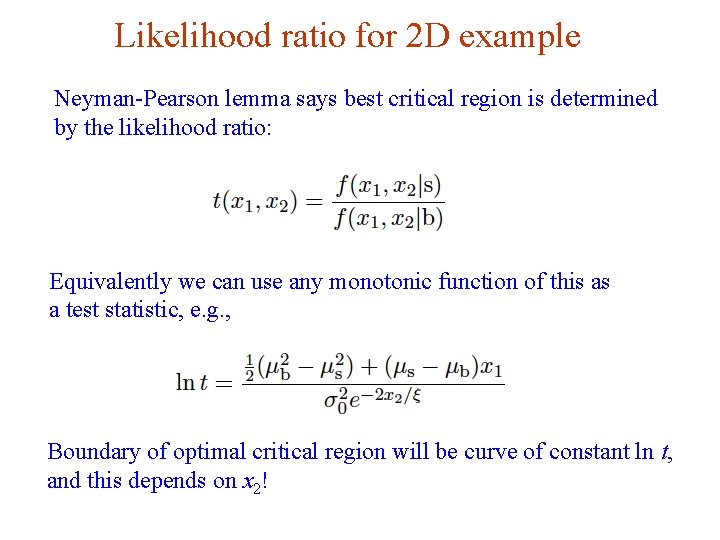
Likelihood ratio for 2 D example Neyman-Pearson lemma says best critical region is determined by the likelihood ratio: Equivalently we can use any monotonic function of this as a test statistic, e. g. , Boundary of optimal critical region will be curve of constant ln t, and this depends on x 2! G. Cowan HCPSS 2016 / Statistics Lecture 2 page 73
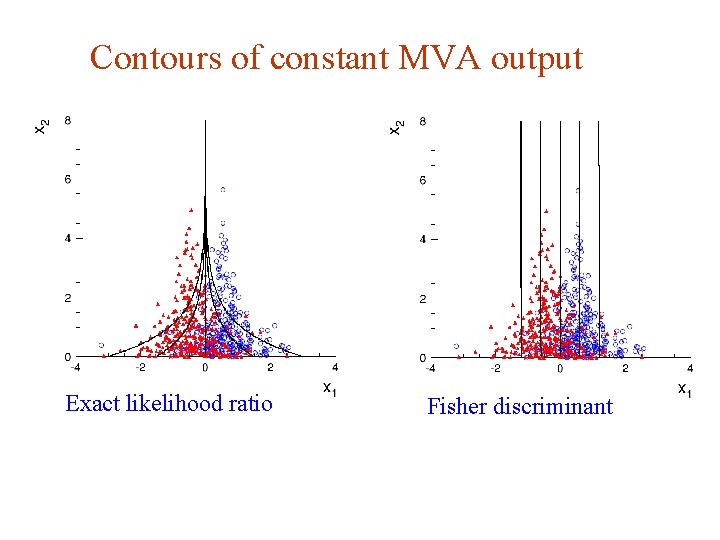
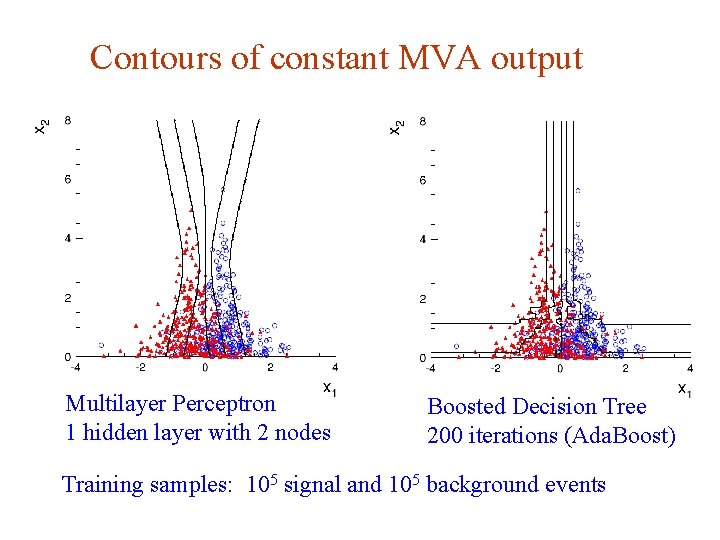
Contours of constant MVA output Exact likelihood ratio G. Cowan Fisher discriminant HCPSS 2016 / Statistics Lecture 2 page 74
Contours of constant MVA output Multilayer Perceptron 1 hidden layer with 2 nodes Boosted Decision Tree 200 iterations (Ada. Boost) Training samples: 105 signal and 105 background events G. Cowan HCPSS 2016 / Statistics Lecture 2 page 75
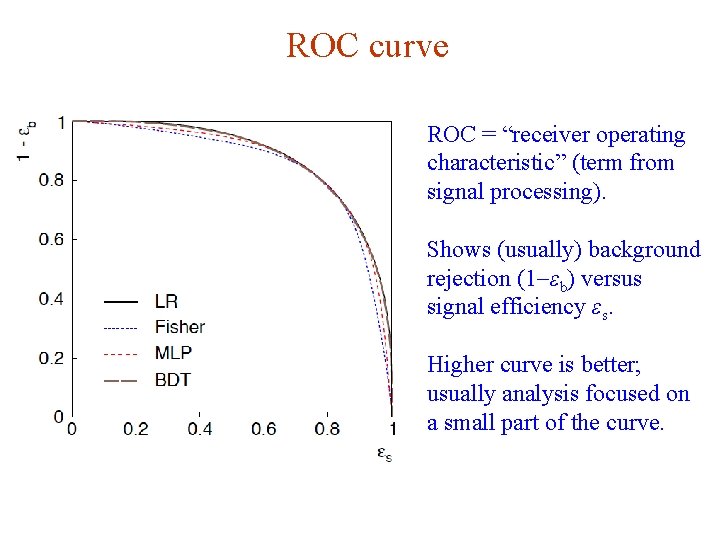
ROC curve ROC = “receiver operating characteristic” (term from signal processing). Shows (usually) background rejection (1 -εb) versus signal efficiency εs. Higher curve is better; usually analysis focused on a small part of the curve. G. Cowan HCPSS 2016 / Statistics Lecture 2 page 76
2 D Example: discussion Even though the distribution of x 2 is same for signal and background, x 1 and x 2 are not independent, so using x 2 as an input variable helps. Here we can understand why: high values of x 2 correspond to a smaller σ for the Gaussian of x 1. So high x 2 means that the value of x 1 was well measured. If we don’t consider x 2, then all of the x 1 measurements are lumped together. Those with large σ (low x 2) “pollute” the well measured events with low σ (high x 2). Often in HEP there may be variables that are characteristic of how well measured an event is (region of detector, number of pile-up vertices, . . . ). Including these variables in a multivariate analysis preserves the information carried by the well-measured events, leading to improved performance. G. Cowan HCPSS 2016 / Statistics Lecture 2 page 77