Statistical Genomics Lecture 29 BLUP Alphabet Zhiwu Zhang

Statistical Genomics Lecture 29: BLUP Alphabet Zhiwu Zhang Washington State University
 due April 27, Friday, 3: 10 PM Final exam: May")
Administration Homework 6 (last) due April 27, Friday, 3: 10 PM Final exam: May 4 (Friday), 120 minutes (3: 10 -5: 10 PM), 50 questions Party: May 4, Friday, 5: 30 -7: 30, 272 Johnson Hall Course evaluation: 15%

Outline Method comparison c. BLUP s. BLUP Domain of genetic architecture

Genome prediction Based on markers Based on individuals Y 1, Y 2, …, Ythousands §MAS Rex Bernardo Crop Sci, 1994 Kinship §Ridge regression §Bayes (A, B…) Mewwissen et al, Genetics, 2001 among individuals S 1, S 2, …, Smillions Y = Xb + Zu Ys = S 1, + S 2, + …, + S millions 1980~90 s
 rr")
Simulated data (10 CHR, 100 c. M, 1 QTN per half c. M) rr Meuwissen et al. , Genetics 2001

Real data rr
 – Accuracy in German Holstein Friesian data set")
(Habier et al 2011) – Accuracy in German Holstein Friesian data set
")
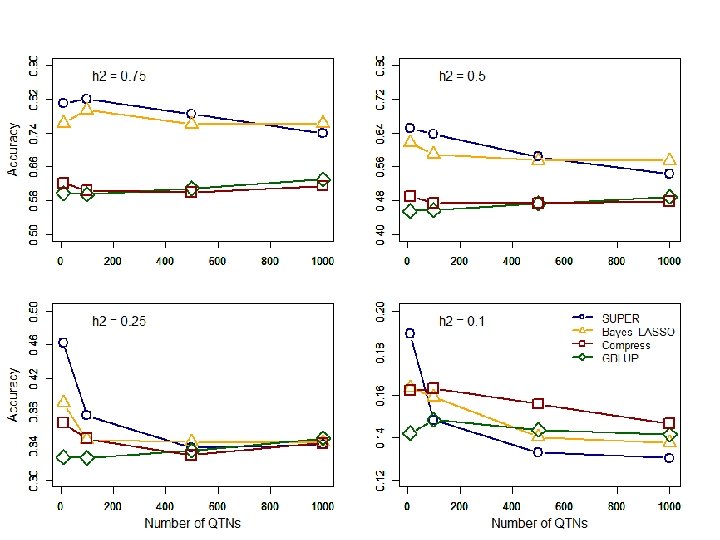
g. BLUP: more QTN, Bayes: less Daetwyler et al. , 2010 Genetics, 185 (3) 1021 -1031

Further development Random rr. BLUP, Bayes A, B, … y=x 1 b 1 + x 2 b 2 + … + xpbp + e U ~N(0, K σa 2) g. BLUP, what else?

Group by kinship 7450 7400 7350 7300 7250 7200 7150 7100 7050 7000 1024 512 256 128 64 32 16 8 4 2 1 6950

Compressed MLM improves power Zhang et al, Nature Genetics, 2010 Average number of individuals per group
 This plot shows the output of the Optimized")
Zhang's method used by JMP (SAS) This plot shows the output of the Optimized K matrix compression algorithm. The mixed model for trait association is fit without the SNP marker in the model at varying levels of K matrix compression (performed by hierarchical clustering of the K matrix between all samples). The resolution of the intervals of K matrix compression/clustering can be controlled by options on the process dialog. At each level, the model is evaluated for performance with metrics such as AIC, AICC, and BIC (smaller values indicate a better fitting model). The plot on the Results tab displays these model performance criteria on the y -axis versus the levels of compression of the K matrix on the x -axis. The optimized compression method (as described by Zhang et al. Nature Genetics. 2010) chooses the level of compression at the minimum value of the chosen metric for the Criterion for Optimal Compression Level parameter. https: //www. jmp. com/support/downloads/JMPG 81_documentation/wwhelp/wwhimpl/js/html/wwhelp. htm#href=genetics 2. 46. 67. html

The base of g. BLUP

Same trend for prediction accuracy Zhengkui Zhou

Same trend for other species Jiabo Wang

SUPER BLUP
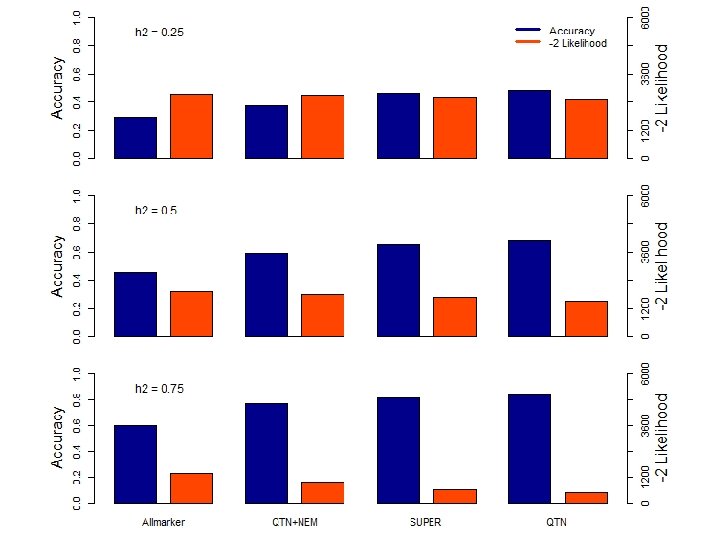

Bins g. BLUP Kinship s. BLUP Markers BLUP alphabet c. BLUP Individual Random effects Group

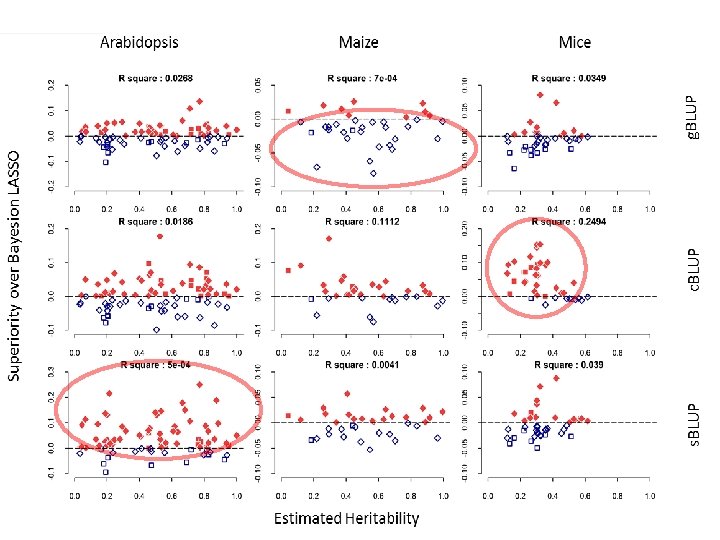
Superiority to Bayess Arabidopsis with s. BLUP Rest Flowering time Estimated heritability

Domains

Computing time

Computing time

Outline Method comparison c. BLUP s. BLUP Domain of genetic architecture
- Slides: 26