Statistical Analysis of Research Results Skewed Distributions Types

Statistical Analysis of Research Results
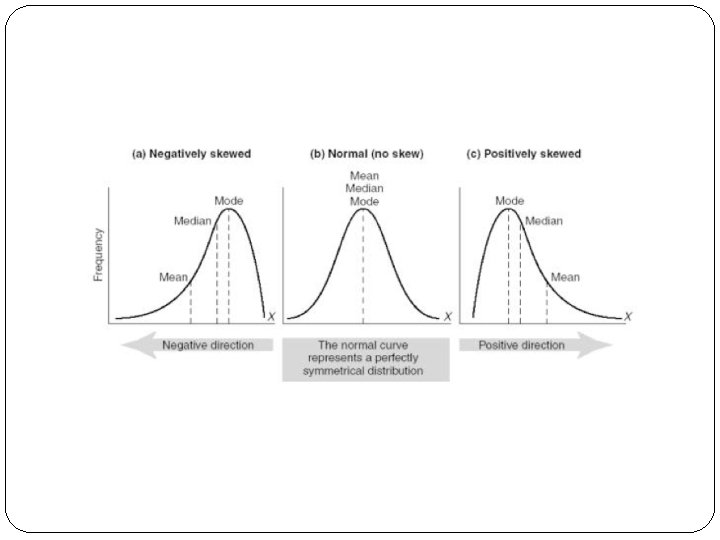

Skewed Distributions
")
Types of Statistics Descripti ve Inferentia l Describe data Used to judge meaning (Infer) Central Tendency Variability Correlation Coefficients Statistical Significance

Descriptive Stats Part I: Central Tendency Mode • Value or score occurring most frequently Median • Value or score that is a halfway point in a data set Mean • Value or score that is the arithmetic average
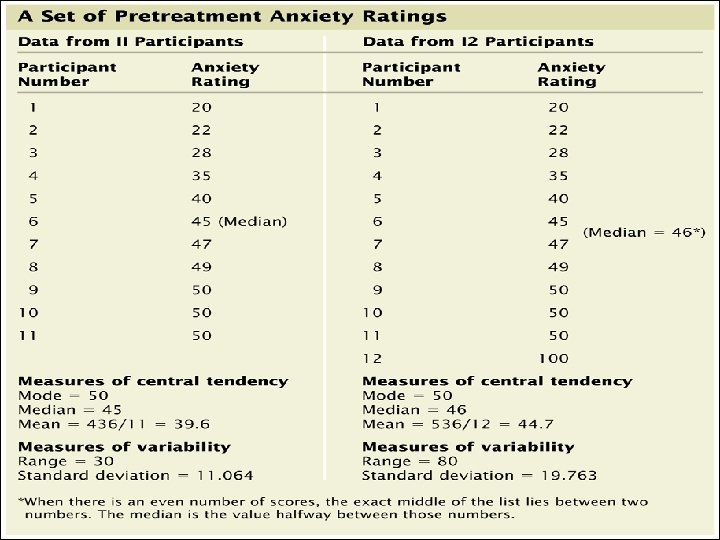

Descriptive Stats Part II: Variability Range • Difference b/w highest & lowest value or score Standard Deviation (SD) • Average b/w each score or value and the mean of the data set • The more variable the data are, the HIGHER the standard deviation figure will be.

Standard Deviation Example The average height for men in the U. S. is 70” The SD is 3” This means most men are 3” taller or shorter than the average So… 3” is ONE standard deviation REMEMBER: the larger the SD figure gets, the more variable (inconsistent/ “all over the place) the data are.


Descriptive Stats Part III: Correlation Coefficients The relationship b/w two variables. Considerations: Direction Strength: Represent : ed by r + or - 1. 00 to 0

Positive Correlation �Direct Relationship �Correlation coefficient from +0. 5 to +1. 0 Scatterplot “Line of best fit” Aggressive behavior Hrs. of Violent TV

Negative Correlation �Inverse Relationship �Correlation coefficient -0. 5 to -1. 0 Aggressive Behavior Hrs. of Violent TV

No Correlation �No relationship between two variables �Correlation coefficient at or near zero Aggressive Behavior Hrs. of Violent TV

r=+0. 87 Score on Psychology Final Exam Average Score on Unit Tests in Psychology

+0. 52 Score on Psychology Final Exam Score on French Final Exam
")
+0. 0001 Score on Psychology Final Exam Body Weight (kg)

-0. 52 Score on Psychology Final Exam Hours per week of TV viewing

-0. 91 Score on Psychology Final Exam Days absent from psychology class

Spurious Correlations �Real correlation exists but not b/w the 2 variables �Caused by a 3 rd variable

Illusory Correlations �NO correlation exists b/w 2 variables �People assume or perceive the variables to be related

Correlations can help predict behavior but they cannot determine the Cause of behavior

Interpret Help evaluate if meaning of differences or descriptive correlations are significant or if they stats (analyze happened by research chance. results). Inferenti al Statistics Tests of Significance Statistically Significant: Correlation coefficient is larger than expected by chance alone. 1. Size of the observed effect 2. Sample Size (larger=better) 3. Size of SD (larger may indicate chance)
- Slides: 22