Statistical Analysis ChiSquare Null Hypothesis refers to a


2 expected")

^2/e")

: n – 1 n = number of options")
=3. 84 (significance level within 5%) • p")


2/50. 886+⋯+(57− 48. 132)2/48. 132=")
- Slides: 13
Statistical Analysis Chi-Square
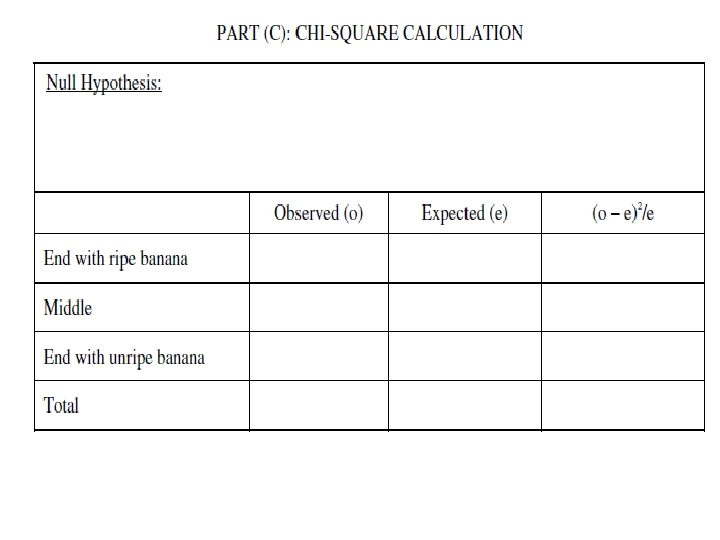
• Null Hypothesis: refers to a general statement or default position that there is no relationship between two measured variables. – Example: Plants have been growing in light and dark environments, and the growth has been measured. • Null Hypothesis: The plant growth measured in light and dark environments will be the same. • Data either “supports” or “rejects” the null hypothesis.
Chi-Square Frequencies Chi Square = Σ (observed-expected)2 expected
Frequency Distributions • One important set of statistical tests allows us to test for deviations of observed frequencies from expected frequencies. To introduce these tests, we will start with a simple, non-biological example. We want to determine if a coin is fair. In other words, are the odds of flipping the coin heads-up the same as tails-up. We collect data by flipping the coin 200 times. The coin landed heads-up 108 times and tails-up 92 times. At first glance, we might suspect that the coin is biased because heads resulted more often than tails. However, we have a more quantitative way to analyze our results, a chi-squared test. • To perform a chi-square test (or any other statistical test), we first must establish our null hypothesis. In this example, our null hypothesis is that the coin should be equally likely to land head-up or tails-up every time. The null hypothesis allows us to state expected frequencies. For 200 tosses, we would expect 100 heads and 100 tails. • The next step is to prepare a table as follows.
Observed Expected Heads 108 100 Tails 92 100 Total 200 • (o-e)^2/e
• The Observed values are those we gather ourselves. The expected values are the frequencies expected, based on our null hypothesis. We total the rows and columns as indicated. It's a good idea to make sure that the row totals equal the column totals (both total to 400 in this example). • Using probability theory, statisticians have devised a way to determine if a frequency distribution differs from the expected distribution. To use this chi-square test, we first have to calculate chi-squared. • Chi-squared =The sum of (observed-expected)2/(expected) • We have two classes to consider in this example, heads and tails. • Chi-squared = (108 -100)2/100 + (92 -100)2/100= (8)2/100 + (-8)2/100 = 0. 64 + 0. 64 = 1. 28 • Now we have to consult a table of critical values of the chi-squared distribution.
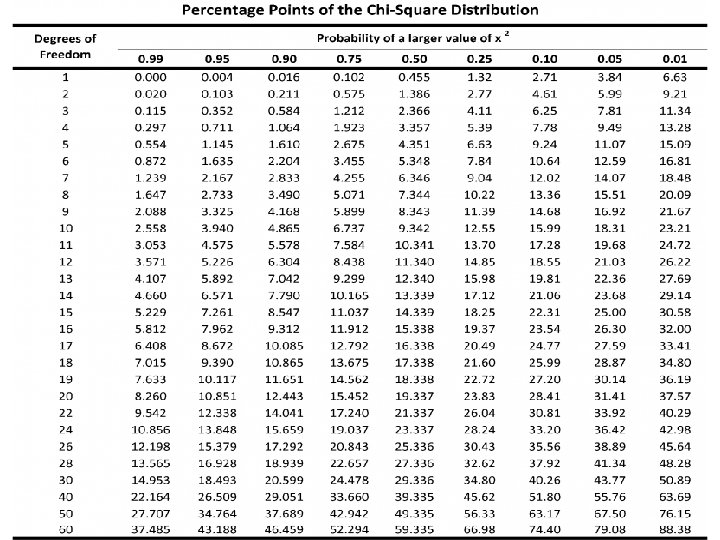
• Degrees of Freedom (df): n – 1 n = number of options Heads or Tails is equal to two options so df= 2 -1=1 • Refer to the table
• p value : p(0. 05)=3. 84 (significance level within 5%) • p value: p(0. 01)= 6. 63 (significance level within 1%) • If the number we calculate is greater than the value, we reject the null hypothesis. • If the number we calculate is less than the value, we support the null hypothesis.
Is gender independent of education level? A random sample of 395 people were surveyed and each person was asked to report the highest education level they obtained. The data that resulted from the survey is summarized in the following table: High School Bachelor s Masters Ph. d. Total Female 60 54 46 41 201 Male 40 44 53 57 194 Total 100 98 99 98 395
Question: Are gender and education level dependent at 5% level of significance? In other words, given the data collected above, is there a relationship between the gender of an individual and the level of education that they have obtained? Here's the table of expected counts: High School Bachelor s Masters Ph. d. Total Female 50. 886 49. 868 50. 377 49. 868 201 Male 49. 114 48. 132 48. 623 48. 132 194 Total 100 98 99 98 395
χ2=(60− 50. 886)2/50. 886+⋯+(57− 48. 132)2/48. 132=