States of Matter SPS 5 Students will compare


 The kinetic molecular theory is an explanation of how particles")

 Because")


.")


- Slides: 27
States of Matter SPS 5. Students will compare & contrast the phases of matter as they relate to atomic & molecular motion. a. Compare and contrast the atomic/molecular motion of solids, liquids, gases and plasmas. SPS 7. Students will relate transformations and flow of energy within a system. d. Explain the flow of energy in phase changes through the use of a phase diagram.
Matter What Is Matter? ◦ Anything that has mass and takes up space is matter. Mass is how much matter there is of an object. Volume is how much space matter takes up. ◦ Matter is anything made of atoms and molecules.
Kinetic Molecular Theory (KMT) The kinetic molecular theory is an explanation of how particles in matter behave. Assumptions: All matter is composed of atoms These particles are in constant motion Molecular motion is random. Particles in motion possess kinetic energy. Their motion increase as they gain energy. Temperature is a measure of average kinetic energy!
States of Matter exists in four states or phases. Molecular motion is greatest in gases, less in liquids, and least in solids There are 4 states of matter: ◦ Solids, Liquids, Gases and Plasma. Note: as of 1995 a fifth, Bose-Einstein Condensate was recognized.
Solids Form when the attractive forces >energy pushing apart. Low Kinetic Energy (KE) Because they are so close, motion is limited to vibrational energy; individual molecules stay fixed in place and vibrate next to each other. Have: ◦ Fixed shape ◦ Fixed volume
Types of Solids Two Types of Solids ◦ Crystalline Solids – have a very orderly, three-dimensional arrangement of particles in a repeating geometric pattern. Ex: Iron, diamond, and ice ◦ Amorphous Solids - made of particles that do not have a special arrangement. Ex: Glass, rubber, and wax
Liquids Formed when energy increases & rigid structure is broken down. Higher KE - Molecules can move around & bump into other molecules; but remain relatively close to each other like solids. Have: ◦ Indefinite shape ◦ Definite (fixed) volume
Liquids Characteristics of Liquids ◦ Surface tension is a cohesive force that acts on the particles at the surface of a liquid. Because molecules at the surface do not have other like molecules on all sides of them and cohere more strongly to those nearest them on the surface. High: Water forms spherical drops. Low: Gasoline forms flat drops. ◦ Viscosity is a liquid’s resistance to flow. Usually, the stronger the attraction between the molecules of a liquid, the more viscous the liquid is.
Gases Formed when energy in the system > attractive forces between molecules. Molecules have little interaction except occasionally bump into one another. Higher KE - Molecules move quickly and are free to move in any direction, spreading out long distances. Have: ◦ indefinite shape and ◦ indefinite volume
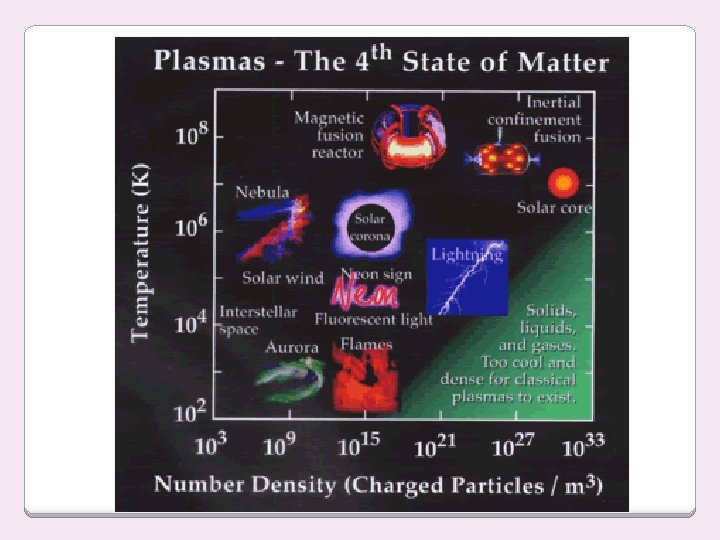
Plasmas Form under conditions of extremely high energy molecules are ripped apart Plasma made up of free electrons and element ions Very high KE - hot, ionized gases - electrons are ripped off of individual atoms. Gas-like - indefinite shape and volume Very high KE –particles collide with enough energy to break into charged particles Because the atoms in plasma exist as charged ions, plasmas behave differently than gases - free ions cause plasma to be electrically conductive.
Four States of Matter: Review Solid Definite Shape and Volume Liquid Indefinite Shape and Definite Volume Gas Indefinite Shape and Volume Plasma Indefinite Shape and Volume
Four States of Matter: Review Animation
Four States of Matter: Review SOLID Tightly packed in a regular pattern; Vibrate, but do not move from place to place LIQUID Close together with no regular arrangement; Vibrate, move about, and slide past each other GAS Well-separated with no regular arrangement; Vibrate and move freely at high speeds PLASMA Has no definite volume or shape and is composed of electrical charged particles
Phase Changes Melting ◦ solid to liquid ◦ energy is added ◦ Ex: ice melting, candle wax melting Freezing ◦ liquid to solid ◦ energy is removed ◦ Ex: water freezing, slushies melting point = freezing point
Phase Changes Evaporation ◦ liquid to gas below the boiling point ◦ energy is added ◦ Ex: puddle of water Vaporization (boiling) ◦ liquid to gas at or above the boiling point ◦ energy is added ◦ Ex: boiling water
Phase Changes Condensation ◦ gas to liquid ◦ energy is removed ◦ Ex: dew on plants, droplets of water on windows and glasses
Phase Changes Sublimation ◦ solid to gas ◦ energy is added ◦ Ex: dry ice, freeze drying, iodine crystals Deposition (Desublimation) ◦ gas to solid ◦ energy is removed ◦ Ex: In sub-freezing air, water vapor changes directly to ice without first becoming a liquid. This is how snow forms in clouds, as well as, frost on the ground.
Phase Changes Ionization ◦ gas to plasma ◦ energy is added Deionization ◦ plasma to gas ◦ energy is removed
Phase Changes Key Idea: Phase changes involve a change in energy
Heating Curves show the change in temperature as more heat is added. The graph shows change in temperature over time as heat is added. Notice that as the phase changes occur, there is no change in temperature – energy goes into the phase change rather than increasing temperature.
Phase Change Diagrams Triple Point At the triplepoint temperature, T 3, and triple-point pressure, P 3, three phases can coexist at equilibrium. The point at T 3, P 3 is called the triple point. Critical Point: At a temperature above the critical temperature, Tc, and a pressure above the critical pressure, Pc, it is no longer possible to distinguish between the gas and liquid phases. At T > Tc and P > Pc the substance is referred to as a super-critical fluid. These care a common way to represent various phases of a substance and the conditions under which each phase exists. It graphs pressure vs. temperature. http: //www. chm. davidson. edu/Chemistry. Applets/Phase. Changes/Phase. Diagram. html
Note: Pressure vs. Temperature Just as a change in temperature can drive a phase change, a change in pressure can produce the same effect. Lower Pressure: ◦ Boiling Point lower ◦ Freezing point lower Higher Pressure ◦ Boiling point higher ◦ Freezing point higher
Phase Change Diagram for Carbon Dioxide http: //library. thinkquest. org/C 006669/data/Chem/colligative/phase. html
Water is a rare substances that expands upon freezing (which is why ice floats). Consequently, its melting temperature falls very slightly if pressure is increased. Phase Change Diagram for Water http: //library. thinkquest. org/C 006669/data/Chem/colligative/phase. html
1. 2. 3. 4. 5. 6. What is the normal freezing point of this substance? What is the normal boiling point of this substance? What is the normal melting point? If I had a quantity of this substance at a pressure of 1. 25 atm and a temperature of 3000 C and lowered the pressure to 0. 25 atm, what phase transition(s) would occur? At what temperature do the gas and liquid phases become indistinguishable from each other? If I had a quantity of this substance at a pressure of 0. 75 atm and a temperature of -1000 C, what phase change(s) would occur if I increased the temperature to 6000 C? At what temperature(s) would they occur? Practice Want more practice? http: //www. sciencegeek. net/Chemistry/taters/phasediagram. htm http: //www. wisc-online. com/objects/viewobject. aspx? id=gch 6304
Activities! Phase Change Diagram Worksheet Boiling Water Lab Phases Gizmo