
State Regulation and Hospital Costs John J Antel

- Slides: 20
State Regulation and Hospital Costs John J. Antel, Robert L. Ohsfelt, Edmund R. Becker The Review of Economics and Statistics Vol. 77, No. 3 (Aug. 1995), p. 416 – 422 presented by Susanne Buesselmann, April 2004
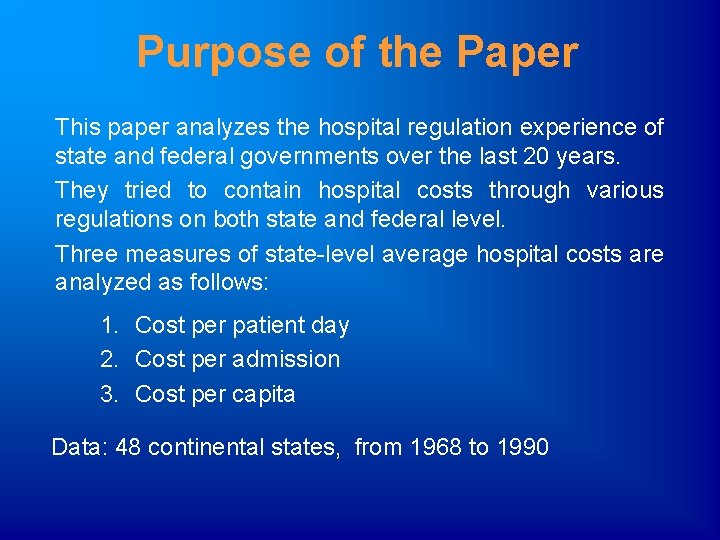
Purpose of the Paper This paper analyzes the hospital regulation experience of state and federal governments over the last 20 years. They tried to contain hospital costs through various regulations on both state and federal level. Three measures of state-level average hospital costs are analyzed as follows: 1. Cost per patient day 2. Cost per admission 3. Cost per capita Data: 48 continental states, from 1968 to 1990
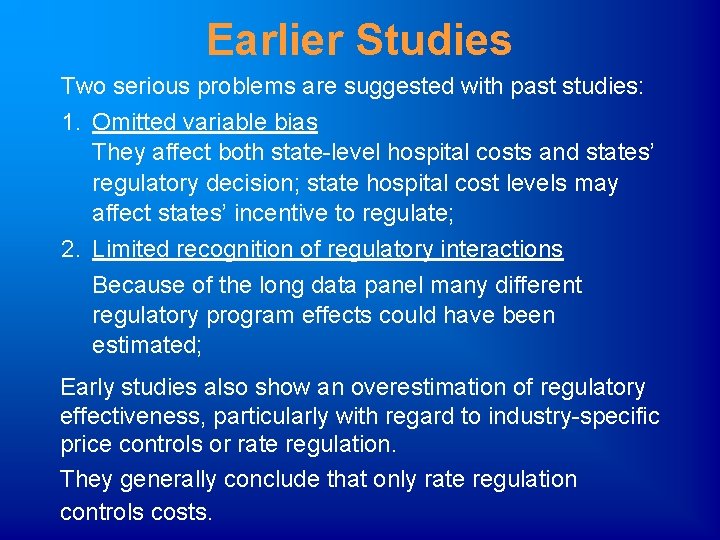
Earlier Studies Two serious problems are suggested with past studies: 1. Omitted variable bias They affect both state-level hospital costs and states’ regulatory decision; state hospital cost levels may affect states’ incentive to regulate; 2. Limited recognition of regulatory interactions Because of the long data panel many different regulatory program effects could have been estimated; Early studies also show an overestimation of regulatory effectiveness, particularly with regard to industry-specific price controls or rate regulation. They generally conclude that only rate regulation controls costs.
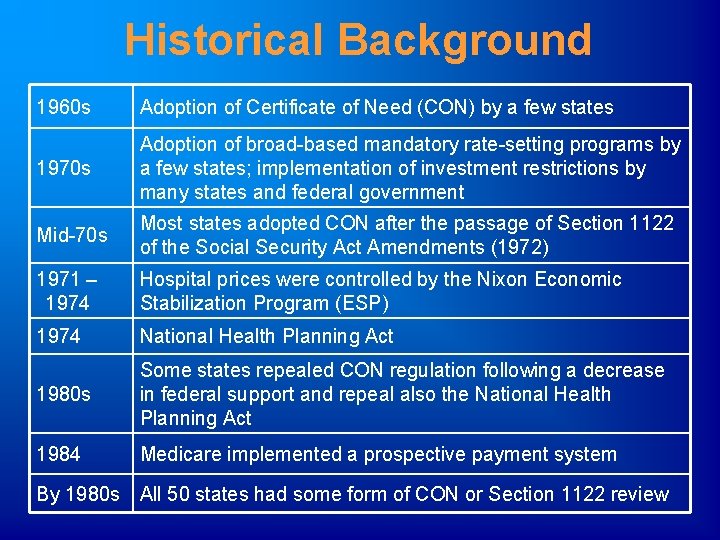
Historical Background 1960 s Adoption of Certificate of Need (CON) by a few states 1970 s Adoption of broad-based mandatory rate-setting programs by a few states; implementation of investment restrictions by many states and federal government Mid-70 s Most states adopted CON after the passage of Section 1122 of the Social Security Act Amendments (1972) 1971 – 1974 Hospital prices were controlled by the Nixon Economic Stabilization Program (ESP) 1974 National Health Planning Act 1980 s Some states repealed CON regulation following a decrease in federal support and repeal also the National Health Planning Act 1984 Medicare implemented a prospective payment system By 1980 s All 50 states had some form of CON or Section 1122 review
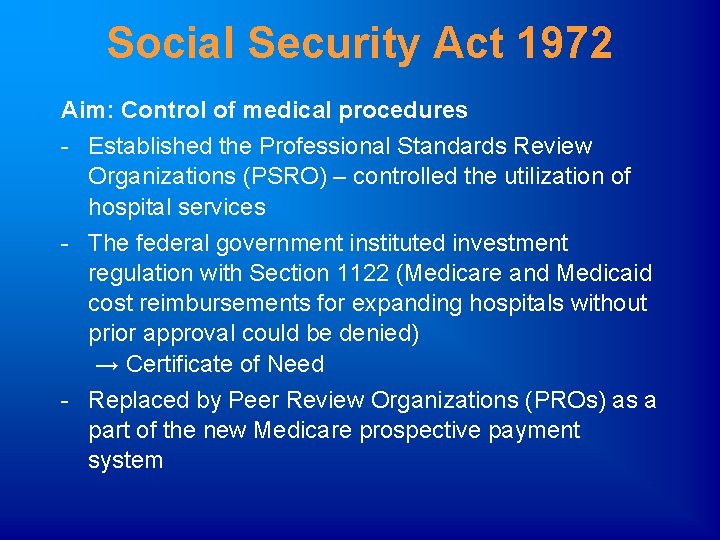
Social Security Act 1972 Aim: Control of medical procedures - Established the Professional Standards Review Organizations (PSRO) – controlled the utilization of hospital services - The federal government instituted investment regulation with Section 1122 (Medicare and Medicaid cost reimbursements for expanding hospitals without prior approval could be denied) → Certificate of Need - Replaced by Peer Review Organizations (PROs) as a part of the new Medicare prospective payment system
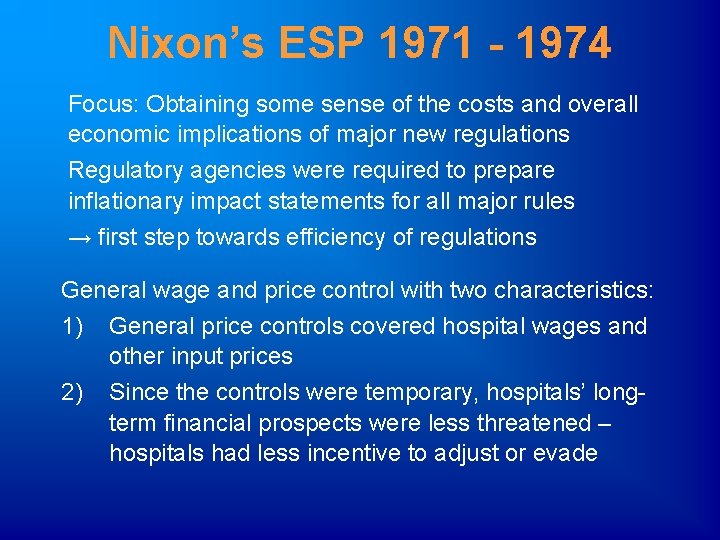
Nixon’s ESP 1971 - 1974 Focus: Obtaining some sense of the costs and overall economic implications of major new regulations Regulatory agencies were required to prepare inflationary impact statements for all major rules → first step towards efficiency of regulations General wage and price control with two characteristics: 1) 2) General price controls covered hospital wages and other input prices Since the controls were temporary, hospitals’ longterm financial prospects were less threatened – hospitals had less incentive to adjust or evade
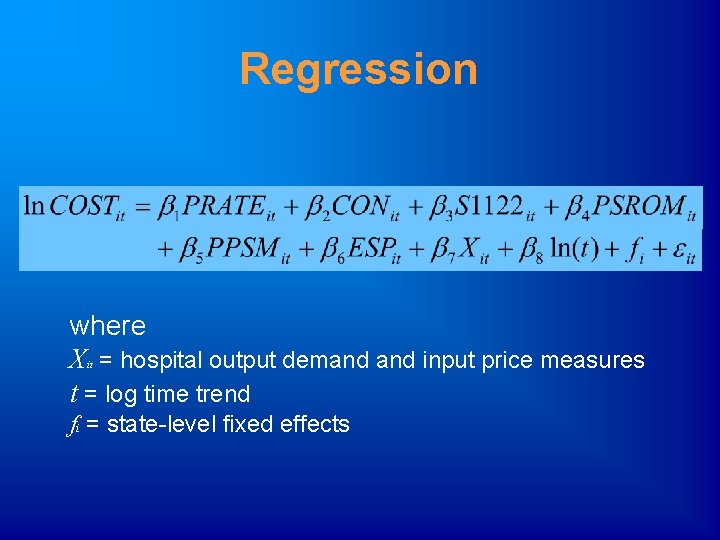
Regression where X = hospital output demand input price measures t = log time trend it fi = state-level fixed effects
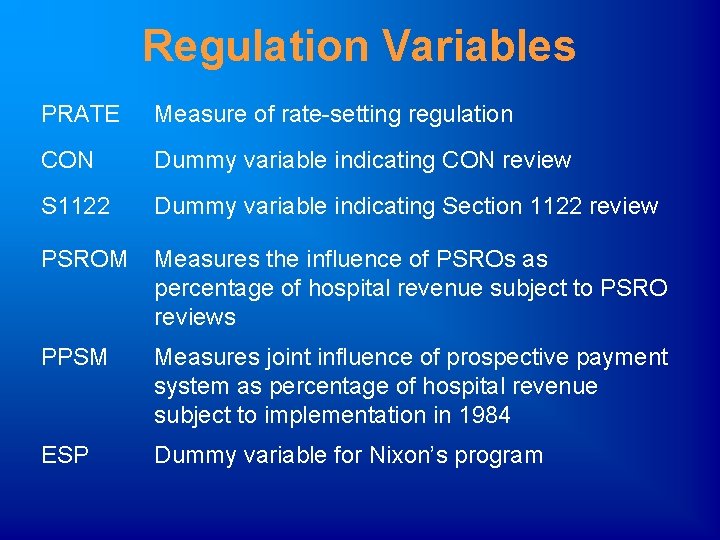
Regulation Variables PRATE Measure of rate-setting regulation CON Dummy variable indicating CON review S 1122 Dummy variable indicating Section 1122 review PSROM Measures the influence of PSROs as percentage of hospital revenue subject to PSRO reviews PPSM Measures joint influence of prospective payment system as percentage of hospital revenue subject to implementation in 1984 ESP Dummy variable for Nixon’s program
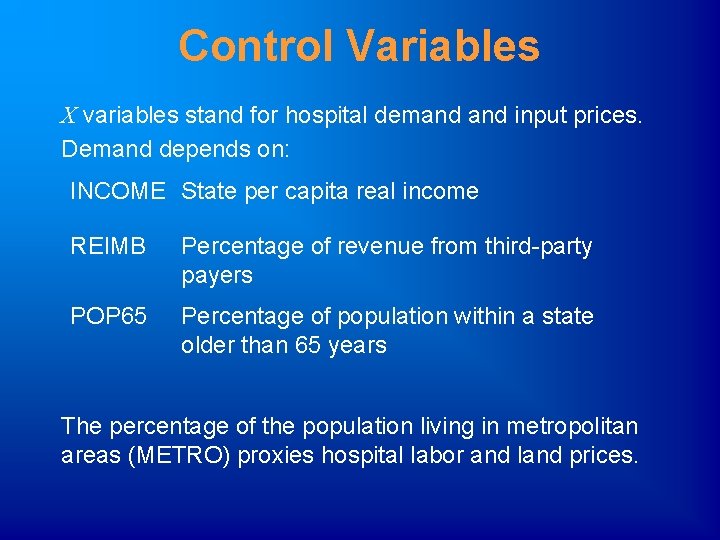
Control Variables X variables stand for hospital demand input prices. Demand depends on: INCOME State per capita real income REIMB Percentage of revenue from third-party payers POP 65 Percentage of population within a state older than 65 years The percentage of the population living in metropolitan areas (METRO) proxies hospital labor and land prices.
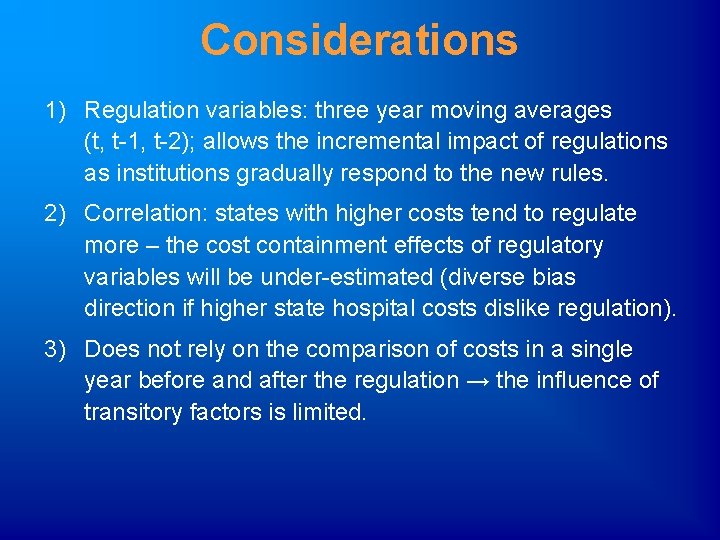
Considerations 1) Regulation variables: three year moving averages (t, t-1, t-2); allows the incremental impact of regulations as institutions gradually respond to the new rules. 2) Correlation: states with higher costs tend to regulate more – the cost containment effects of regulatory variables will be under-estimated (diverse bias direction if higher state hospital costs dislike regulation). 3) Does not rely on the comparison of costs in a single year before and after the regulation → the influence of transitory factors is limited.
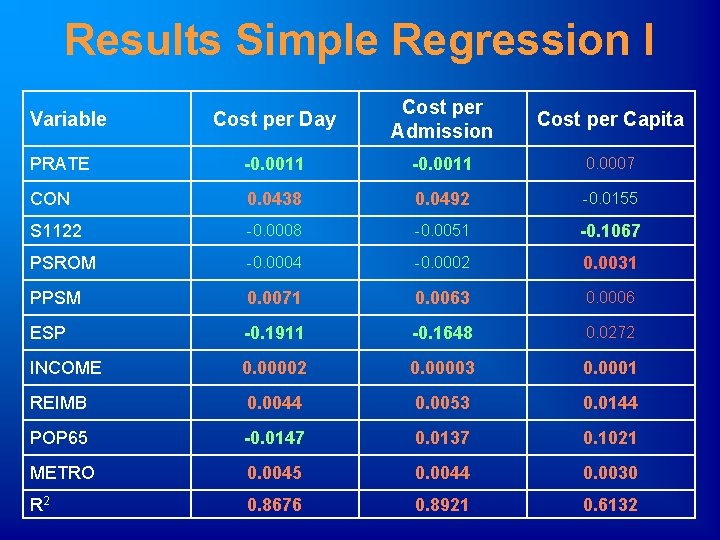
Results Simple Regression I Cost per Day Cost per Admission Cost per Capita PRATE -0. 0011 0. 0007 CON 0. 0438 0. 0492 -0. 0155 S 1122 -0. 0008 -0. 0051 -0. 1067 PSROM -0. 0004 -0. 0002 0. 0031 PPSM 0. 0071 0. 0063 0. 0006 ESP -0. 1911 -0. 1648 0. 0272 INCOME 0. 00002 0. 00003 0. 0001 REIMB 0. 0044 0. 0053 0. 0144 POP 65 -0. 0147 0. 0137 0. 1021 METRO 0. 0045 0. 0044 0. 0030 R 2 0. 8676 0. 8921 0. 6132 Variable
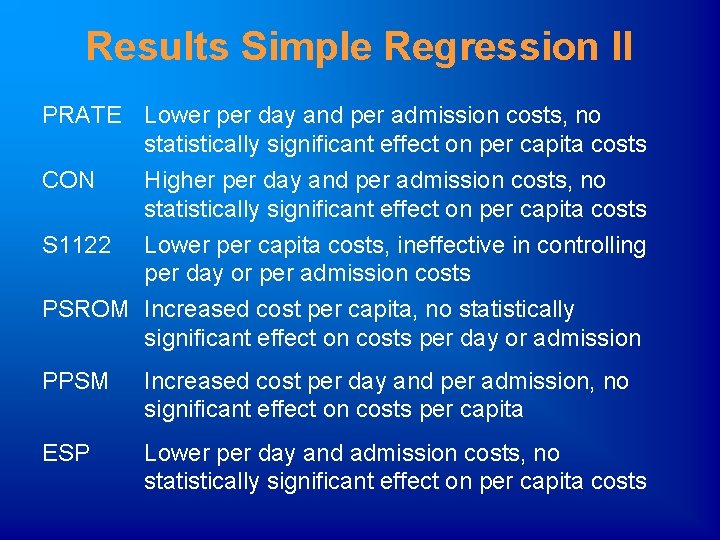
Results Simple Regression II PRATE Lower per day and per admission costs, no statistically significant effect on per capita costs CON Higher per day and per admission costs, no statistically significant effect on per capita costs S 1122 Lower per capita costs, ineffective in controlling per day or per admission costs PSROM Increased cost per capita, no statistically significant effect on costs per day or admission PPSM Increased cost per day and per admission, no significant effect on costs per capita ESP Lower per day and admission costs, no statistically significant effect on per capita costs
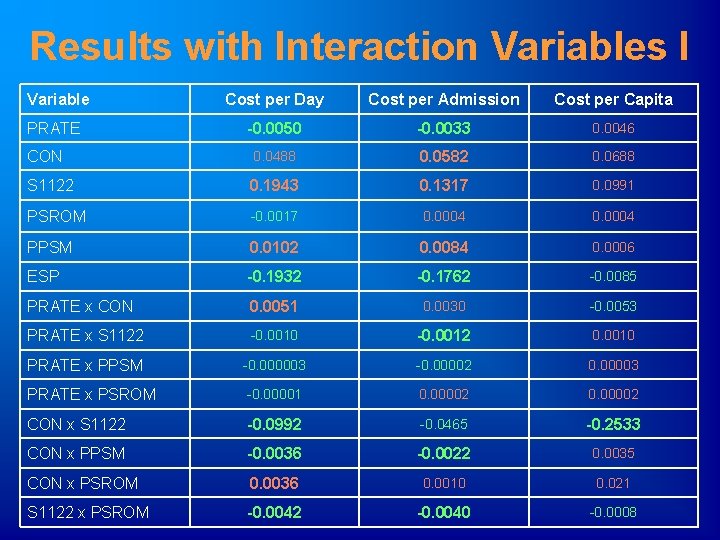
Results with Interaction Variables I Variable Cost per Day Cost per Admission Cost per Capita PRATE -0. 0050 -0. 0033 0. 0046 CON 0. 0488 0. 0582 0. 0688 S 1122 0. 1943 0. 1317 0. 0991 PSROM -0. 0017 0. 0004 PPSM 0. 0102 0. 0084 0. 0006 ESP -0. 1932 -0. 1762 -0. 0085 PRATE x CON 0. 0051 0. 0030 -0. 0053 PRATE x S 1122 -0. 0010 -0. 0012 0. 0010 PRATE x PPSM -0. 000003 -0. 00002 0. 00003 PRATE x PSROM -0. 00001 0. 00002 CON x S 1122 -0. 0992 -0. 0465 -0. 2533 CON x PPSM -0. 0036 -0. 0022 0. 0035 CON x PSROM 0. 0036 0. 0010 0. 021 S 1122 x PSROM -0. 0042 -0. 0040 -0. 0008
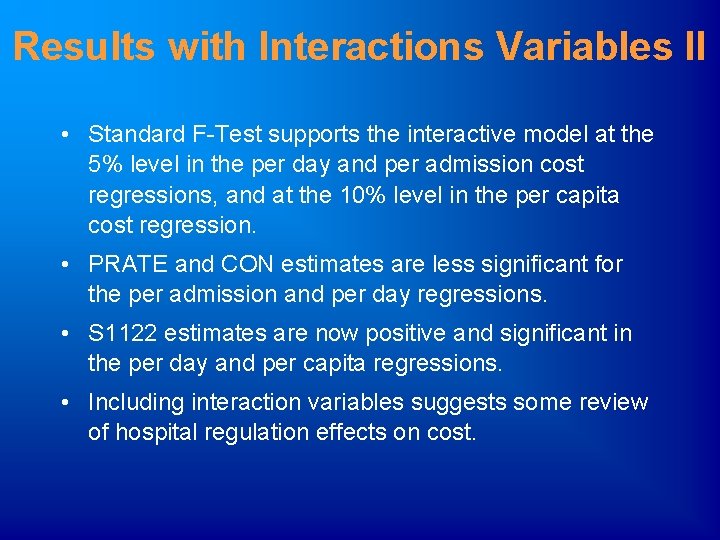
Results with Interactions Variables II • Standard F-Test supports the interactive model at the 5% level in the per day and per admission cost regressions, and at the 10% level in the per capita cost regression. • PRATE and CON estimates are less significant for the per admission and per day regressions. • S 1122 estimates are now positive and significant in the per day and per capita regressions. • Including interaction variables suggests some review of hospital regulation effects on cost.
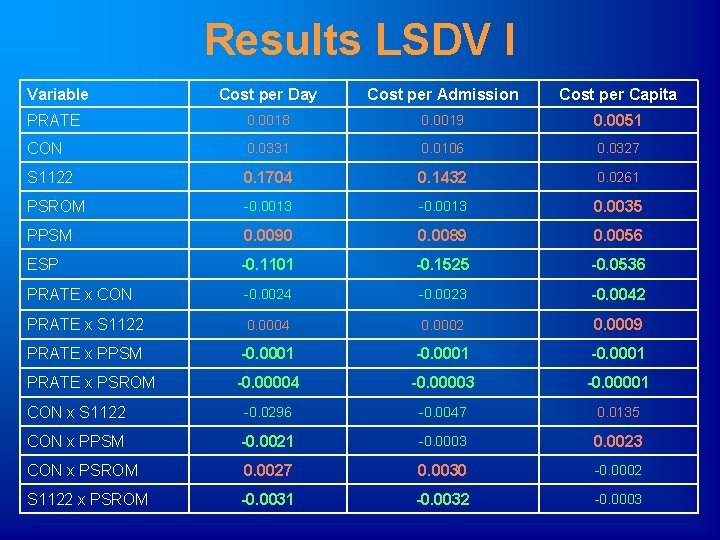
Results LSDV I Variable Cost per Day Cost per Admission Cost per Capita PRATE 0. 0018 0. 0019 0. 0051 CON 0. 0331 0. 0106 0. 0327 S 1122 0. 1704 0. 1432 0. 0261 PSROM -0. 0013 0. 0035 PPSM 0. 0090 0. 0089 0. 0056 ESP -0. 1101 -0. 1525 -0. 0536 PRATE x CON -0. 0024 -0. 0023 -0. 0042 PRATE x S 1122 0. 0004 0. 0002 0. 0009 PRATE x PPSM -0. 0001 PRATE x PSROM -0. 00004 -0. 00003 -0. 00001 CON x S 1122 -0. 0296 -0. 0047 0. 0135 CON x PPSM -0. 0021 -0. 0003 0. 0023 CON x PSROM 0. 0027 0. 0030 -0. 0002 S 1122 x PSROM -0. 0031 -0. 0032 -0. 0003
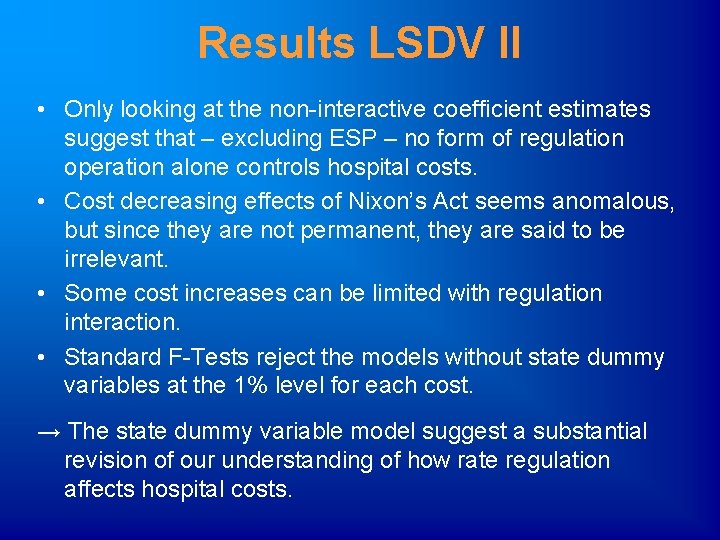
Results LSDV II • Only looking at the non-interactive coefficient estimates suggest that – excluding ESP – no form of regulation operation alone controls hospital costs. • Cost decreasing effects of Nixon’s Act seems anomalous, but since they are not permanent, they are said to be irrelevant. • Some cost increases can be limited with regulation interaction. • Standard F-Tests reject the models without state dummy variables at the 1% level for each cost. → The state dummy variable model suggest a substantial revision of our understanding of how rate regulation affects hospital costs.
Results Control Variables • Most of the output demand input cost coefficient estimates are consistent with expectations while the income and reimbursement coefficients are of particular economic and policy significance. • A higher third-party payment leads to a rise in demand for hospital services. • Hospital services are a normal good (LSDV coefficients are small, but generally positive). • Small values of income elasticity (0. 007 – 0. 45) indicates that increasing income has only a small effect in driving up hospital costs.
New Medicare System Here: Medicare increases all hospital costs – contrary to earlier studies; But panel data covers the complete implementation of the Medicare system! Sloan et al. (1988): Higher daily costs are due to the increased average acuity of patients as the new Medicare system limits hospital utilization by less acutely ill patients. Also higher effect on per capita costs! That implies either that the Medicare system cannot effectively restrict utilization, or that other unmeasured factors are associated with PPSM accounting for the higher costs.
Interactions of Regulations Per capita cost regressions imply that CON regulation in part compensates the higher per capita costs associated with rate regulation. While rate regulation alone does not reduce costs, it may limit the cost increasing effects of the new Medicare system – per day and per admission state dummy regressions suggest that rate regulation moderates the cost increases due to the new Medicare system. Two possibilities: 1. State rate controls covering all patients may limit cross subsidization of Medicare recipients by other health care consumers 2. Rate regulating states may be better able to adjust to the new Medicare system
Conclusion • • Limited effectiveness of hospital cost regulation No single form of hospital regulation implies lower costs Regulations are often associated with higher costs Neither federal utilization controls nor state and federal hospital investment restrictions have lowered hospital costs • Regulations working together may in some instances limit cost increases • Indication of state-specific heterogeneity • Future studies should focus on issues of regulatory evasion, interactions of regulations, and possible regulatory redistribution of hospital costs