
State of the Art Salt and Health Outcomes

- Slides: 40
State of the Art: Salt and Health Outcomes Francesco P Cappuccio MD MSc DSc FRCP FFPH FBHS FAHA Professor of Cardiovascular Medicine & Epidemiology Head, WHO Collaborating Centre University of Warwick, Coventry, UK Disclosures: Technical Advisor to the World Health Organization, the Pan American Health Organization, Member of C. A. S. H. , W. A. S. H. , UK Health Forum and Trustee of the Student Heart Health Trust Vice-President, British Hypertension Society – all unpaid.
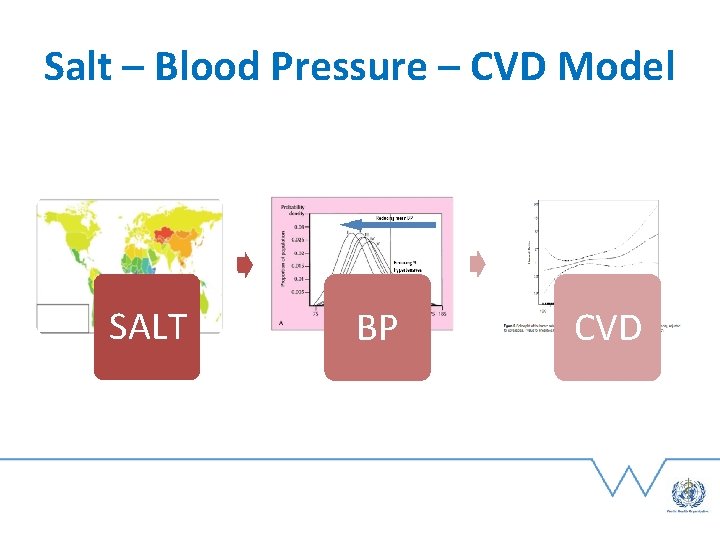
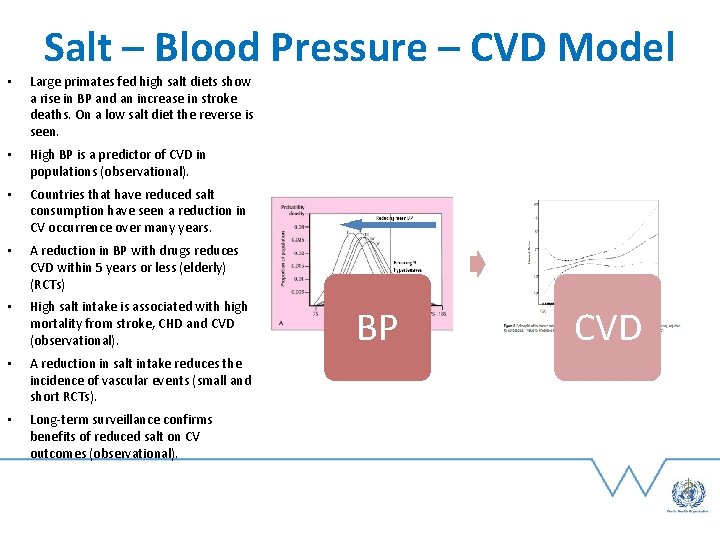
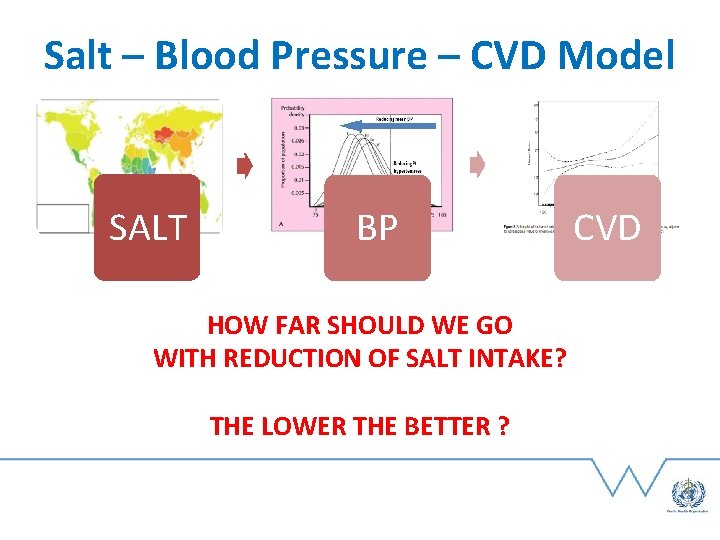
Salt – Blood Pressure – CVD Model SALT BP CVD
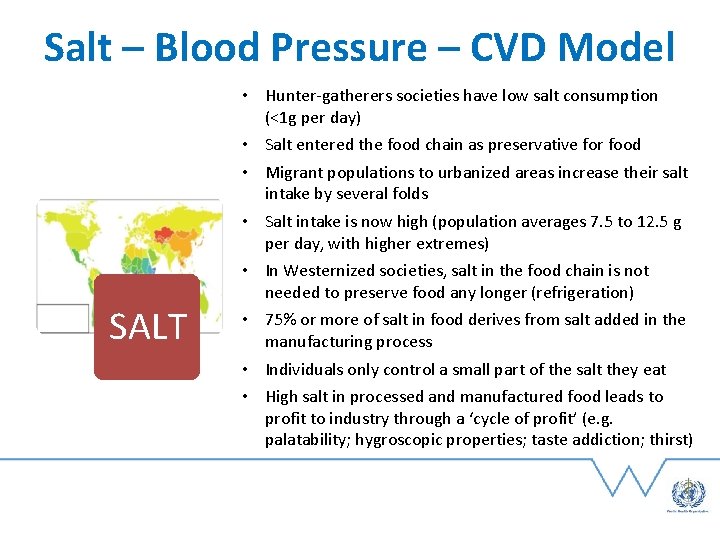
Salt – Blood Pressure – CVD Model SALT • Hunter-gatherers societies have low salt consumption (<1 g per day) • Salt entered the food chain as preservative for food • Migrant populations to urbanized areas increase their salt intake by several folds • Salt intake is now high (population averages 7. 5 to 12. 5 g per day, with higher extremes) • In Westernized societies, salt in the food chain is not needed to preserve food any longer (refrigeration) • 75% or more of salt in food derives from salt added in the manufacturing process • Individuals only control a small part of the salt they eat • High salt in processed and manufactured food leads to profit to industry through a ‘cycle of profit’ (e. g. palatability; hygroscopic properties; taste addiction; thirst) BP CVD
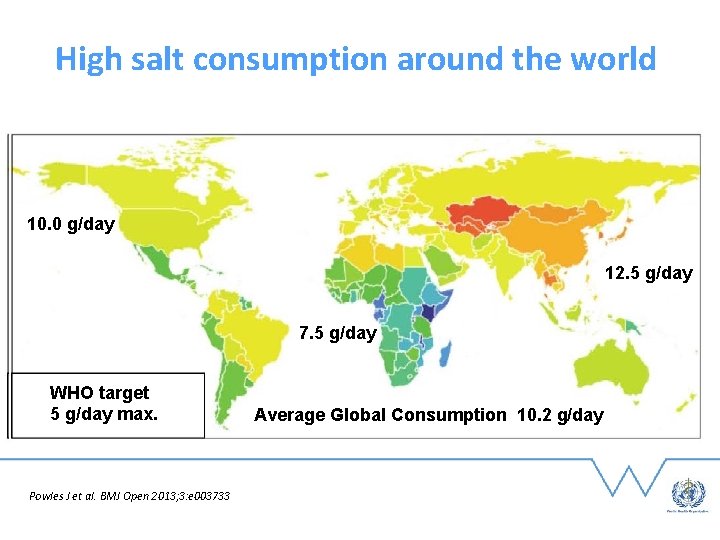
High salt consumption around the world 10. 0 g/day 12. 5 g/day 7. 5 g/day WHO target 5 g/day max. Powles J et al. BMJ Open 2013; 3: e 003733 Average Global Consumption 10. 2 g/day
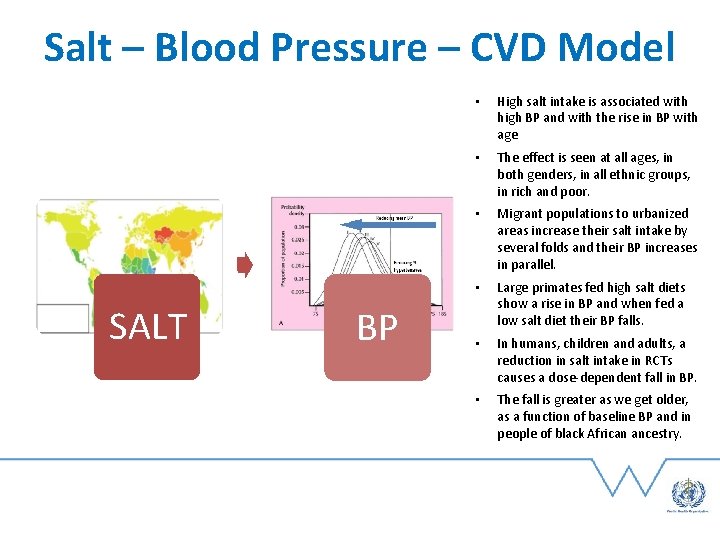
Salt – Blood Pressure – CVD Model SALT BP • High salt intake is associated with high BP and with the rise in BP with age • The effect is seen at all ages, in both genders, in all ethnic groups, in rich and poor. • Migrant populations to urbanized areas increase their salt intake by several folds and their BP increases in parallel. • Large primates fed high salt diets show a rise in BP and when fed a low salt diet their BP falls. • In humans, children and adults, a reduction in salt intake in RCTs causes a dose-dependent fall in BP. • The fall is greater as we get older, as a function of baseline BP and in people of black African ancestry. CVD
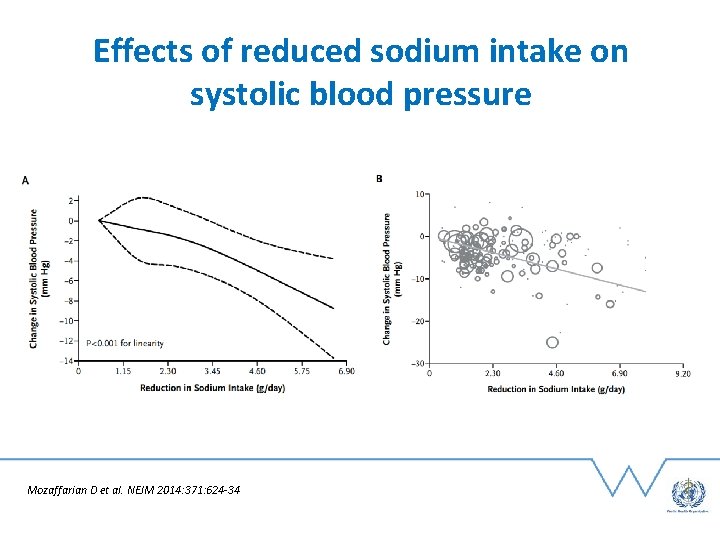
Effects of reduced sodium intake on systolic blood pressure Mozaffarian D et al. NEJM 2014: 371: 624 -34
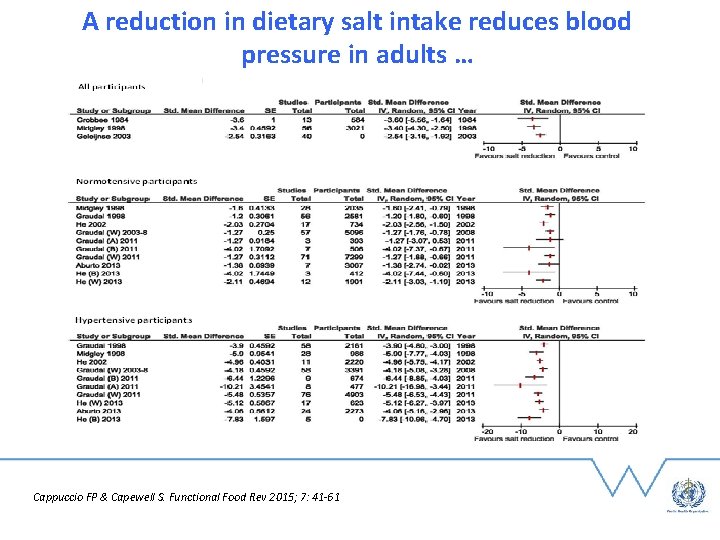
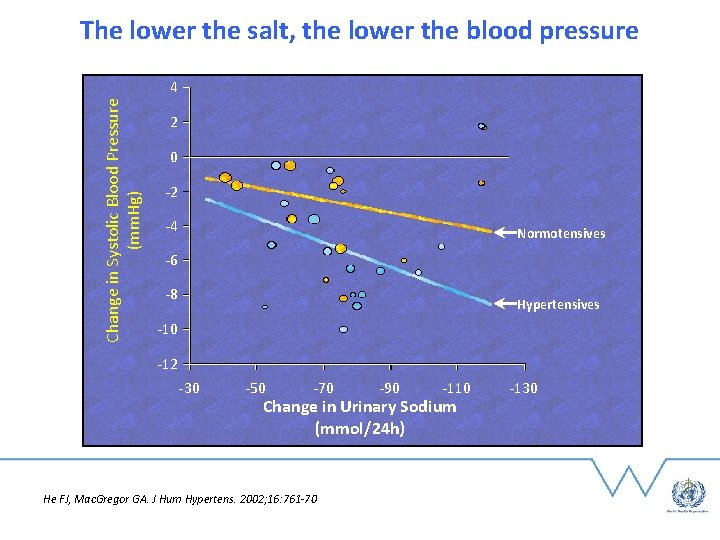
A reduction in dietary salt intake reduces blood pressure in adults … Cappuccio FP & Capewell S. Functional Food Rev 2015; 7: 41 -61
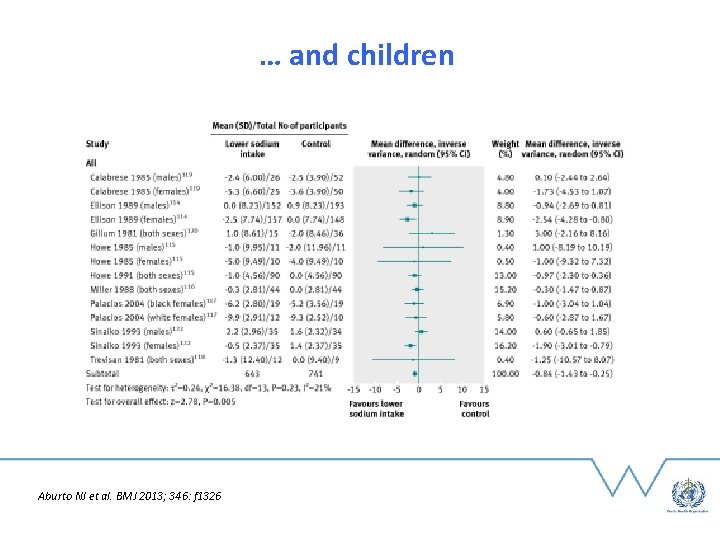
… and children Aburto NJ et al. BMJ 2013; 346: f 1326
The lower the salt, the lower the blood pressure Change in Systolic Blood Pressure (mm. Hg) 4 2 0 -2 -4 Normotensives -6 -8 Hypertensives -10 -12 -30 -50 -70 -90 -110 Change in Urinary Sodium (mmol/24 h) He 9 FJ, Mac. Gregor GA. J Hum Hypertens. 2002; 16: 761 -70 -130
Salt – Blood Pressure – CVD Model • Large primates fed high salt diets show a rise in BP and an increase in stroke deaths. On a low salt diet the reverse is seen. • High BP is a predictor of CVD in populations (observational). • Countries that have reduced salt consumption have seen a reduction in CV occurrence over many years. • A reduction in BP with drugs reduces CVD within 5 years or less (elderly) (RCTs) • High salt intake is associated with high mortality from stroke, CHD and CVD (observational). • A reduction in salt intake reduces the incidence of vascular events (small and short RCTs). • Long-term surveillance confirms benefits of reduced salt on CV outcomes (observational). SALT BP CVD
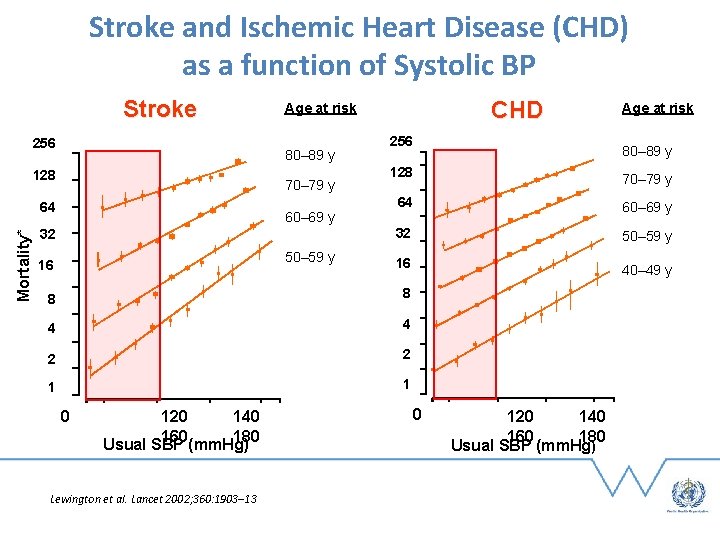
Stroke and Ischemic Heart Disease (CHD) as a function of Systolic BP Stroke 256 80– 89 y 128 70– 79 y Mortality* 64 60– 69 y 32 50– 59 y 16 CHD Age at risk 256 60– 69 y 32 50– 59 y 16 40– 49 y 4 4 2 2 1 1 Lewington et al. Lancet 2002; 360: 1903– 13 70– 79 y 64 8 120 140 160 180 Usual SBP (mm. Hg) 80– 89 y 128 8 0 Age at risk 0 120 140 160 180 Usual SBP (mm. Hg)
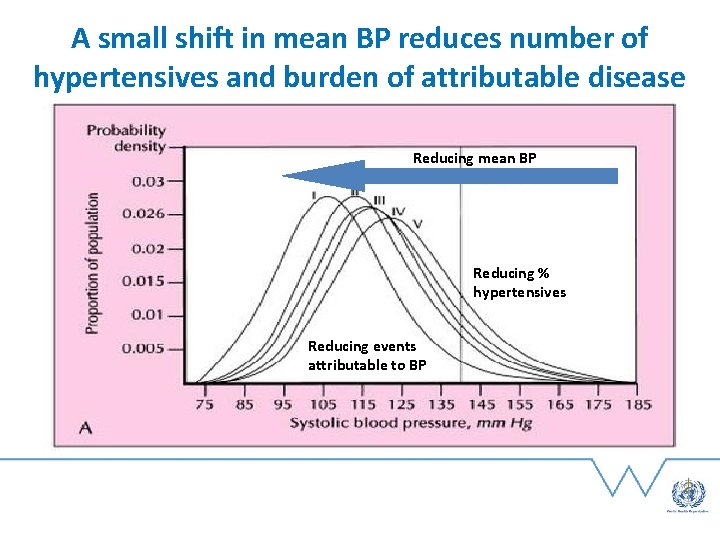
A small shift in mean BP reduces number of hypertensives and burden of attributable disease Reducing mean BP Reducing % hypertensives Reducing events attributable to BP
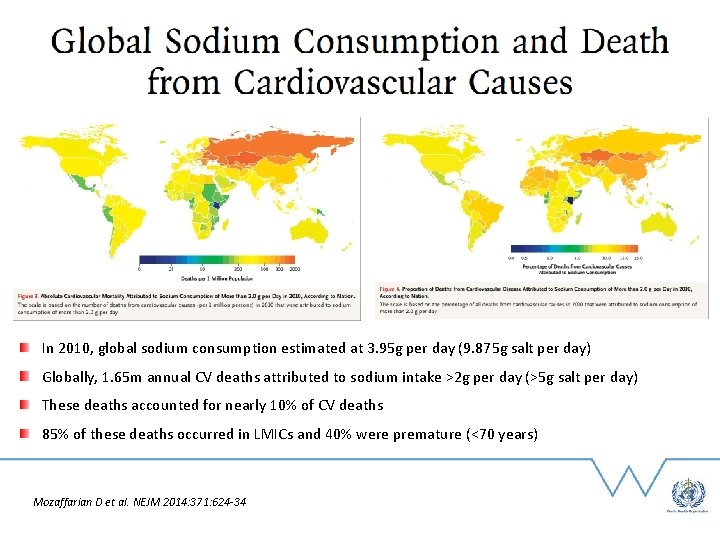
In 2010, global sodium consumption estimated at 3. 95 g per day (9. 875 g salt per day) Globally, 1. 65 m annual CV deaths attributed to sodium intake >2 g per day (>5 g salt per day) These deaths accounted for nearly 10% of CV deaths 85% of these deaths occurred in LMICs and 40% were premature (<70 years) Mozaffarian D et al. NEJM 2014: 371: 624 -34
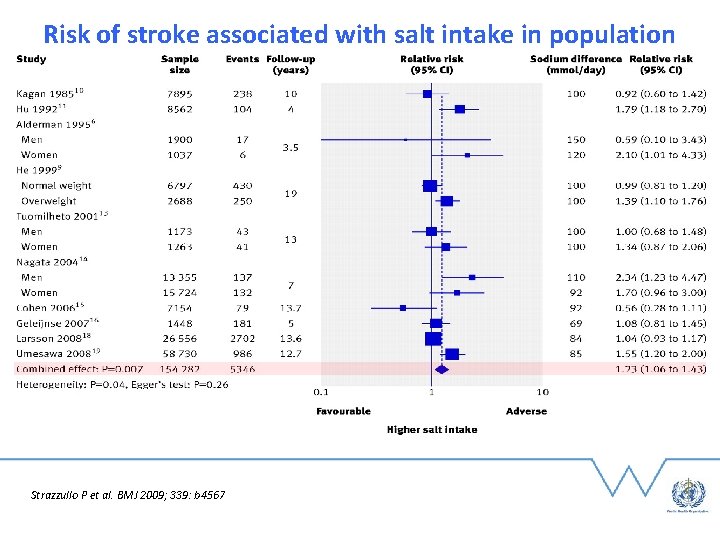
Risk of stroke associated with salt intake in population Strazzullo P et al. BMJ 2009; 339: b 4567 14
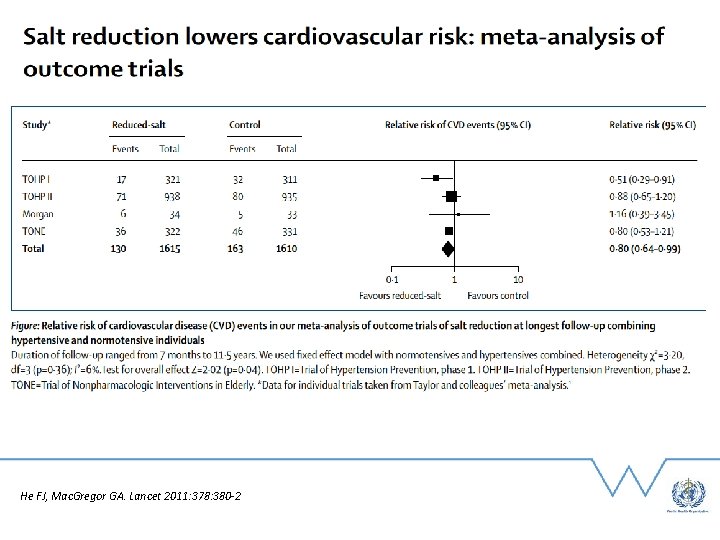
He FJ, Mac. Gregor GA. Lancet 2011: 378: 380 -2
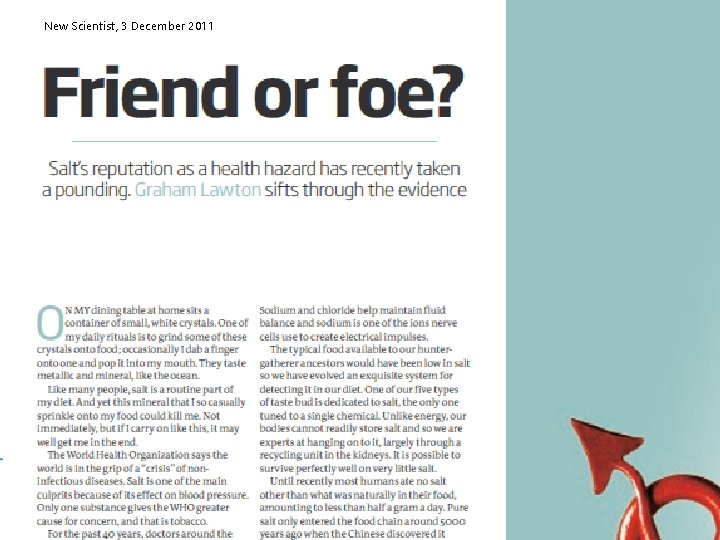
New Scientist, 3 December 2011
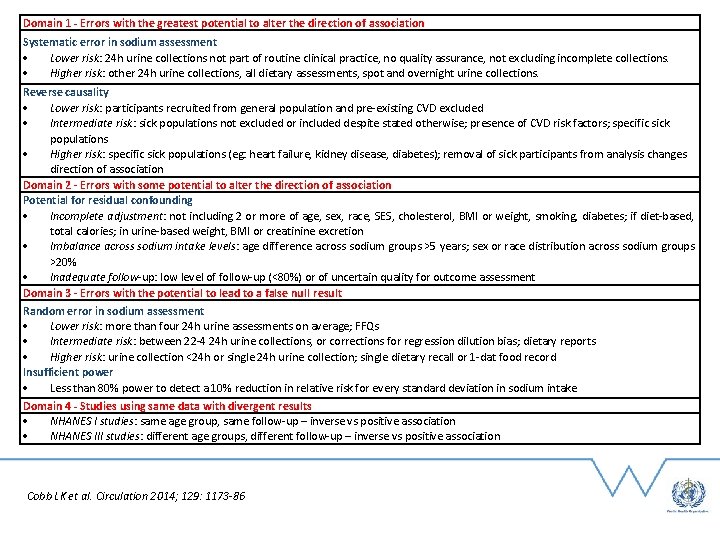
Domain 1 - Errors with the greatest potential to alter the direction of association Systematic error in sodium assessment Lower risk: 24 h urine collections not part of routine clinical practice, no quality assurance, not excluding incomplete collections. Higher risk: other 24 h urine collections, all dietary assessments, spot and overnight urine collections. Reverse causality Lower risk: participants recruited from general population and pre-existing CVD excluded Intermediate risk: sick populations not excluded or included despite stated otherwise; presence of CVD risk factors; specific sick populations Higher risk: specific sick populations (eg: heart failure, kidney disease, diabetes); removal of sick participants from analysis changes direction of association Domain 2 - Errors with some potential to alter the direction of association Potential for residual confounding Incomplete adjustment: not including 2 or more of age, sex, race, SES, cholesterol, BMI or weight, smoking, diabetes; if diet-based, total calories; in urine-based weight, BMI or creatinine excretion Imbalance across sodium intake levels: age difference across sodium groups >5 years; sex or race distribution across sodium groups >20% Inadequate follow-up: low level of follow-up (<80%) or of uncertain quality for outcome assessment Domain 3 - Errors with the potential to lead to a false null result Random error in sodium assessment Lower risk: more than four 24 h urine assessments on average; FFQs Intermediate risk: between 22 -4 24 h urine collections, or corrections for regression dilution bias; dietary reports Higher risk: urine collection <24 h or single 24 h urine collection; single dietary recall or 1 -dat food record Insufficient power Less than 80% power to detect a 10% reduction in relative risk for every standard deviation in sodium intake Domain 4 - Studies using same data with divergent results NHANES I studies: same age group, same follow-up – inverse vs positive association NHANES III studies: different age groups, different follow-up – inverse vs positive association Cobb LK et al. Circulation 2014; 129: 1173 -86
SODIUM INTAKE AND CV EVENTS: J-SHAPE RELATIONSHIP?
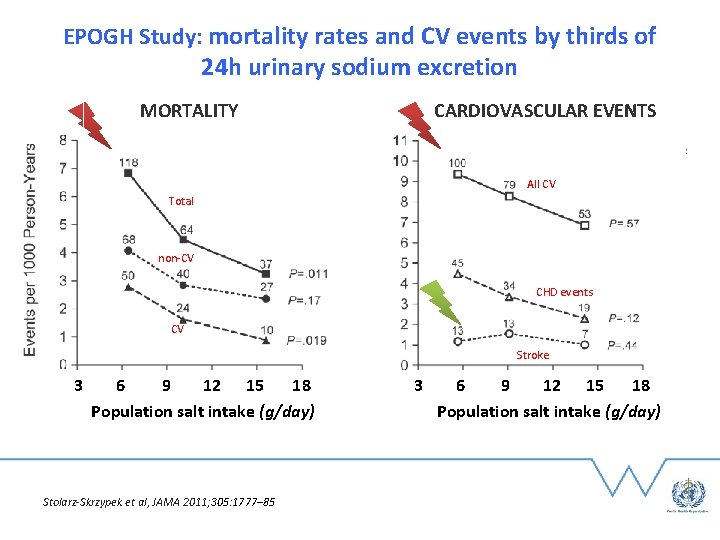
EPOGH Study: mortality rates and CV events by thirds of 24 h urinary sodium excretion CARDIOVASCULAR EVENTS MORTALITY All CV Total non-CV CHD events CV Stroke 3 6 9 12 15 18 Population salt intake (g/day) Stolarz-Skrzypek et al, JAMA 2011; 305: 1777– 85 3 6 9 12 15 18 Population salt intake (g/day)
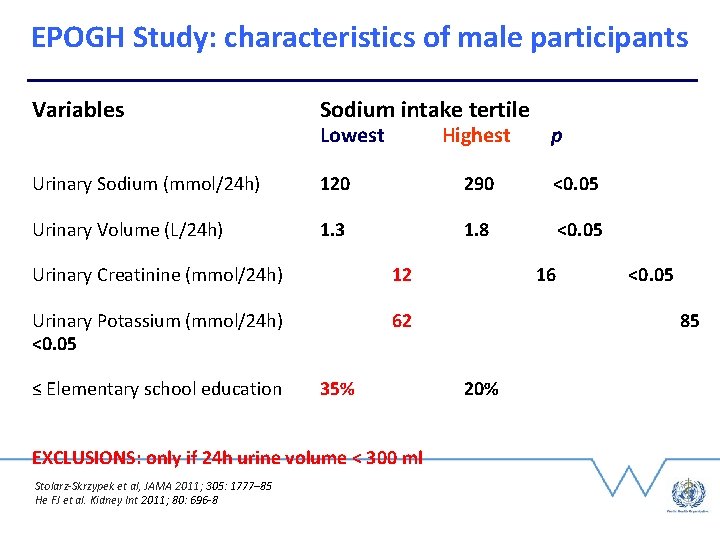
EPOGH Study: characteristics of male participants Variables Sodium intake tertile Urinary Sodium (mmol/24 h) 120 290 <0. 05 Urinary Volume (L/24 h) 1. 3 1. 8 <0. 05 Lowest Highest Urinary Creatinine (mmol/24 h) 12 Urinary Potassium (mmol/24 h) <0. 05 62 ≤ Elementary school education 35% EXCLUSIONS: only if 24 h urine volume < 300 ml Stolarz-Skrzypek et al, JAMA 2011; 305: 1777– 85 He FJ et al. Kidney Int 2011; 80: 696 -8 p 16 <0. 05 85 20%
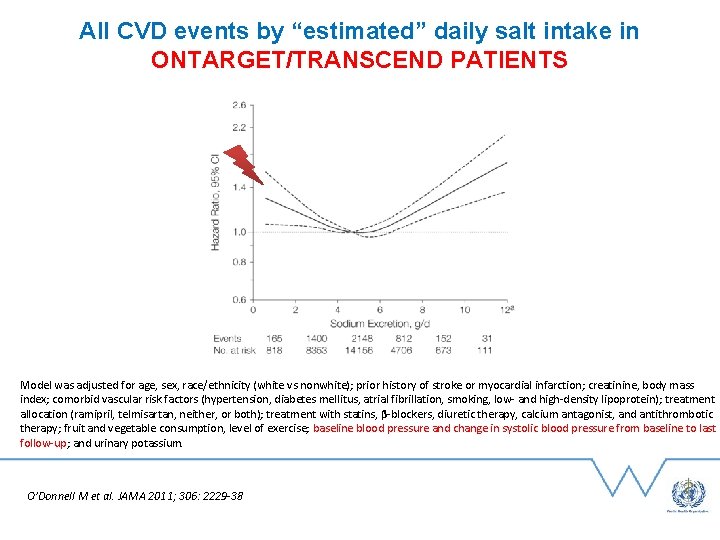
All CVD events by “estimated” daily salt intake in ONTARGET/TRANSCEND PATIENTS Model was adjusted for age, sex, race/ethnicity (white vs nonwhite); prior history of stroke or myocardial infarction; creatinine, body mass index; comorbid vascular risk factors (hypertension, diabetes mellitus, atrial fibrillation, smoking, low- and high-density lipoprotein); treatment allocation (ramipril, telmisartan, neither, or both); treatment with statins, β-blockers, diuretic therapy, calcium antagonist, and antithrombotic therapy; fruit and vegetable consumption, level of exercise; baseline blood pressure and change in systolic blood pressure from baseline to last follow-up; and urinary potassium. O’Donnell M et al. JAMA 2011; 306: 2229 -38
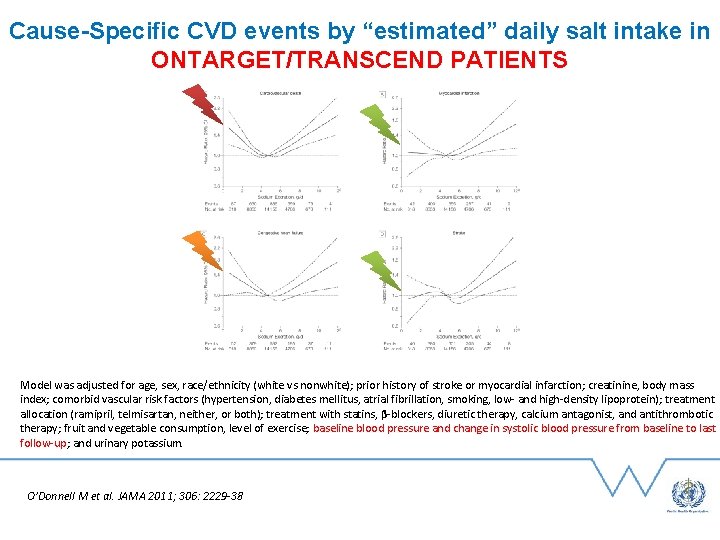
Cause-Specific CVD events by “estimated” daily salt intake in ONTARGET/TRANSCEND PATIENTS Model was adjusted for age, sex, race/ethnicity (white vs nonwhite); prior history of stroke or myocardial infarction; creatinine, body mass index; comorbid vascular risk factors (hypertension, diabetes mellitus, atrial fibrillation, smoking, low- and high-density lipoprotein); treatment allocation (ramipril, telmisartan, neither, or both); treatment with statins, β-blockers, diuretic therapy, calcium antagonist, and antithrombotic therapy; fruit and vegetable consumption, level of exercise; baseline blood pressure and change in systolic blood pressure from baseline to last follow-up; and urinary potassium. O’Donnell M et al. JAMA 2011; 306: 2229 -38
All CVD events by “estimated” daily salt intake in ONTARGET/TRANSCEND PATIENTS • Old and sick patients in secondary prevention 70% hypertensives 37% diabetics 48% hypertensives with previous MI 21% previous stroke / TIA 3% AF (9% at follow-up) • Multiple medications (overall 29% BUT …. 41% in the lowest sodium category) • Inaccurate estimate of sodium intake, based on ‘spot urine samples’ using Kawasaki equation O’Donnell M et al. JAMA 2011; 306: 2229 -38
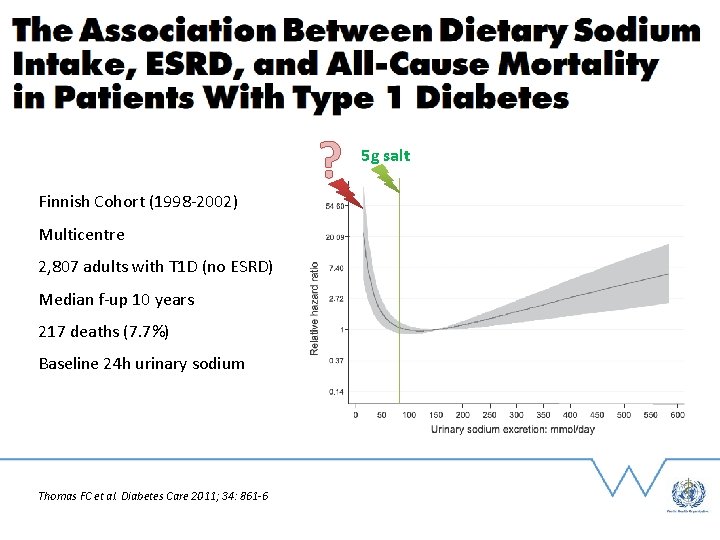
Finnish Cohort (1998 -2002) Multicentre 2, 807 adults with T 1 D (no ESRD) Median f-up 10 years 217 deaths (7. 7%) Baseline 24 h urinary sodium Thomas FC et al. Diabetes Care 2011; 34: 861 -6 ? 5 g salt
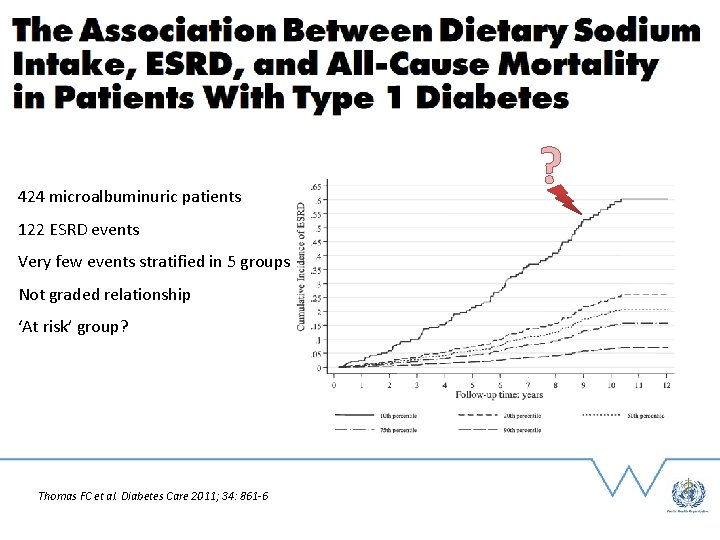
424 microalbuminuric patients 122 ESRD events Very few events stratified in 5 groups Not graded relationship ‘At risk’ group? Thomas FC et al. Diabetes Care 2011; 34: 861 -6 ?
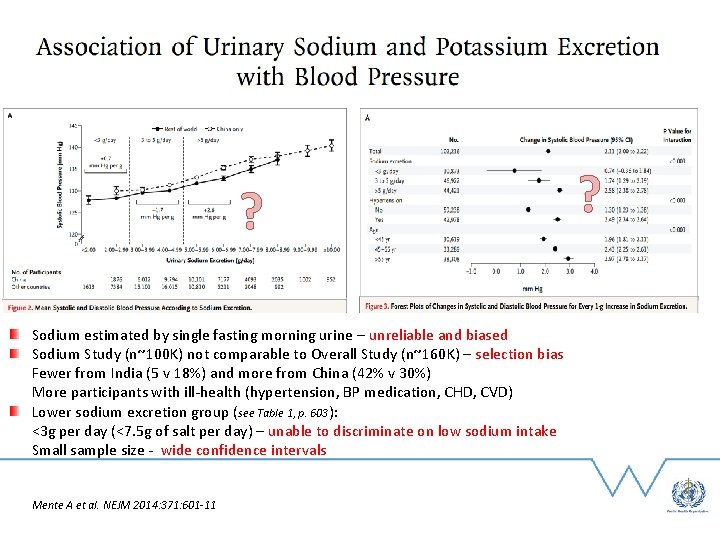
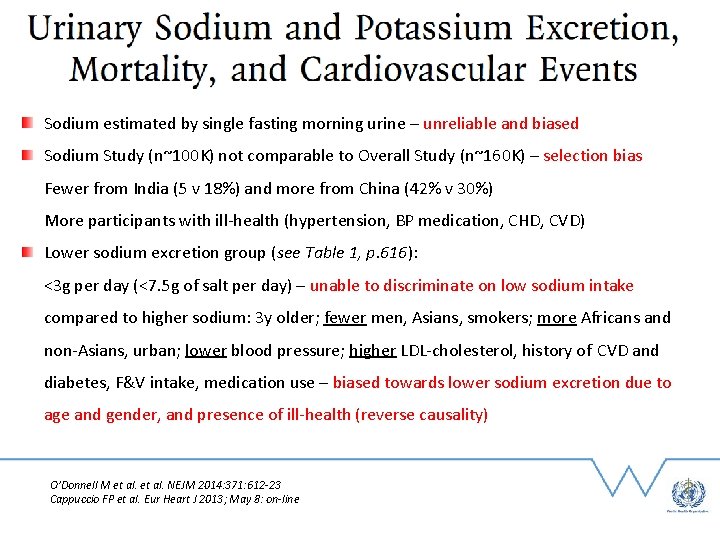
? Sodium estimated by single fasting morning urine – unreliable and biased Sodium Study (n~100 K) not comparable to Overall Study (n~160 K) – selection bias Fewer from India (5 v 18%) and more from China (42% v 30%) More participants with ill-health (hypertension, BP medication, CHD, CVD) Lower sodium excretion group (see Table 1, p. 603): <3 g per day (<7. 5 g of salt per day) – unable to discriminate on low sodium intake Small sample size - wide confidence intervals Mente A et al. NEJM 2014: 371: 601 -11 ?
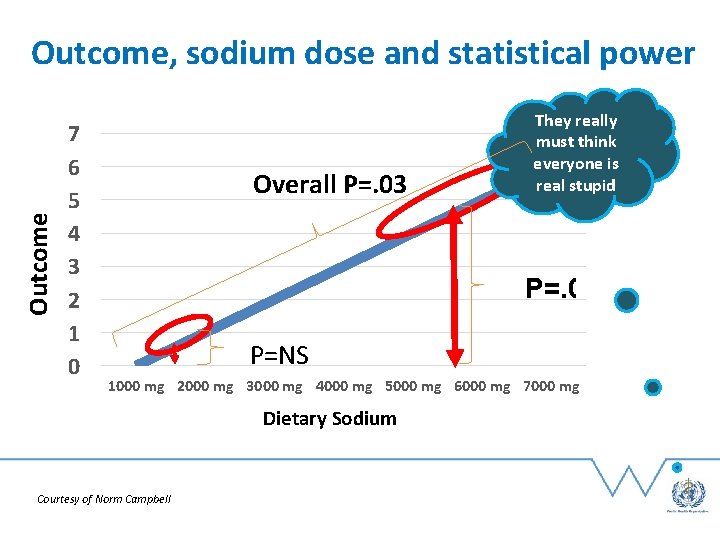
Outcome, sodium dose and statistical power 7 6 5 4 3 2 1 0 Overall P=. 03 They really must think everyone is real stupid P=. 01 P=NS 1000 mg 2000 mg 3000 mg 4000 mg 5000 mg 6000 mg 7000 mg Dietary Sodium Courtesy of Norm Campbell
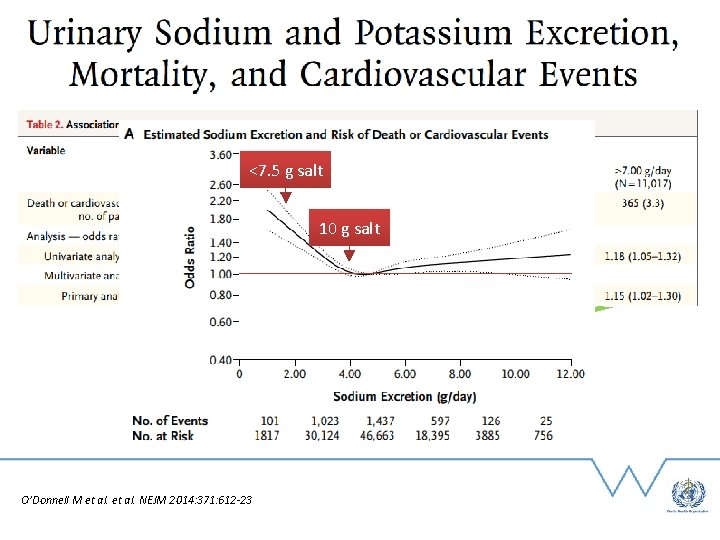
<7. 5 g salt 10 g salt O’Donnell M et al. NEJM 2014: 371: 612 -23
Sodium estimated by single fasting morning urine – unreliable and biased Sodium Study (n~100 K) not comparable to Overall Study (n~160 K) – selection bias Fewer from India (5 v 18%) and more from China (42% v 30%) More participants with ill-health (hypertension, BP medication, CHD, CVD) Lower sodium excretion group (see Table 1, p. 616): <3 g per day (<7. 5 g of salt per day) – unable to discriminate on low sodium intake compared to higher sodium: 3 y older; fewer men, Asians, smokers; more Africans and non-Asians, urban; lower blood pressure; higher LDL-cholesterol, history of CVD and diabetes, F&V intake, medication use – biased towards lower sodium excretion due to age and gender, and presence of ill-health (reverse causality) O’Donnell M et al. NEJM 2014: 371: 612 -23 Cappuccio FP et al. Eur Heart J 2013; May 8: on-line
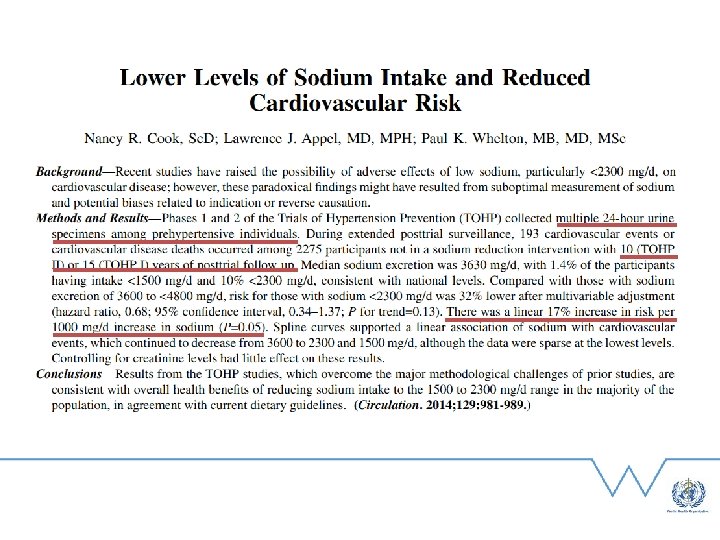
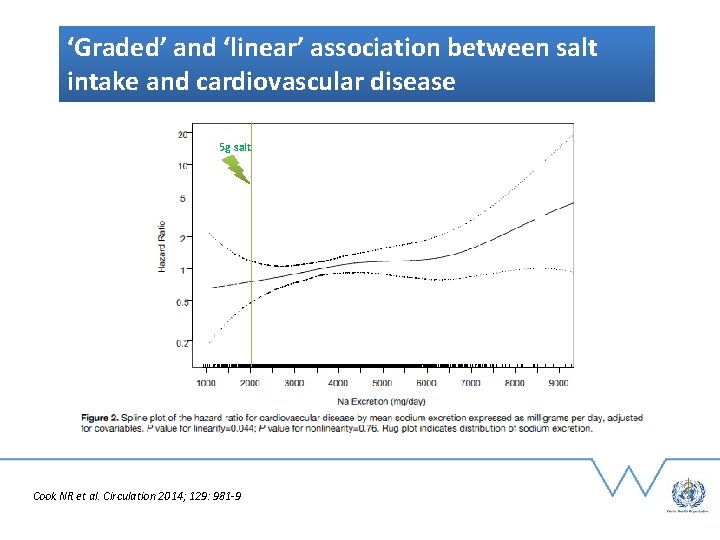
‘Graded’ and ‘linear’ association between salt intake and cardiovascular disease 5 g salt Cook NR et al. Circulation 2014; 129: 981 -9
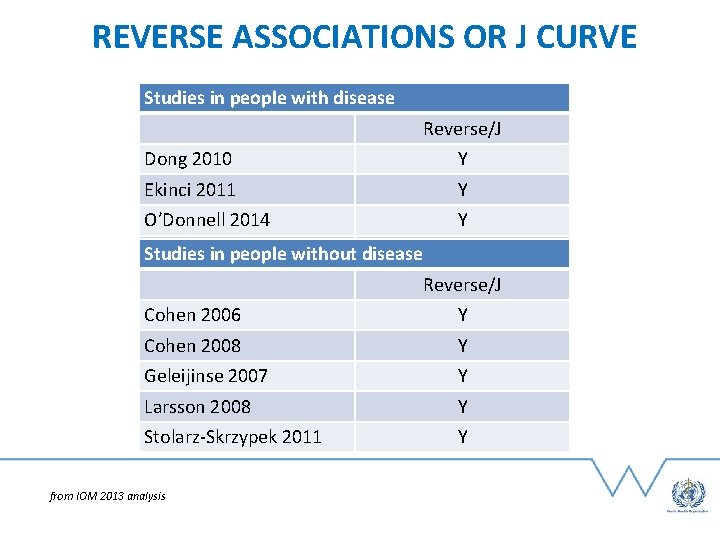
REVERSE ASSOCIATIONS OR J CURVE Studies in people with disease Reverse/J Dong 2010 Y Ekinci 2011 Y O’Donnell 2014 Y Y Tikellis Studies 2013* in people without disease Y Lennie 2011 Reverse/J Cohen 2006 Y Cohen 2008 Y Geleijinse 2007 Y Larsson 2008 Y Stolarz-Skrzypek 2011 Y from IOM 2013 analysis
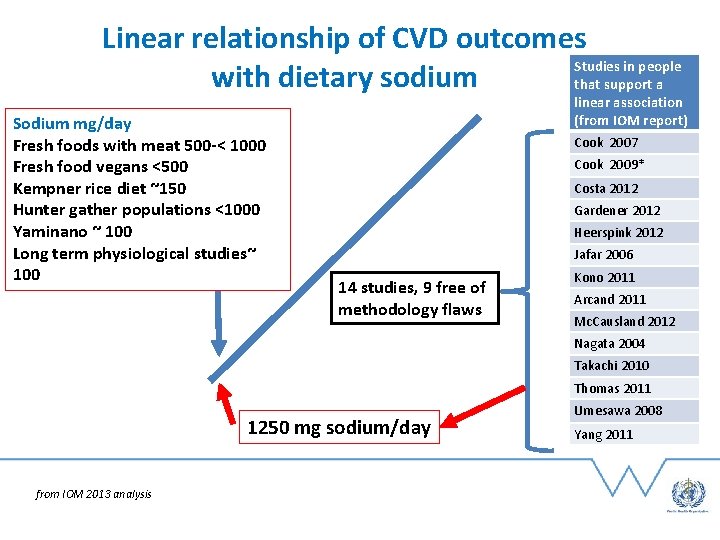
Linear relationship of CVD outcomes Studies in people with dietary sodium that support a Sodium mg/day Fresh foods with meat 500 -< 1000 Fresh food vegans <500 Kempner rice diet ~150 Hunter gather populations <1000 Yaminano ~ 100 Long term physiological studies~ 100 linear association (from IOM report) Cook 2007 Cook 2009* Costa 2012 Gardener 2012 Heerspink 2012 Jafar 2006 14 studies, 9 free of methodology flaws Kono 2011 Arcand 2011 Mc. Causland 2012 Nagata 2004 Takachi 2010 Thomas 2011 1250 mg sodium/day from IOM 2013 analysis Umesawa 2008 Yang 2011
Salt – Blood Pressure – CVD Model SALT BP HOW FAR SHOULD WE GO WITH REDUCTION OF SALT INTAKE? THE LOWER THE BETTER ? CVD
Role of salt in hypertension and CVD overestimated? A RANDOMIZED CONTROLLED TRIAL OF SALT INTAKE REDUCTION AND CVD MORTALITY ? IS IT FEASIBLE?
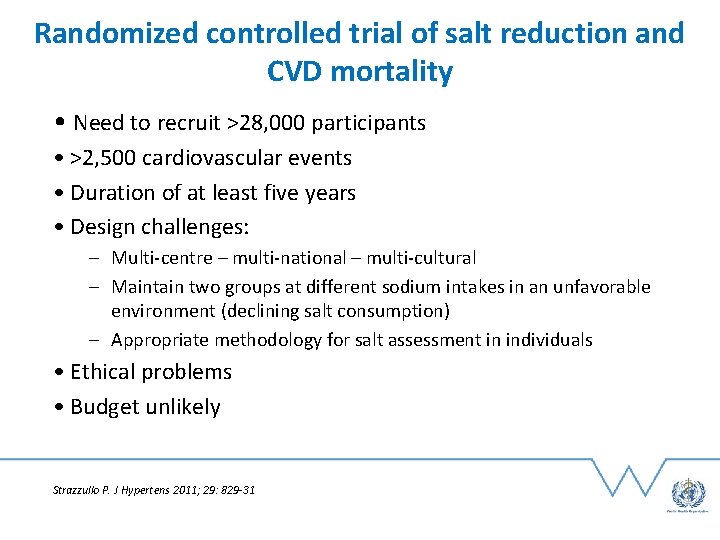
Randomized controlled trial of salt reduction and CVD mortality • Need to recruit >28, 000 participants • >2, 500 cardiovascular events • Duration of at least five years • Design challenges: – Multi-centre – multi-national – multi-cultural – Maintain two groups at different sodium intakes in an unfavorable environment (declining salt consumption) – Appropriate methodology for salt assessment in individuals • Ethical problems • Budget unlikely Strazzullo P. J Hypertens 2011; 29: 829 -31
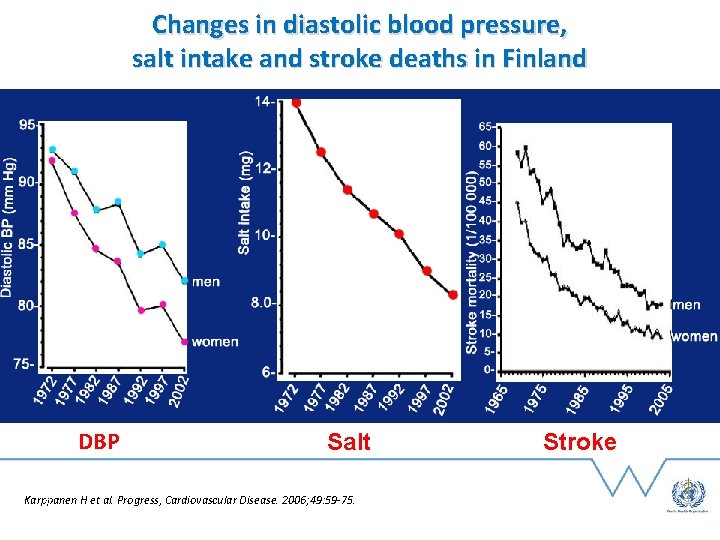
Changes in diastolic blood pressure, salt intake and stroke deaths in Finland 5600 mg 3360 mg DBP Salt Karppanen H et al. Progress, Cardiovascular Disease. 2006; 49: 59 -75. 37 Stroke
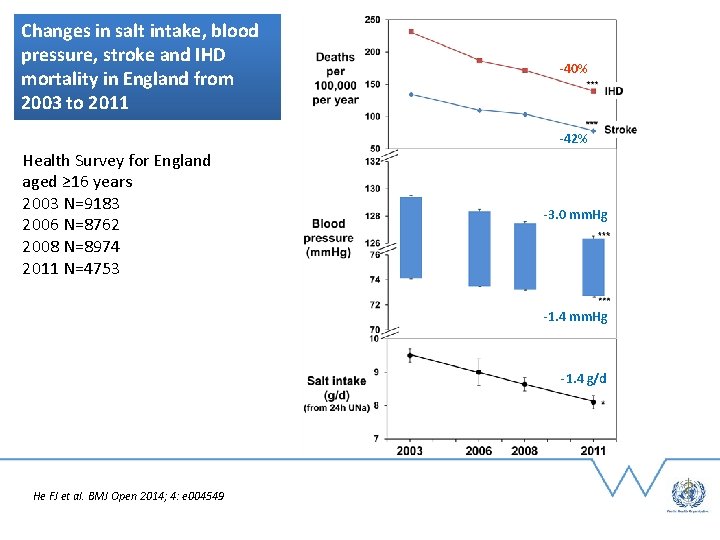
Changes in salt intake, blood pressure, stroke and IHD mortality in England from 2003 to 2011 -40% -42% Health Survey for England aged ≥ 16 years 2003 N=9183 2006 N=8762 2008 N=8974 2011 N=4753 -3. 0 mm. Hg -1. 4 g/d He FJ et al. BMJ Open 2014; 4: e 004549
“What is truly meaningful in life is inversely related to what is measurable”