
Stata and SPSS compared The views of one
- Slides: 21
Stata and SPSS compared: The views of one teacher and 140 students Presented at workshop on Software Choice for Teachers of Quantitative Methods for Social Science, Oxford, June 2014 Rob Johns rajohn@essex. ac. uk
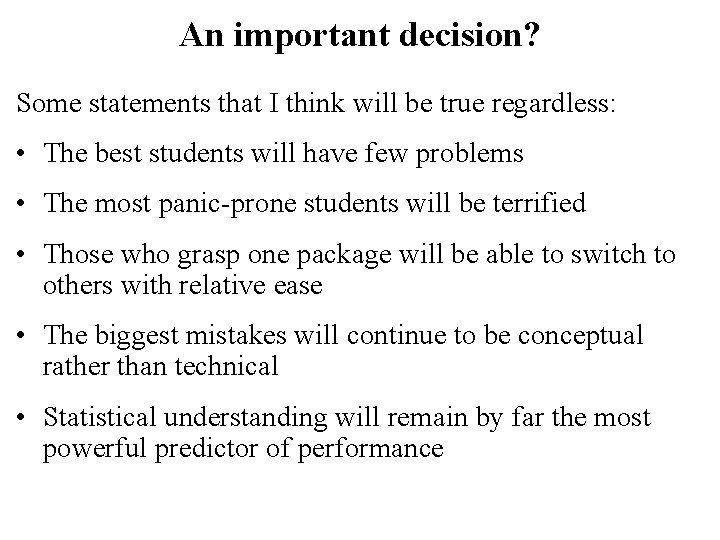
An important decision? Some statements that I think will be true regardless: • The best students will have few problems • The most panic-prone students will be terrified • Those who grasp one package will be able to switch to others with relative ease • The biggest mistakes will continue to be conceptual rather than technical • Statistical understanding will remain by far the most powerful predictor of performance
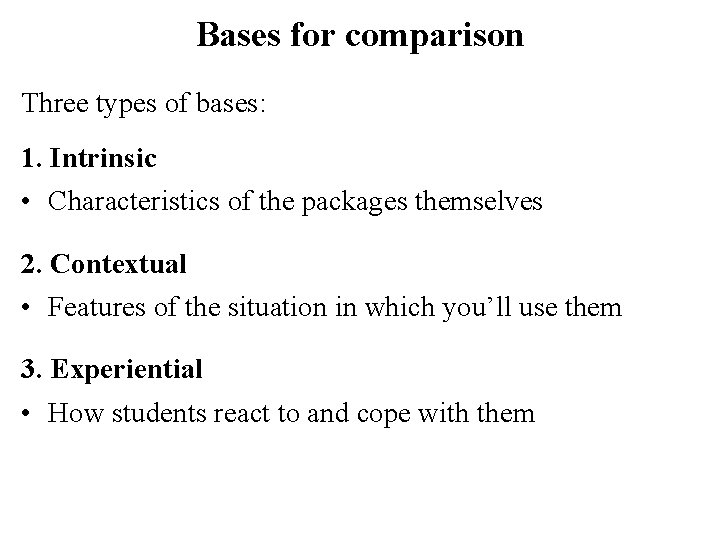
Bases for comparison Three types of bases: 1. Intrinsic • Characteristics of the packages themselves 2. Contextual • Features of the situation in which you’ll use them 3. Experiential • How students react to and cope with them
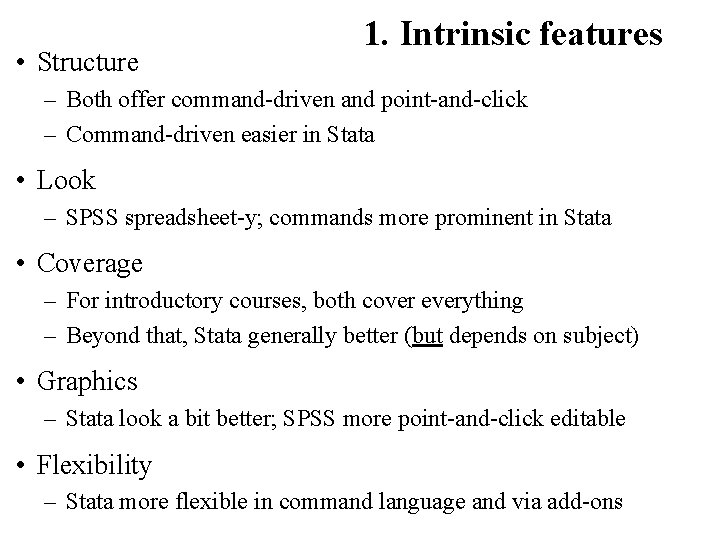
• Structure 1. Intrinsic features – Both offer command-driven and point-and-click – Command-driven easier in Stata • Look – SPSS spreadsheet-y; commands more prominent in Stata • Coverage – For introductory courses, both cover everything – Beyond that, Stata generally better (but depends on subject) • Graphics – Stata look a bit better; SPSS more point-and-click editable • Flexibility – Stata more flexible in command language and via add-ons
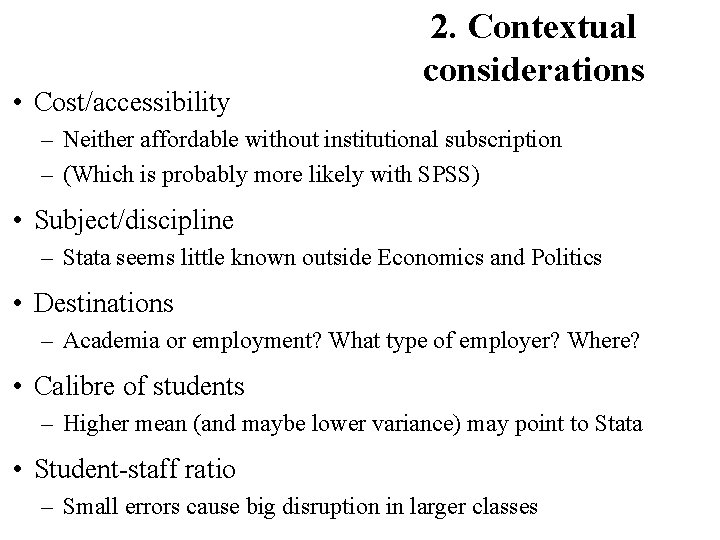
• Cost/accessibility 2. Contextual considerations – Neither affordable without institutional subscription – (Which is probably more likely with SPSS) • Subject/discipline – Stata seems little known outside Economics and Politics • Destinations – Academia or employment? What type of employer? Where? • Calibre of students – Higher mean (and maybe lower variance) may point to Stata • Student-staff ratio – Small errors cause big disruption in larger classes
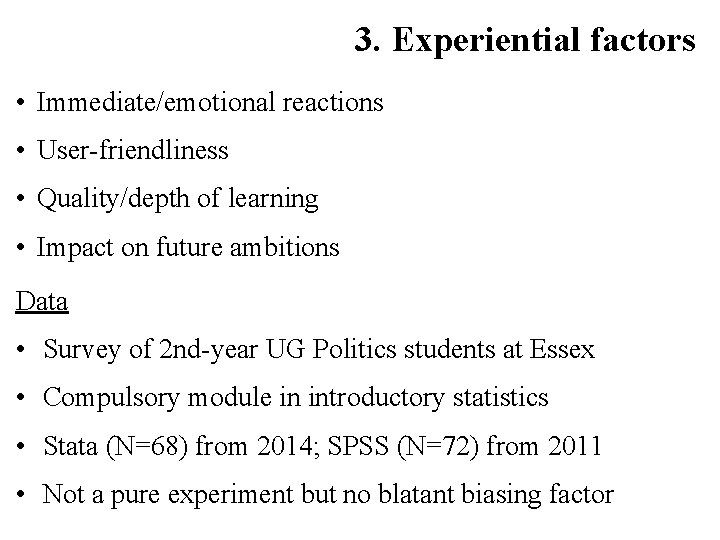
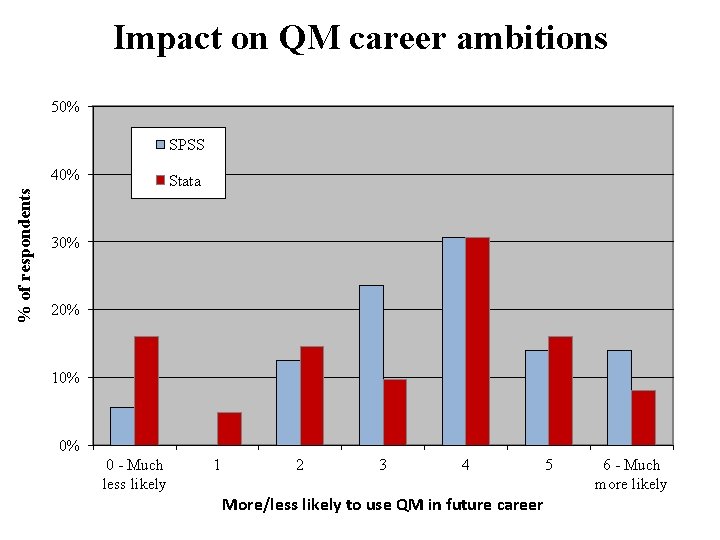
3. Experiential factors • Immediate/emotional reactions • User-friendliness • Quality/depth of learning • Impact on future ambitions Data • Survey of 2 nd-year UG Politics students at Essex • Compulsory module in introductory statistics • Stata (N=68) from 2014; SPSS (N=72) from 2011 • Not a pure experiment but no blatant biasing factor
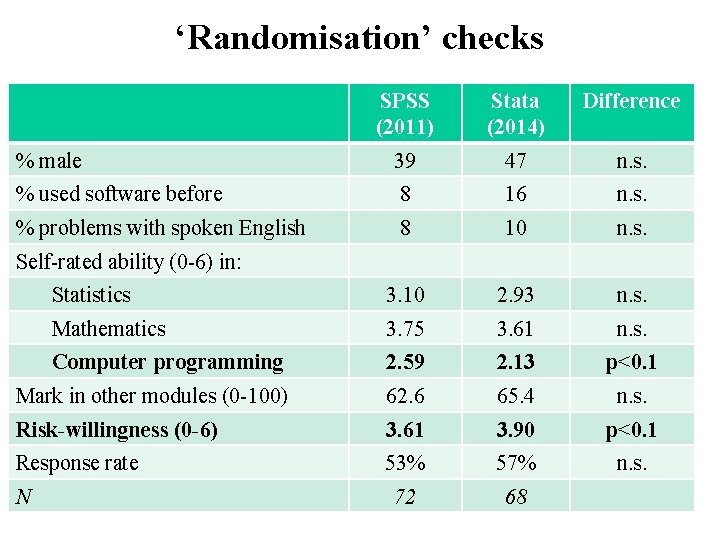
‘Randomisation’ checks SPSS (2011) Stata (2014) Difference % male 39 47 n. s. % used software before 8 16 n. s. % problems with spoken English 8 10 n. s. Statistics 3. 10 2. 93 n. s. Mathematics 3. 75 3. 61 n. s. Computer programming 2. 59 2. 13 p<0. 1 Mark in other modules (0 -100) 62. 6 65. 4 n. s. Risk-willingness (0 -6) 3. 61 3. 90 p<0. 1 Response rate 53% 57% n. s. 72 68 Self-rated ability (0 -6) in: N
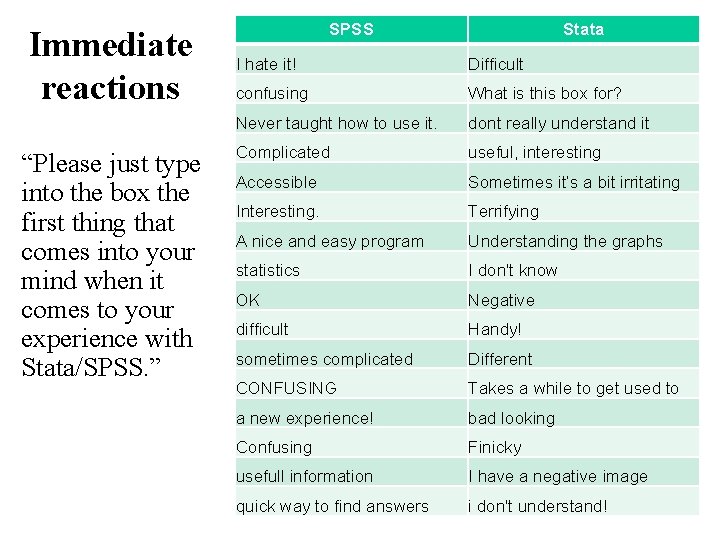
Immediate reactions “Please just type into the box the first thing that comes into your mind when it comes to your experience with Stata/SPSS. ” SPSS Stata I hate it! Difficult confusing What is this box for? Never taught how to use it. dont really understand it Complicated useful, interesting Accessible Sometimes it’s a bit irritating Interesting. Terrifying A nice and easy program Understanding the graphs statistics I don't know OK Negative difficult Handy! sometimes complicated Different CONFUSING Takes a while to get used to a new experience! bad looking Confusing Finicky usefull information I have a negative image quick way to find answers i don't understand!
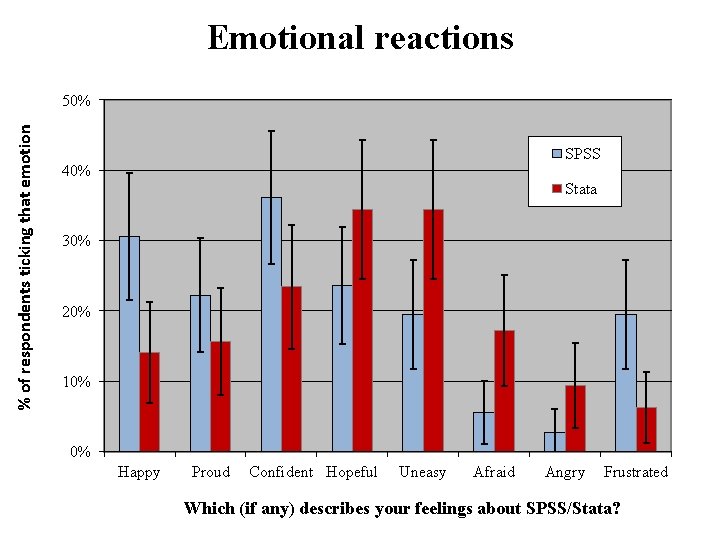
Emotional reactions % of respondents ticking that emotion 50% SPSS 40% Stata 30% 20% 10% 0% Happy Proud Confident Hopeful Uneasy Afraid Angry Frustrated Which (if any) describes your feelings about SPSS/Stata?
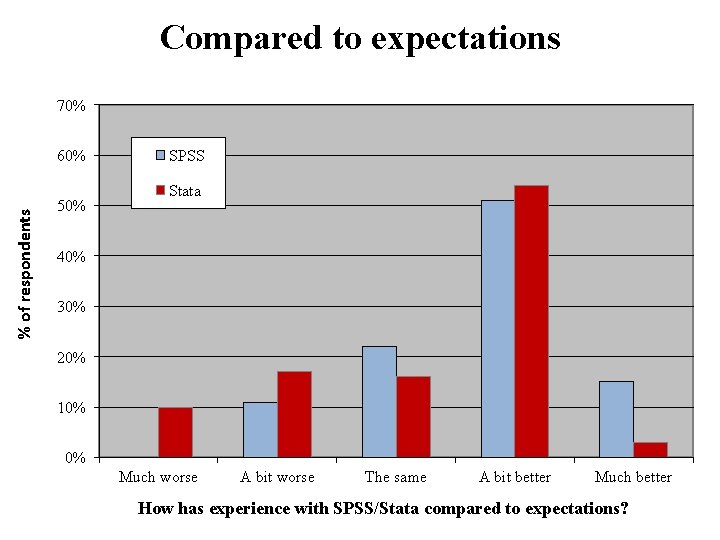
Compared to expectations 70% % of respondents 60% 50% SPSS Stata 40% 30% 20% 10% 0% Much worse A bit worse The same A bit better Much better How has experience with SPSS/Stata compared to expectations?
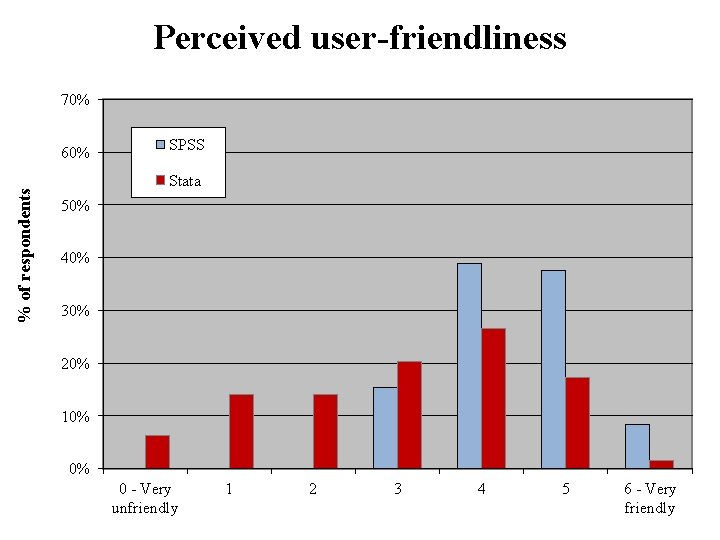
Perceived user-friendliness 70% % of respondents 60% SPSS Stata 50% 40% 30% 20% 10% 0% 0 - Very unfriendly 1 2 3 4 5 6 - Very friendly
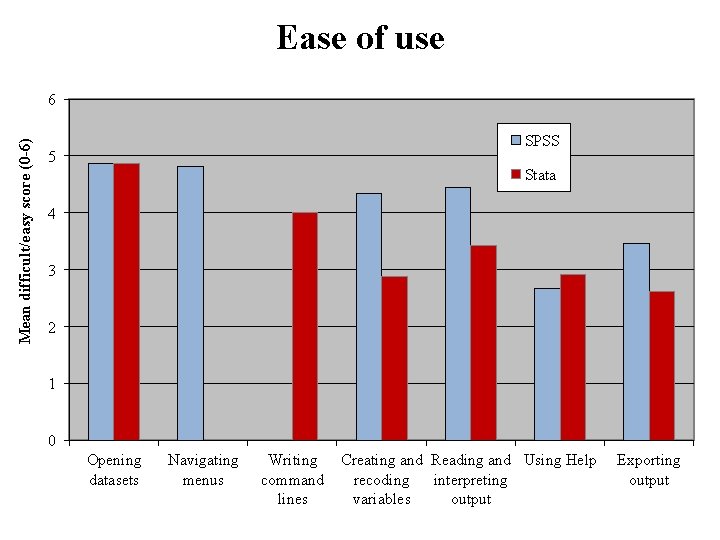
Ease of use Mean difficult/easy score (0 -6) 6 SPSS 5 Stata 4 3 2 1 0 Opening datasets Navigating menus Writing command lines Creating and Reading and Using Help recoding interpreting variables output Exporting output
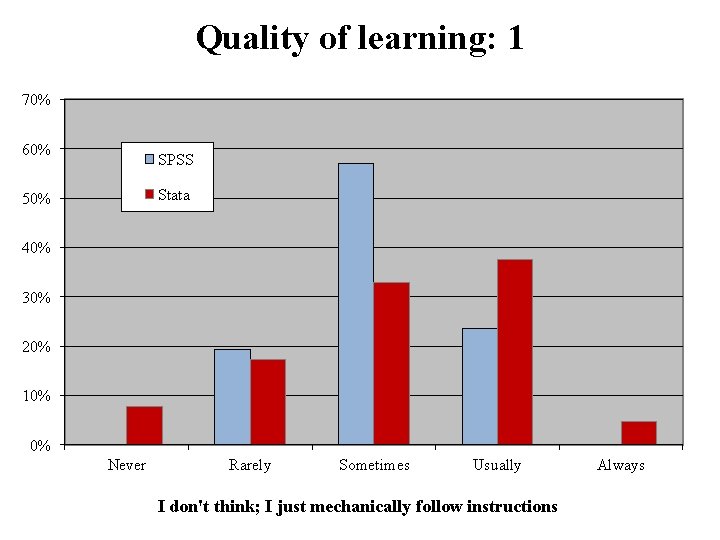
Quality of learning: 1 70% 60% SPSS Stata 50% 40% 30% 20% 10% 0% Never Rarely Sometimes Usually I don't think; I just mechanically follow instructions Always
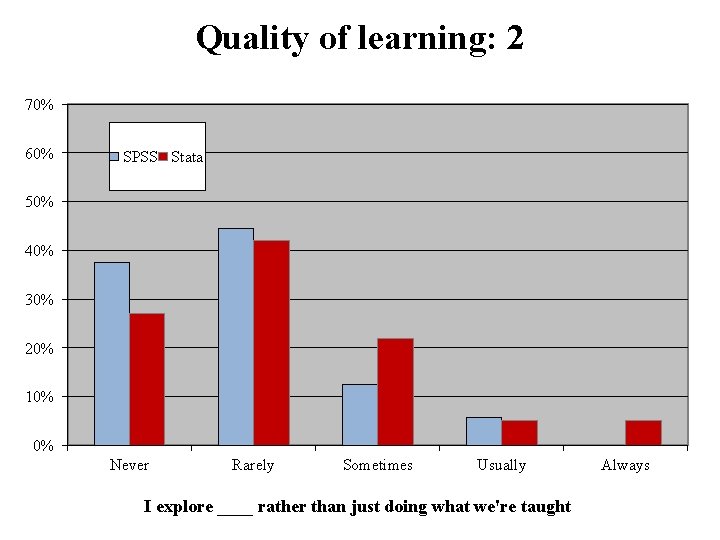
Quality of learning: 2 70% 60% SPSS Stata 50% 40% 30% 20% 10% 0% Never Rarely Sometimes Usually I explore ____ rather than just doing what we're taught Always
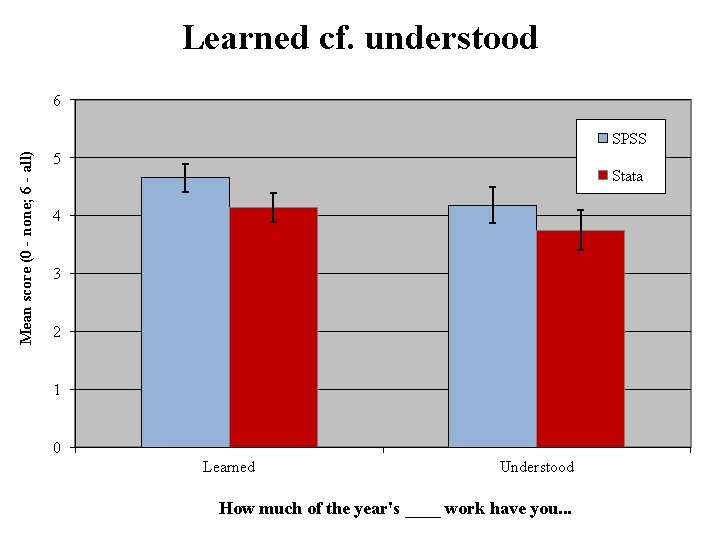
Learned cf. understood 6 Mean score (0 - none; 6 - all) SPSS 5 Stata 4 3 2 1 0 Learned Understood How much of the year's ____ work have you. . .
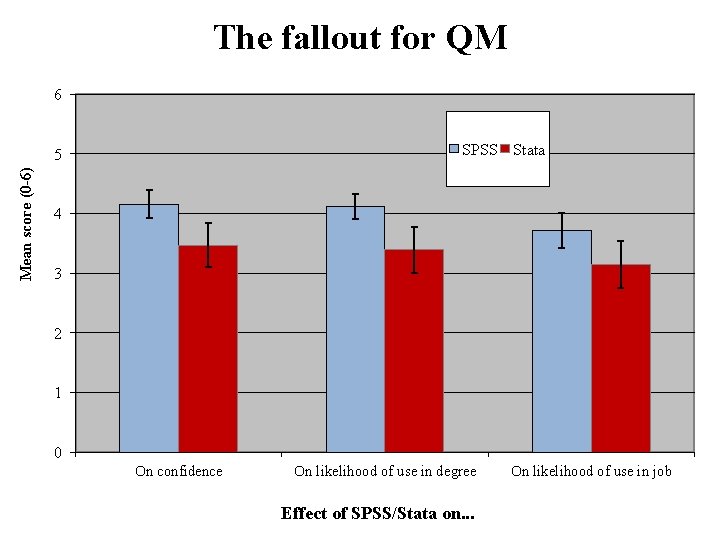
The fallout for QM 6 SPSS Stata Mean score (0 -6) 5 4 3 2 1 0 On confidence On likelihood of use in degree Effect of SPSS/Stata on. . . On likelihood of use in job
Impact on QM career ambitions 50% SPSS % of respondents 40% Stata 30% 20% 10% 0% 0 - Much less likely 1 2 3 4 More/less likely to use QM in future career 5 6 - Much more likely
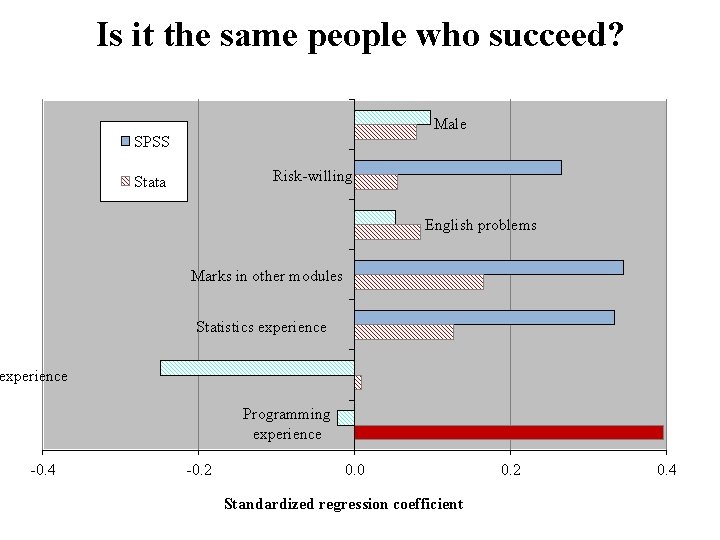
Is it the same people who succeed? Male SPSS Risk-willing Stata English problems Marks in other modules Statistics experience Programming experience -0. 4 -0. 2 0. 0 Standardized regression coefficient 0. 2 0. 4
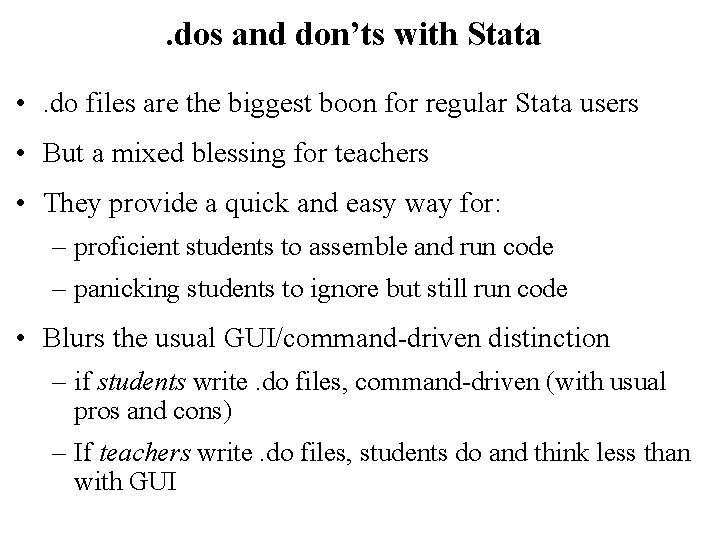
. dos and don’ts with Stata • . do files are the biggest boon for regular Stata users • But a mixed blessing for teachers • They provide a quick and easy way for: – proficient students to assemble and run code – panicking students to ignore but still run code • Blurs the usual GUI/command-driven distinction – if students write. do files, command-driven (with usual pros and cons) – If teachers write. do files, students do and think less than with GUI
Conclusions • First: it doesn’t matter that much • The teaching and use of the software matters more than the choice • Insofar as the choice matters, a lot depends on the audience: – its capacities – and your ambitions for it • Where heterogeneity demands it (and GTA supply permits it)… • …a dual strategy can be workable and effective
Stata and SPSS compared: The views of one teacher and 140 students Presented at workshop on Software Choice for Teachers of Quantitative Methods for Social Science, Oxford, June 2014 Rob Johns rajohn@essex. ac. uk