STAT 254 lecture 1 An overview Cell biology

STAT 254 -lecture 1 An overview • • Cell biology, microarray, statistics Bioinformatics and Statistics Topics to cover Keep a skeptical eye on everything you read or hear • Keep an eye on bigger picture; while working on specifics • The shaping of bioinformatics falls on your shoulders • What to take home : not just microarray, or high throughput data analysis methods, but a set of skills, ways of thinking about quantitative biology

20 min Exploratory data analysis multivariate high dimensional

IMS ENAR Conference Time : March 31, 2003 Place: Tampa, FL Study of Gene Expression: Statistics, Biology, and Microarrays Ker-Chau Li Statistics Department UCLA kcli@stat. ucla. edu

Outline • Review of cell biology Microarray gene expression data collection • Cell-cycle gene expression (Main Data set) • PCA/Nested regression; SIR (Dim. red. ) • Similarity analysis - clustering (Why Popular? ) • Liquid association • Closing remarks New statistical concept, fueled by Stein’s lemma Justification for IMS

PART I. Cellular Biology Macromolecules: DNA, m. RNA, protein

Why Biology hot? Because of

Human Genome Project Begun in 1990, the U. S. Human Genome Project is a 13 -year effort coordinated by the U. S. Department of Energy and the National Institutes of Health. The project originally was planned to last 15 years, but effective resource and technological advances have accelerated the expected completion date to 2003. Project goals are to ■ identify all the approximate 30, 000 genes in human DNA, ■ determine the sequences of the 3 billion chemical base pairs that make up human DNA, ■ store this information in databases, ■ improve tools for data analysis, ■ transfer related technologies to the private sector, and ■ address the ethical, legal, and social issues (ELSI) that may arise from the project. Recent Milestones: ■ June 2000 completion of a working draft of the entire human genome ■ February 2001 analyses of the working draft are published Human Genome Program, U. S. Department of Energy, Genomics and Its Impact on Medicine and Society: A 2001 Primer, 2001

Future Challenges: What We Still Don’t Know • Predicted vs experimentally determined gene function {1} • Gene regulation {2} (upstream regulatory region) • Coordination of gene expression, protein synthesis, and posttranslational events {3} • Gene number, exact locations, and functions • DNA sequence organization • Chromosomal structure and organization • Noncoding DNA types, amount, distribution, information content, and functions • Interaction of proteins in complex molecular machines • Evolutionary conservation among organisms • Protein conservation (structure and function) • Proteomes (total protein content and function) in organisms • Correlation of SNPs (single-base DNA variations among individuals) with health and disease • Disease-susceptibility prediction based on gene sequence variation • Genes involved in complex traits and multigene diseases • Complex systems biology including microbial consortia useful for environmental restoration • Developmental genetics, genomics Human Genome Program, U. S. Department of Energy, Genomics and Its Impact on Medicine and Society: A 2001 Primer, 2001

Medicine and the New Genomics • Gene Testing • Gene Therapy • Pharmacogenomics Anticipated Benefits • improved diagnosis of disease • earlier detection of genetic predispositions to disease • rational drug design • gene therapy and control systems for drugs • personalized, custom drugs Human Genome Program, U. S. Department of Energy, Genomics and Its Impact on Medicine and Society: A 2001 Primer, 2001

Anticipated Benefits Agriculture, Livestock Breeding, and Bioprocessing • disease-, insect-, and drought-resistant crops • healthier, more productive, disease-resistant farm animals • more nutritious produce • biopesticides • edible vaccines incorporated into food products • new environmental cleanup uses for plants like tobacco Human Genome Program, U. S. Department of Energy, Genomics and Its Impact on Medicine and Society: A 2001 Primer, 2001

How does the cell work? The guiding principle is the so-called

Human Genome Program, U. S. Department of Energy, Genomics and Its Impact on Medicine and Society: A 2001 Primer, 2001

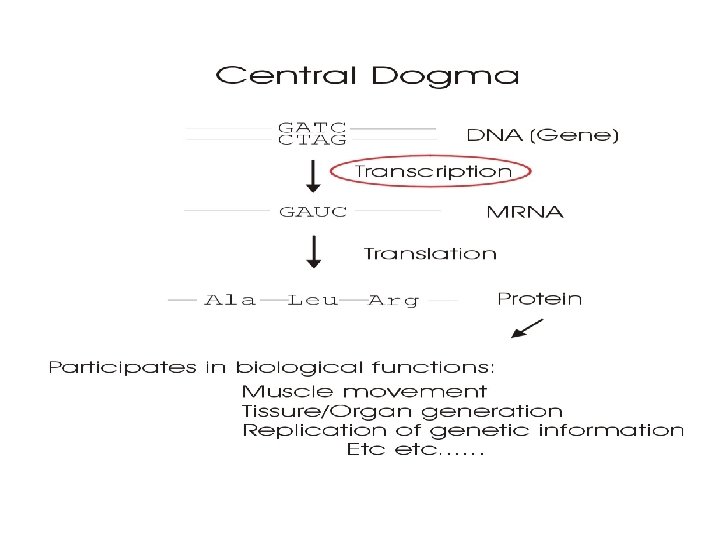
Gene to protein 4 Nucleotides and 20 amino acids Protein is synthesized from amino acids by ribosome

Gene to Protein Transcription Translation

Transcription and translation

PART II. Microarray Genome-wide expression profiling

Exploring the Metabolic and Genetic Control of Gene Expression on a Genomic Scale Joseph L. De. Risi, Vishwanath R. Iyer, Patrick O. Brown*

Microarray

Micro. Array • Allows measuring the m. RNA level of thousands of genes in one experiment -- system level response • The data generation can be fully automated by robots • Common experimental themes: –Time Course (when) –Tissue Type (where) –Response (under what conditions) –Perturbation: Mutation/Knockout, Knock-in Over-expression

Reverse-transcription Color : cy 3, cy 5 green, red

5 min Example 1 Comparative expression Normal versus cancer cells ALL versus AML E. Lander’s group at MIT

PART III. Statistics Low-level analysis Comparative expression Feature extraction Clustering/classification Pearson correlation Liquid association
 Issues related to image qualities • • • Convert an")
(not to be covered) Issues related to image qualities • • • Convert an image into a number representing the ratio of the levels of expression between red and green channels Color bias Spatial, tip, spot effects Background noises c. DNA, oligonucleotide arrays,

Genome-wide expression profile A basic structure cond 1 cond 2 ……. . condp Gene 1 x 12 ……. . x 1 p Gene 2 x 21 x 22 ……. . x 2 p … …. . . Genen xn 1 xn 2 ……. . xnp

Cond 1, cond 2, …, condp denote various environmental conditions, time points, cell types, etc. under which m. RNA samples are taken Note : numerous cells are involved Data quality issues : 1. chip (manufacturer) 2. m. RNA sample (user) It is important to have a homogeneous sample so that cellular signals can be amplified Yeast Cell Cycle data : ideally all cells are engaged in the same activities- synchronization
 AML(acute myeloid leukemia)")
An application Two classes problem ALL (acute lymphoblastic leukemia) AML(acute myeloid leukemia)
 compute")
Which Genes to select? They have a method • For each gene (row) compute a score defined by sample mean of X - sample mean of Y divided by standard deviation of X + standard deviation of Y • X=ALL, Y=AML • Genes (rows) with highest scores are selected. That seems to work well. • 34 new leukemia samples • 29 are predicated with 100% accuracy; 5 weak predication cases Seems to work ! Improvement?

Study of cell-cycle regulated genes • Rate of cell growth and division varies • Yeast(120 min), insect egg(15 -30 min); nerve cell(no); fibroblast(healing wounds) • Regulation : irregular growth causes cancer • Goal : find what genes are expressed at each state of cell cycle • Yeast cells; Spellman et al (2000) • Fourier analysis: cyclic pattern
 Most visible event")
Yeast Cell Cycle (adapted from Molecular Cell Biology, Darnell et al) Most visible event
 ORF: YNL 031 C Time")
Example of the time curve: Histone Genes: (HTT 2) ORF: YNL 031 C Time course: Histone

EBP 2: YKL 172 W TSM 1: YCR 042 C YOR 263 C
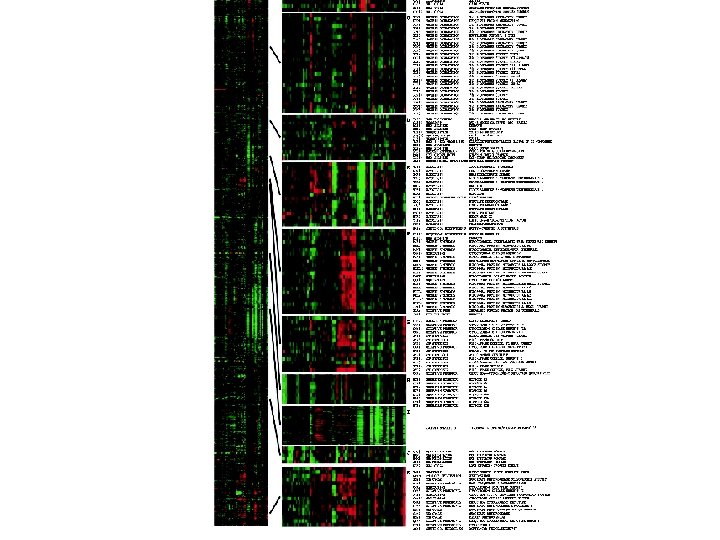

Why clustering make sense biologically? The rationale is Rationale behind massive gene expression analysis: Genes with high degree of expression similarity related and are likely to be functionally may participate in common pathways. They may be co-regulated regulatory factors. by common upstream Simply put, Profile similarity implies functional association

Protein rarely works as a single unit Some protein complexes

Gene profiles and correlation • Pearson's correlation coefficient, a simple way of describing the strength of linear association between a pair of random variables, has become the most popular measure of gene expression similarity. • 1. Cluster analysis: average linkage, self-organizing map, K-mean, . . . 2. Classification: nearest neighbor, linear discriminant analysis, support vector machine, … 3. Dimension reduction methods: PCA ( SVD)

CC has been used by Gauss, Bravais, Edgeworth … Sweeping impact in data analysis is due to Galton(1822 -1911) “Typical laws of heridity in man” Karl Pearson modifies and popularizes the use. A building block in multivariate analysis, of which clustering, classification, dim. reduct. are recurrent themes As a statistician, how can you ignore the time order ? (Isn’t it true that the use of sample correlation relies on the assumption that data are I. I. D. ? ? ? )
 indicator")
Other methods for Finding Gene clusters • Bayesian clustering : normal mixture, (hidden) indicator • PCA plot, projection pursuit, grand tour • Multi-Dimension Scaling( bi-plot for categorical responses, showing both cases (genes) and variables(different clustering methods), displaying results from many different clustering procedures) • Generalized association plot (Chen 2001, Statistica Sinica) • PLAID model ( Statistica Sinica 2002, Lazzeroni, Owen)


1 st PCA direction 2 nd PCA direction 3 rd PCA direction Eigenvalues

Phase Assignment Smooth Non-smooth G 1 108 S 31 S/G 2 352 G 1 103 S S/G 2 27 255 90 295 M/G 1 165 G 2/M 239 M/G 1 90 G 2/M

ARG 1 Glutamate ARG 2 Book a flight from LA to KEGG, JAPAN in less than 10 seconds
 for all Z")
ARG 1 8 th place negative Y X Compute LA(X, Y|Z) for all Z Adapted from KEGG Rank and find leading genes

Coverage of bioinformatics by areas | topics Sequence analysis DNA RNA Protein Linkage, pedigree Microarray Evolution SNP Alternative splicing Functional prediction Pathway discovery Promoter Motif Domain Drug Protein-protein 3 -D structure Protein -gene TRANSFAC EST System modeling Drug -gene protein
 Computer Statistician/m scientist athematician (raw data")
Coverage of Bioinformatics by expertise (hat, not person) Computer Statistician/m scientist athematician (raw data provider) (huge data volume) (Crude oil) Oil-refining (Noise, garbage, or ignorance? ) Make Data cleaning Data mining researcher’s life Pattern searching (Bio-information distilling/ easier (pipeline) Biologist /comparison Bio-data refining) Physical/Math/prob/stat Data base/ models, computer visualization optimization Literature searching Web page browsing Generalization Gene Ontology /inference

Math. Modeling : a nightmare m. RNA Observed m. RNA hidden Current m. RNA protein kinase ATP, GTP, c. AMP, etc Cytoplasm Nucleus localization Mitochondria Vacuolar DNA methylation, chromatin structure Nutrients- carbon, nitrogen sources Temperature Water Next F I T N E S S F U N C T I O N Statistical methods become useful
 • • • When Where Who What Why Cell level")
Bioinformatics (knowledge integration center) • • • When Where Who What Why Cell level Organism level Species level Ecology system level

Want to get a quick start ? Special issue on bioinformatics Statistica Sinica 2002 January My paper on liquid association : PNAS 2002, 99, 16875 -16880 Genome-wide co-expression dynamics: theory and application Classification: Biological Science, Genetics; Physical Science, Statistics

END

Cautionary Notes for Seriation and row-column sorting • Hierarchical clustering is popular, but • Sharp boundaries may be artifacts due to “clever” permutation • how to fine-tune user-specified parameters-need some theoretical guidance • What is a cluster ? Criteria needed

Popular methods for clustering/data mining • • Linkage : Eisen et al , Alon et al K-mean : Tavazoein et al Self-organizing map : Tamayo et al SVD : Holter et al; Alter, Brown, Botstein

Can statisticians take the lead? • • Difficult But not impossible The key : Willingness to learn more biology February 2002, Talk at UCLA Biochemistry, feedback from David Eisenberg; March 2002, David gave an inspiring review talk about several of his works (Nature, similarity)
- Slides: 55