Stat 112 Notes 18 Using and Interpreting Indicator
 •")


 for")


- Slides: 10
Stat 112 Notes 18 • Using and Interpreting Indicator Variables (Chapter 7. 1) • Information for Quiz on Tuesday: – Covers Lectures 13 -18, Homeworks 4 and 5. – I will have the homework 5’s available outside my office by Monday afternoon. – I will hold an extra office hour on Monday from 9 -10. – You can bring three sheets of notes, front and back. – Please bring a calculator as usual.
Comparing Toy Factory Managers • How do three managers Alice, Bob and Carol, compare in the average amount of time it takes them to complete a run of toys for a fixed run size?
• For a run size of length 100, the estimated time for run of Alice, Bob and Carol • For the same run size, Alice is estimated to be on average 38. 41 -(-14. 65)=53. 06 minutes slower than Bob and 38. 41 -(-23. 76)=62. 17 minutes slower than Carol.
• The regression plot under the Fit Model output shows E(Time|Run Size) for each of the three managers.
Effect Tests • • Effect test for manager: vs. Ha: At least two of manager[Alice], manager[Bob] and manager[Carol] are not equal. Null hypothesis is that all managers are the same (in terms of mean run time) when run size is held fixed, alternative hypothesis is that not all managers are the same (in terms of mean run time) when run size is held fixed. This is a partial F test. p-value for Effect Test <. 0001. Strong evidence that not all managers are the same when run size is held fixed. Note that is equivalent to because JMP has constraint that Manager[Alice]+Manager[Bob]+manager[Carol]=0. Effect test for Run size tests null hypothesis that Run Size coefficient is 0 versus alternative hypothesis that Run size coefficient isn’t zero. Same pvalue as t-test.
• Effect tests shows that managers are not equal. • For the same run size, Carol is best (lowest mean run time), followed by Bob and then Alice. • The above model assumes no interaction between Manager and run size – the difference between the mean run time of the managers is the same for all run sizes.
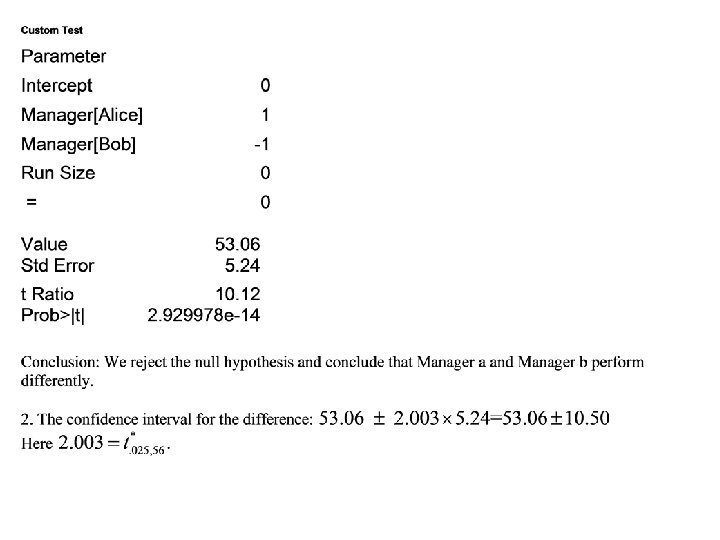
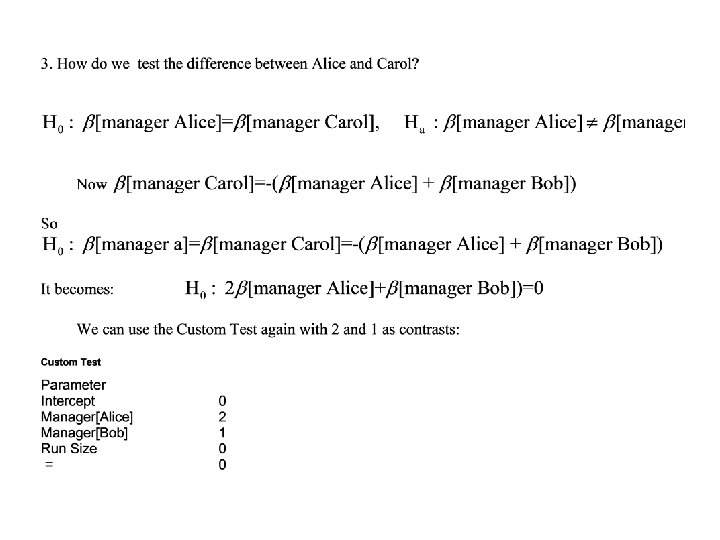
Testing for Differences Between Specific Managers
Inference for Differences of Coefficients in JMP