Starter Get out your cheat sheet for supply


 x 15%")


 Using the data from Extract A, construct a supply and demand diagram to")


- Slides: 47
Starter • Get out your cheat sheet for supply and demand. Did you include: • • Supply and demand graphs? Reasons why supply shifts? Key points on both graphs. Reasons why demand shifts?
Homework – Due Thursday 14 th • Work out the PED for each, and comment on your result. • The price of DVDs today is £ 200, and the quantity demanded is 4 m. Next year the price falls to £ 180 and the quantity demanded rises to 6 m. • The price of Pens today is £ 1, and the quantity demanded is 1 m. Next year the price rises to £ 1. 10 and the quantity demanded falls to 950, 000. • The price of The Times today is 40 p, and the quantity demanded is 2 m. Next year the price falls to 30 p and the quantity demanded rises to 2. 2 m
Question 1 Calculate the % change in price Price new – Price old x 100 180 -200/200 x 100 = -10% Calculate the % change in quantity (Q): New Q – Old Q x 100 6 -4/4 x 100 = 50% Then % change in Q / % change in P 50/-10= -5 >1 means that the demand is elastic,
Question 2 Calculate the % change in price Price new – Price old x 100 1. 10 -1/1 x 100 = 10% Calculate the % change in quantity (Q): New Q – Old Q x 100 950, 0001, 000/1000000 x 100 = -5% Then % change in Q / % change in P -5/10= -0. 5 <1 means that the demand is inelastic,
Question 3 Calculate the % change in price Price new – Price old x 100 30 -40/40 x 100 = -25% Calculate the % change in quantity (Q): New Q – Old Q x 100 2. 2 -2/2 x 100 = 10% Then % change in Q / % change in P 10/-25= -0. 4 <1 means that the demand is inelastic,
Sample question 1 Case study on next slide 1 mark for stating the formula 3 marks for making the calculation
Answer question 1 • Knowledge 1 mark for stating the formula • Calculation 3 marks: • Step 1 – what do we know? – We know from the question that the PED value is (-0. 8) – We know from the case study that the original price was £ 20 – We know from the question that the price has risen by £ 3
• Step 2 Find the % change in price: Price new – Price old 23 -20 20 X 100 3 20 15% x 100
• Step 3: Calculate % change in quantity demanded (-0. 8) x 15% (-12)% The final answer is: (-12)%
Activity • Draw and label a supply and demand curve.
Adjust your supply and demand curve
UK Car Market Price S 1 P 1 Demand Supply Scenarios D 1 Q 2 Quantity An increase in the population of car buyers aged 20 -70 1
UK Car Market Price S 1 P 2 P 1 D 2 Demand Right D 1 Q 2 Quantity An increase in the population of car buyers aged 20 -70
UK Car Market Price S 1 P 1 Demand Supply Scenarios D 1 Q 2 Quantity A reduction in subsidies given by the government to car firms 2
UK Car Market S 2 Price S 1 P 2 P 1 Supply Left D 1 Q 2 Quantity A reduction in subsidies given by the government to car firms
UK Car Market Price S 1 P 1 Demand Supply Scenarios D 1 Q 2 Quantity Increased road tax on cars 3
UK Car Market Price S 1 P 2 Demand Left D 1 D 2 Q 1 Quantity Increased road tax on cars
UK Car Market Price S 1 P 1 Demand Supply Scenarios D 1 Q 2 Quantity Increasing regulation requires all cars to be registered on a national database by manufacturers and assessed for a new quality certificate before being sold 4
UK Car Market S 2 Price S 1 P 2 P 1 Supply Left D 1 Q 2 Quantity Increasing regulation requires all cars to be registered on a national database by manufacturers and assessed for a new quality certificate before being sold
UK Car Market Price S 1 P 1 Demand Supply Scenarios D 1 Q 2 Quantity Improvement in high speed rail services and tram networks 5
UK Car Market Price S 1 P 2 Demand Left D 1 D 2 Q 1 Quantity Improvement in high speed rail services and tram networks
UK Car Market Price S 1 P 1 Demand Supply Scenarios D 1 Q 2 Quantity Increased petrol prices 6
UK Car Market Price S 1 P 2 Demand Left D 1 D 2 Q 1 Quantity Increased petrol prices
UK Car Market Price S 1 P 1 Demand Supply Scenarios D 1 Q 2 Quantity New law allows drivers to continue driving until 85 years old using existing licence (currently 70) 7
UK Car Market Price S 1 P 2 P 1 D 2 Demand Right D 1 Q 2 Quantity New law allows drivers to continue driving until 85 years old using existing licence (currently 70)
UK Car Market Price S 1 P 1 Demand Supply Scenarios D 1 Q 2 Quantity New technology allows Lithium ion batteries for electric cars to be developed at half the existing cost 8
UK Car Market Price S 1 S 2 P 1 P 2 Supply Right D 1 Q 2 Quantity New technology allows Lithium ion batteries for electric cars to be developed at half the existing cost
UK Car Market Price S 1 P 1 Demand Supply Scenarios D 1 Q 2 Quantity UK car firms increase advertising by 140% 9
UK Car Market Price S 1 P 2 P 1 D 2 Demand Right D 1 Q 2 Quantity UK car firms increase advertising by 140%
UK Car Market Price S 1 P 1 Demand Supply Scenarios D 1 Q 2 Quantity Rise in average wages for car manufacturers 10
UK Car Market S 2 Price S 1 P 2 P 1 Supply Left D 1 Q 2 Quantity Rise in average wages for car manufacturers
UK Car Market Price S 1 P 1 Demand Supply Scenarios D 1 Q 2 Quantity Consumer fitness trends favour using bikes to get to work 11
UK Car Market Price S 1 P 2 Demand Left D 1 D 2 Q 1 Quantity Consumer fitness trends favour using bikes to get to work
UK Car Market Price S 1 P 1 Demand Supply Scenarios D 1 Q 2 Quantity Lower disposable incomes in UK due to higher mortgage costs 12
UK Car Market Price S 1 P 2 Demand Left D 1 D 2 Q 1 Quantity Lower disposable incomes in UK due to higher mortgage costs
UK Car Market Price S 1 P 1 Demand Supply Scenarios D 1 Q 2 Quantity Lower interest rates affect businesses and consumers 13
UK Car Market Price S 1 S 2 P 1 D 2 D 1 Q 2 Quantity Lower interest rates affect businesses and consumers Demand Right & Supply Right
UK Car Market Price S 1 P 1 Demand Supply Scenarios D 1 Q 2 Quantity Fall in cost of steel imported to UK 14
UK Car Market Price S 1 S 2 P 1 P 2 Supply Right D 1 Q 2 Quantity Fall in cost of steel imported to UK
UK Car Market Price S 1 P 1 Demand Supply Scenarios D 1 Q 2 Quantity New law states UK drivers must be aged 19 or over 12
UK Car Market Price S 1 P 2 Demand Left D 1 D 2 Q 1 Quantity New law states UK drivers must be aged 19 or over
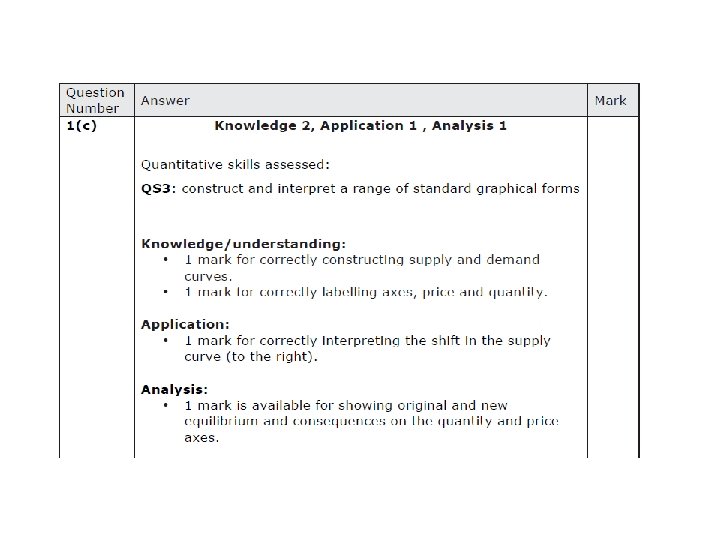
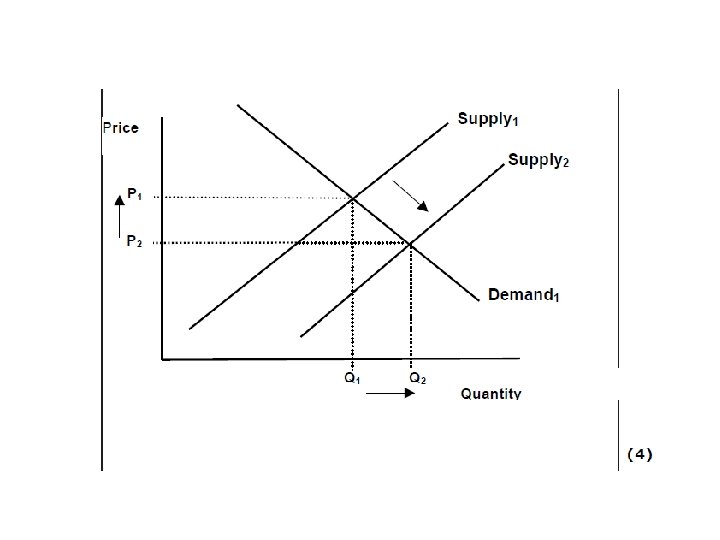
(c) Using the data from Extract A, construct a supply and demand diagram to illustrate the impact of YOTEL’s decision on the Singapore hotel market.
Activity • Complete data response 2, page 49.
Homework – Due Tuesday 19 th January • Complete data response 2, page 49. • Make a cheat sheet for: – Market Research – Market positioning – 8 mark questions – 10 mark questions