Starter Bar graphs Pie charts How many different

Starter Bar graphs Pie charts How many different charts and graphs can you think of that we can use to display data? Line graphs Pictogram Tally charts Composite bar graph

Below is a list of how a class travel to school. Walk, bus, bike, walk, bike, bus, walk, car, walk, bike, bus, walk, car, bus, walk, car, walk, train, bike, bus, walk How many students walk to school? A simple list is often inefficient.

Transport Walk Bus Car Tally |||| || |||| Frequency 13 7 4 Bike Train |||| | 5 1 Why do we need a frequency column? How many students were in the class in total?

What numbers do these tally marks represent? | 1 |||| 5 |||| 10 ||| 3 |||| || 7 |||| | 11

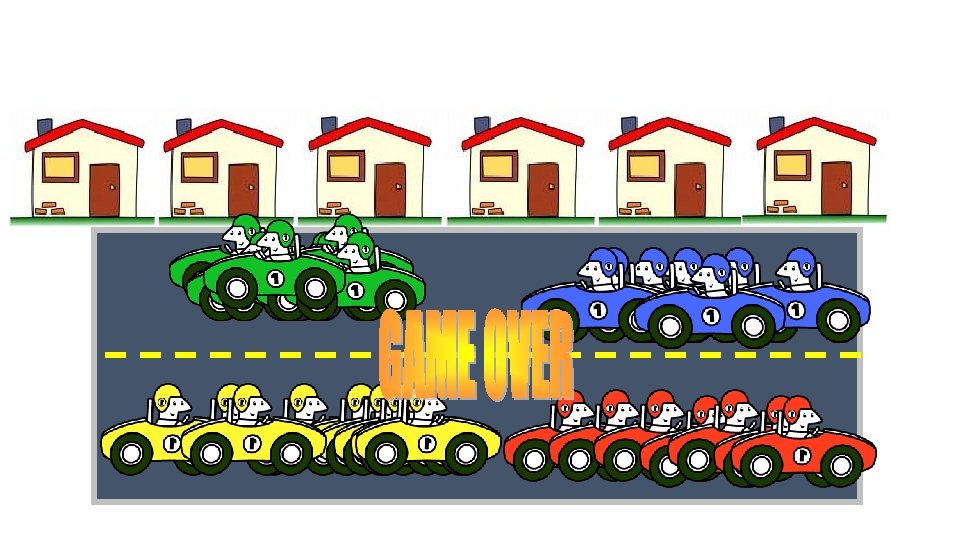
Copy this table into your books: Colour Green Tally Frequency Blue Red Yellow Use the next slide to help you fill it in. You will need to watch carefully!

Starter Find the differences between the two bar charts. Which one is correct?

Rules for a bar chart 1. 2. 3. 4. 5. 6. Title of chart Frequency on vertical axes Labels on axes Right scales Space between bars Bars with equal widths

Draw a bar chart for the information in this table. A bar chart to show types of trees in the park 8 Frequency Oak 2 Birch 5 Evergreen 8 10 6 4 2 Cedar Pine Type of tree Evergreen Birch Oak 0 Tree Pine 10 Cedar 7

Copy and complete the tally charts based on the students in your class. Once you have asked everybody, draw a bar chart for each in your book to show the results. Eye Colour Tally Frequency Blue Brown Green Favourite Season Winter Spring Summer Autumn

Comparative Bar Charts We can compare two sets of data using bar charts. We must draw the bars for the two sets of data next to each other for each category.

Draw a bar chart for the information in this table. A bar chart to compare boys’ and girls’ eye colour 10 Frequency 8 Eye Colour Boys Girls Blue 9 7 Green 4 4 Brown 2 4 6 Boys 4 Girls 2 Eye colour Brown Blue Green 0 You must include a key to show which bar represents which data set
 Which tutor group had the boys with the most merits? b) In which")
a) Which tutor group had the boys with the most merits? b) In which tutor groups did the boys receive more merits than the girls? c) In which tutor group did the boys and girls receive the same number of merits? d) Who received more merits; 8 D or 8 S? 8 W 8 R, 8 I, 8 W 8 H 8 D

Answers A bar chart to show gold medals won by Great Britain and Australia Great Britain 25 b. 5 medals more Australia c. Australia 8 and Great Britain 26 because they have been quite consistent the last 2 Olympics 20 15 10 5 Olympic location and year Rio 2016 Great Britain 2012 Beijing 2008 Athens 2004 0 Sydney 2000 Medals won a. 3 Olympics out of 5

Answers a. New York A bar chart to show temperature in Rome and New York Rome c. 3 months 20 d. 2 ºC difference 15 e. Rome – I don’t like it too hot! 10 5 Month September August July June 0 May Average temperature (ºC) b. Rome New York 25

Results Colour Green Tally |||| Frequency 8 Blue Red Yellow |||| || |||| 7 7 9 Which car colour was most common? Yellow

Mr Khan asked the 22 students in his class what activity they wanted to do on a school trip. Here are the results. Complete the frequency table. Bowling Swimming Roller Skating Swimming Cinema Swimming Bowling Swimming Cinema Roller Skating Bowling Activity Bowling Swimming Roller Skating Cinema Roller Skating Bowling Swimming Tally |||| | ||| Swimming Roller Skating Swimming Cinema Swimming Frequency 4 9 6 3

1. Make sure that you include a title to tell the reader what your pictogram is about. A pictogram showing pupils favourite colours 3. Use an appropriate picture to represent your data. Red Blue Yellow 4. Make sure that you include a key to explain what each of the pictures represents. Green White 2. Put the answers or groups down one side of the page and then draw a line. Each face represents 2 pupils

Method of Travel Walk Bike Car Bus Tally |||| | |||| || Frequency 9 3 6 12 WALK BIKE CAR BUS = 2 people

Age of Children 7 8 9 10 11 12 Frequency 7 10 13 10 6 14 7 years 8 years 9 years 10 years 11 years 12 years = 2 people

Pictogram Bingo!

How many hours of sunshine were there in Betatown?

How many people prefer cats?

How many cherries were sold?

How many people prefer dogs?

How many apples were sold in February?

How many students play soccer?

How many apples were sold?

How many greetings cards were sold by Joselyn?

How many hours of sunshine were there in Gammaby?

How many cars were sold in 2006?

In how many matches were 2 goals scored?

How many bananas were sold?

How many pupils prefer pizza?

How many students play football?

In how many matches were 3 goals scored?

How many pupils prefer breakfast?

How many green smarties were in the pack?

How many hours of sunshine were there in Alphaville?

How many students play baseball?

How many greetings cards were sold by Felicia?

How many purple smarties were in the pack?

How many strawberries were sold?

How many visitors were there in January?

How many blue smarties were in the pack?

How many hours of sunshine were there in Fineborough?

How many apples were sold in March?

How many visitors were there in February?

How many people prefer horses?

How many apples were sold in April?

How many brown smarties were in the pack?

How many visitors were there in May?

How many apples were sold in January?

How many pupils prefer chicken nuggets?

How many cars were sold in 2004?

In how many matches were 0 goals scored?

How many yellow smarties were in the pack?

How many cars were sold in 2003?

How many visitors were there in March?

How many votes were there for dogs?

How many cars were sold in 2005?

How many greetings cards were sold by Phil?

In how many matches were 4 goals scored?

How many cars were sold in 2007?

How many visitors were there in April?

How many oranges were sold?

How many students play hockey?

How many votes were there for cats?

How many red smarties were in the pack?

How many greetings cards were sold by Rafael?

In how many matches were 1 goals scored?

How many students play basketball?

How many pears were sold?

How many votes were there for hamsters?

How many greetings cards were sold by Ken?
- Slides: 75