
Starter Activity Complete the worksheet provided by your

Starter Activity Ø Complete the worksheet provided by your teacher!
Topic 3. 3: Break Even Charts and Break Even Analysis Unit 3: Building a Business
Learning Objectives What are we learning today? By the end of the lesson you should be able. . . Ø To understand the following key terms (AO 1): Ø Break Even Point Ø Total Revenue Ø Total Costs Ø Fixed Costs Ø Variable Costs Ø To calculate the break even point. (AO 2) Ø To evaluate the financial performance in a break even chart. (AO 3)
Break Even Point Ø Break Even Point: The level of output where total revenues are equal to total costs; this is where neither a profit or loss is being made.
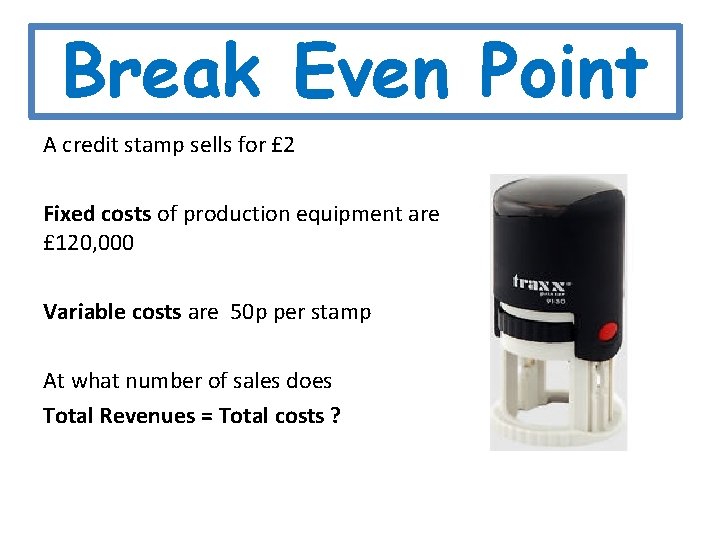
Break Even Point A credit stamp sells for £ 2 Fixed costs of production equipment are £ 120, 000 Variable costs are 50 p per stamp At what number of sales does Total Revenues = Total costs ?
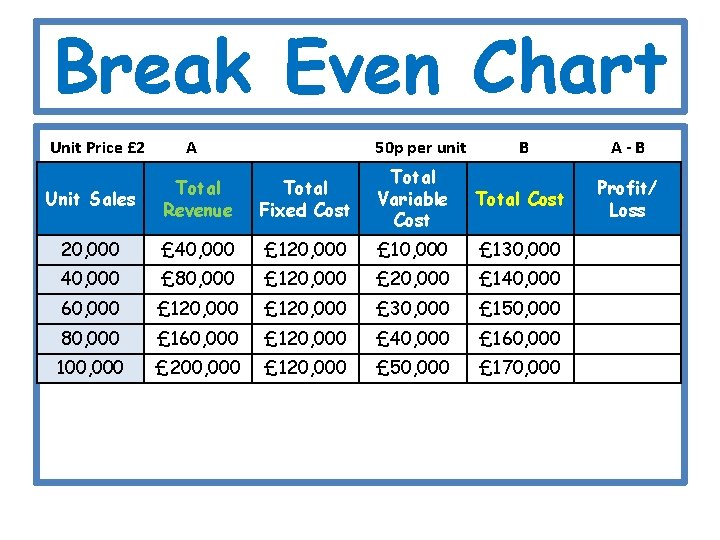
Break Even Chart Unit Price £ 2 A 50 p per unit B A-B Profit/ Loss Unit Sales Total Revenue Total Fixed Cost Total Variable Cost Total Cost 20, 000 £ 40, 000 £ 120, 000 £ 130, 000 40, 000 £ 80, 000 £ 120, 000 £ 140, 000 60, 000 £ 120, 000 £ 30, 000 £ 150, 000 80, 000 £ 160, 000 £ 120, 000 £ 40, 000 £ 160, 000 100, 000 £ 200, 000 £ 120, 000 £ 50, 000 £ 170, 000
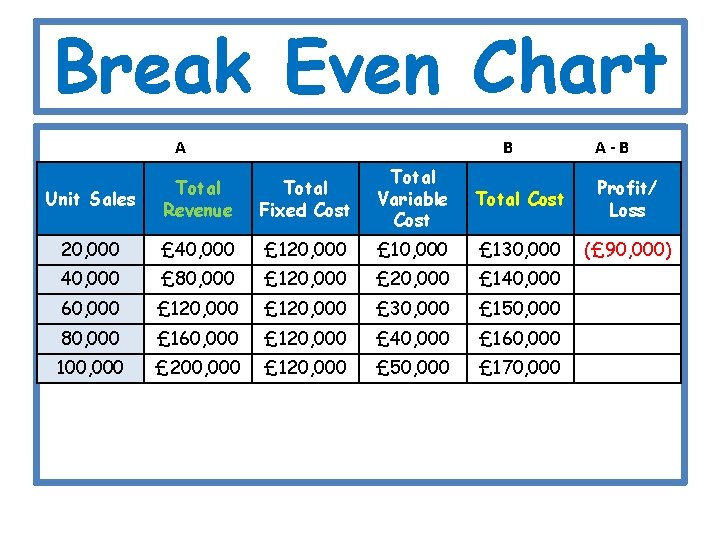
Break Even Chart A B A-B Unit Sales Total Revenue Total Fixed Cost Total Variable Cost Total Cost Profit/ Loss 20, 000 £ 40, 000 £ 120, 000 £ 130, 000 (£ 90, 000) 40, 000 £ 80, 000 £ 120, 000 £ 140, 000 60, 000 £ 120, 000 £ 30, 000 £ 150, 000 80, 000 £ 160, 000 £ 120, 000 £ 40, 000 £ 160, 000 100, 000 £ 200, 000 £ 120, 000 £ 50, 000 £ 170, 000
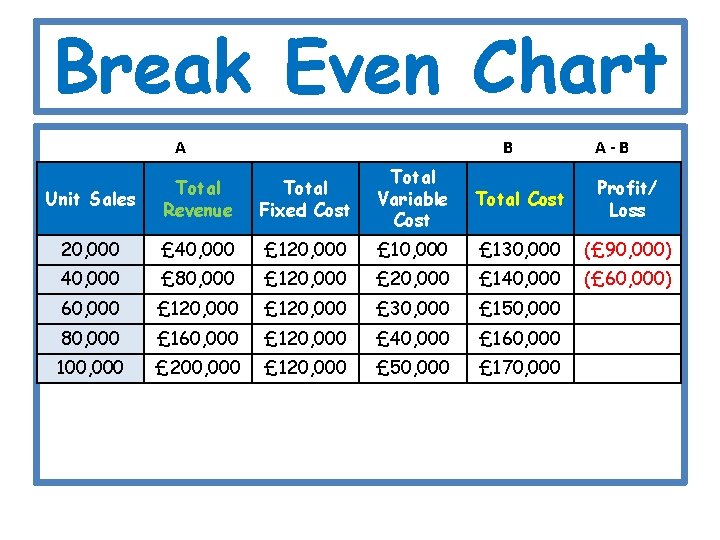
Break Even Chart A B A-B Unit Sales Total Revenue Total Fixed Cost Total Variable Cost Total Cost Profit/ Loss 20, 000 £ 40, 000 £ 120, 000 £ 130, 000 (£ 90, 000) 40, 000 £ 80, 000 £ 120, 000 £ 140, 000 (£ 60, 000) 60, 000 £ 120, 000 £ 30, 000 £ 150, 000 80, 000 £ 160, 000 £ 120, 000 £ 40, 000 £ 160, 000 100, 000 £ 200, 000 £ 120, 000 £ 50, 000 £ 170, 000
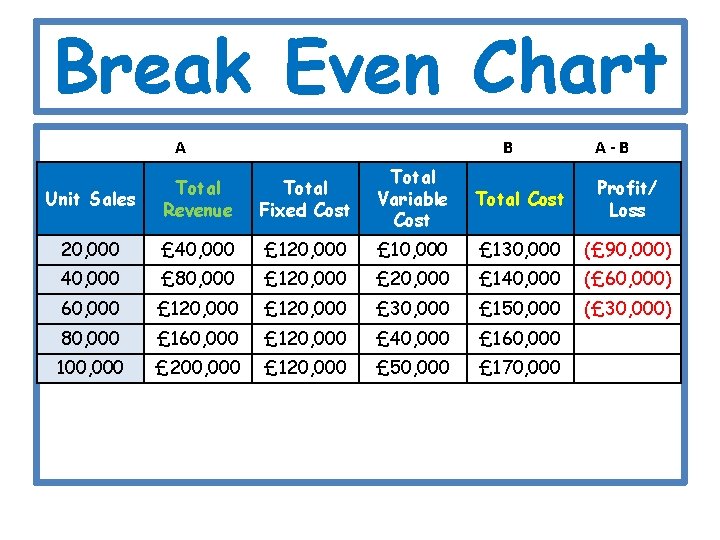
Break Even Chart A B A-B Unit Sales Total Revenue Total Fixed Cost Total Variable Cost Total Cost Profit/ Loss 20, 000 £ 40, 000 £ 120, 000 £ 130, 000 (£ 90, 000) 40, 000 £ 80, 000 £ 120, 000 £ 140, 000 (£ 60, 000) 60, 000 £ 120, 000 £ 30, 000 £ 150, 000 (£ 30, 000) 80, 000 £ 160, 000 £ 120, 000 £ 40, 000 £ 160, 000 100, 000 £ 200, 000 £ 120, 000 £ 50, 000 £ 170, 000
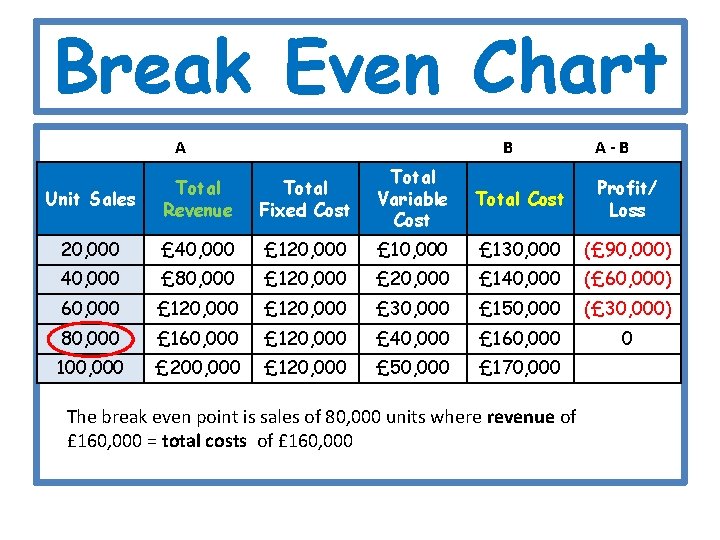
Break Even Chart A B A-B Unit Sales Total Revenue Total Fixed Cost Total Variable Cost Total Cost Profit/ Loss 20, 000 £ 40, 000 £ 120, 000 £ 130, 000 (£ 90, 000) 40, 000 £ 80, 000 £ 120, 000 £ 140, 000 (£ 60, 000) 60, 000 £ 120, 000 £ 30, 000 £ 150, 000 (£ 30, 000) 80, 000 £ 160, 000 £ 120, 000 £ 40, 000 £ 160, 000 0 100, 000 £ 200, 000 £ 120, 000 £ 50, 000 £ 170, 000 The break even point is sales of 80, 000 units where revenue of £ 160, 000 = total costs of £ 160, 000

Break Even Chart A B A-B Unit Sales Total Revenue Total Fixed Cost Total Variable Cost Total Cost Profit/ Loss 20, 000 £ 40, 000 £ 120, 000 £ 130, 000 (£ 90, 000) 40, 000 £ 80, 000 £ 120, 000 £ 140, 000 (£ 60, 000) 60, 000 £ 120, 000 £ 30, 000 £ 150, 000 (£ 30, 000) 80, 000 £ 160, 000 £ 120, 000 £ 40, 000 £ 160, 000 100, 000 £ 200, 000 £ 120, 000 £ 50, 000 £ 170, 000 The break even point is sales of 80, 000 units where revenue of £ 160, 000 = total costs of £ 160, 000 £ 30, 000

Drawing a break-even chart • Draw a graph, label the x axis 0 -120 (in multiples of 10) and draw the y axis 0 -200 (in multiples of 20) • Draw a line in 1 colour for your fixed costs and label it on the side • Draw a line in a different colour for your variable costs and label it on the side (you wouldn’t normally include this on your graph) • Draw a line in a third colour for your total costs and label it on the side • Draw a line in a fourth colour for your total revenue and label it on the side • Draw a dotted line across and down from your graph where total costs = total revenue (where these lines meet, label it as your break even point)
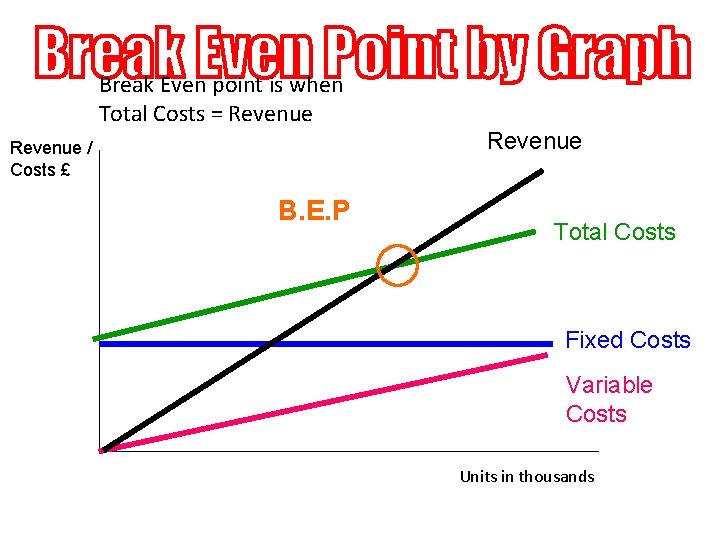
Break Even point is when Total Costs = Revenue / Costs £ B. E. P Revenue Total Costs Fixed Costs Variable Costs Units in thousands
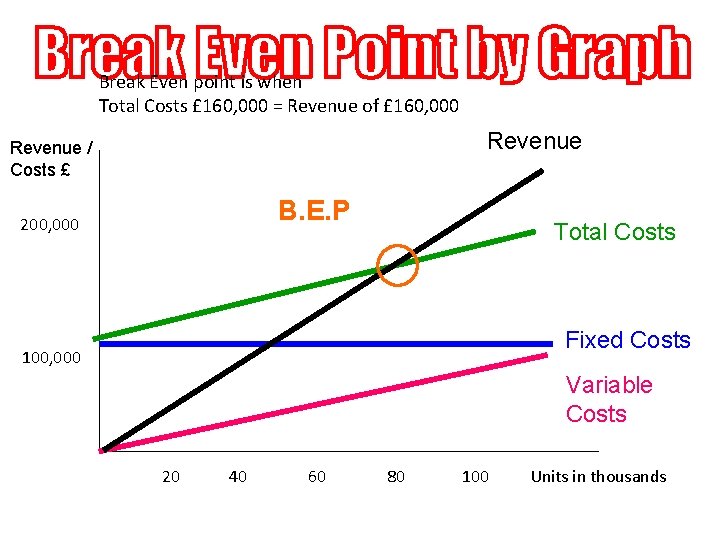
Break Even point is when Total Costs £ 160, 000 = Revenue of £ 160, 000 Revenue / Costs £ B. E. P 200, 000 Total Costs Fixed Costs 100, 000 Variable Costs 20 40 60 80 100 Units in thousands
Activity Ø We are going to watch the following video.
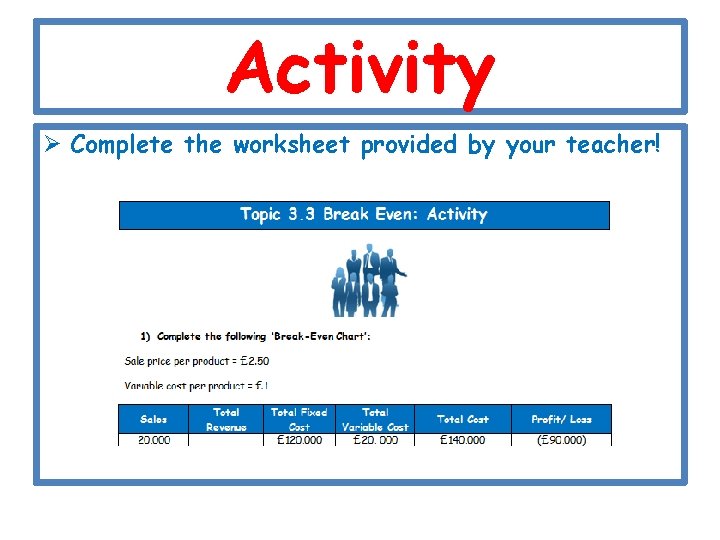
Activity Ø Complete the worksheet provided by your teacher!
Activity 2 Read pages 76 -77 and answer the following questions in your book 1. What is the Margin of Safety? 2. What happens to the BEP when costs rise? 3. What happens to the BEP when costs fall? 4. What is Contribution analysis and how can you calculate it? 5. Answer the TEST YOURSELF questions on p. 78
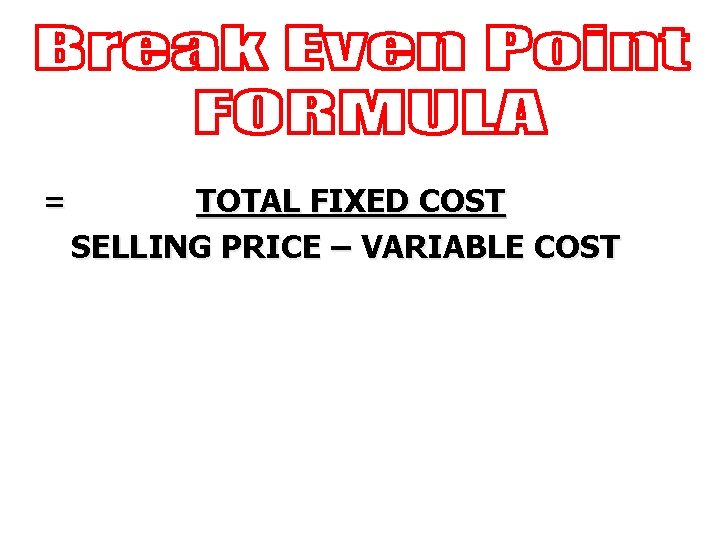
= TOTAL FIXED COST SELLING PRICE – VARIABLE COST
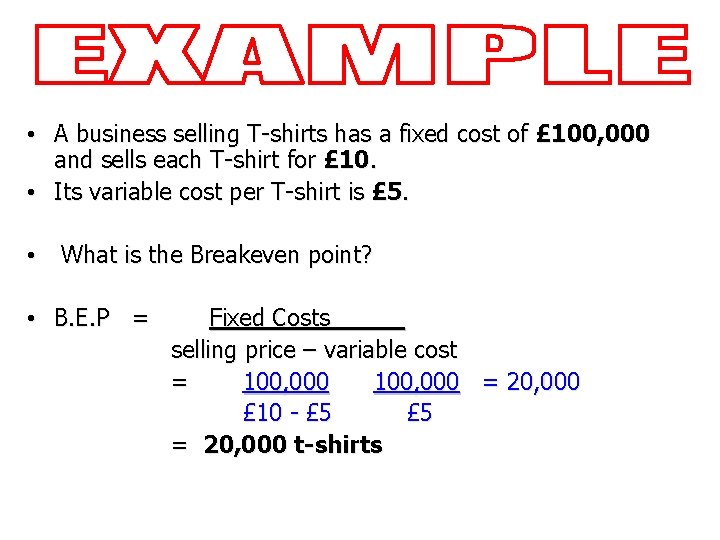
• A business selling T-shirts has a fixed cost of £ 100, 000 and sells each T-shirt for £ 10. • Its variable cost per T-shirt is £ 5. • What is the Breakeven point? • B. E. P = Fixed Costs selling price – variable cost = 100, 000 = 20, 000 £ 10 - £ 5 = 20, 000 t-shirts
Revise what we’ve learnt using BBC GCSE Bitesize
- Slides: 20