
STARCH EUROPE Economic contribution 2017 26 Companies 75

STARCH EUROPE
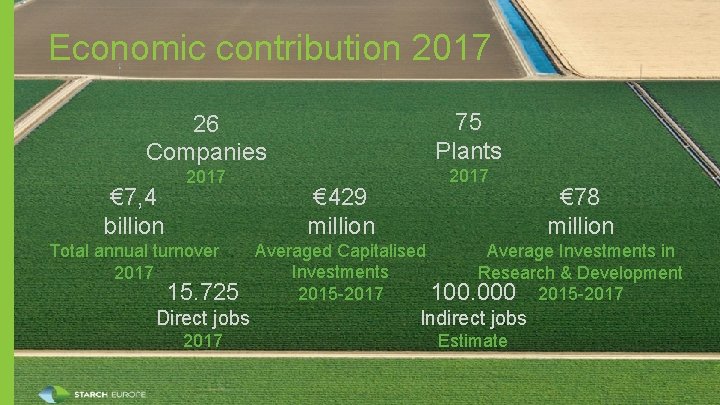
Economic contribution 2017 26 Companies 75 Plants 2017 € 7, 4 billion € 429 million € 78 million 15. 725 Averaged Capitalised Average Investments in Investments Research & Development 100. 000 2015 -2017 Direct jobs Indirect jobs 2017 Estimate Total annual turnover 2017 2
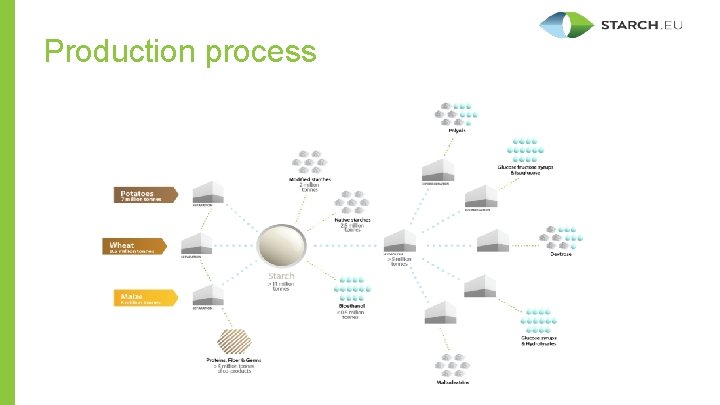
Production process
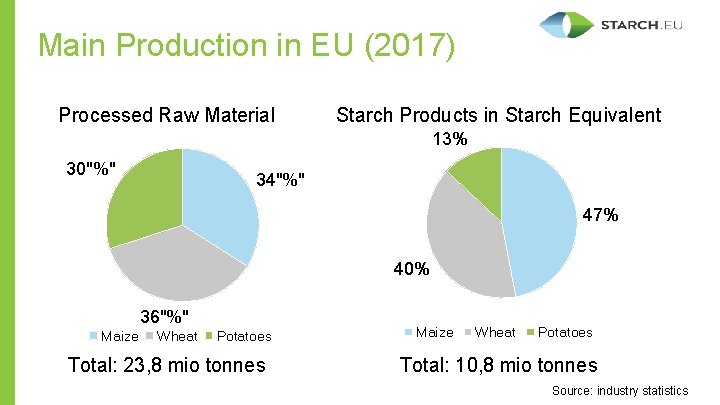
Main Production in EU (2017) Processed Raw Material Starch Products in Starch Equivalent 13% 30"%" 34"%" 47% 40% 36"%" Maize Wheat Potatoes Total: 23, 8 mio tonnes Maize Wheat Potatoes Total: 10, 8 mio tonnes Source: industry statistics
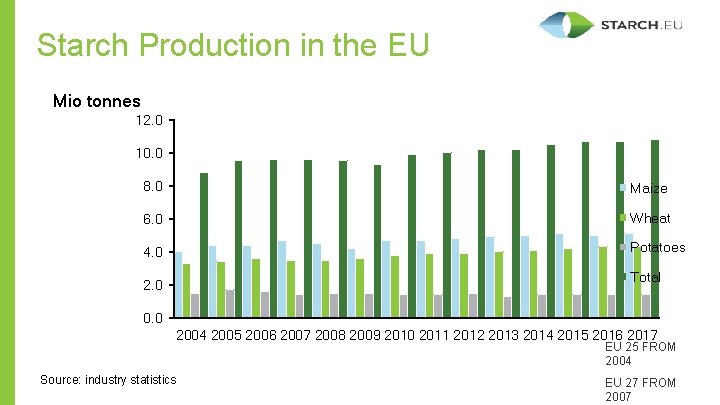
Starch Production in the EU Mio tonnes 12. 0 10. 0 8. 0 Maize 6. 0 Wheat 4. 0 Potatoes Total 2. 0 0. 0 2004 2005 2006 2007 2008 2009 2010 2011 2012 2013 2014 2015 2016 2017 EU 25 FROM 2004 Source: industry statistics EU 27 FROM 2007
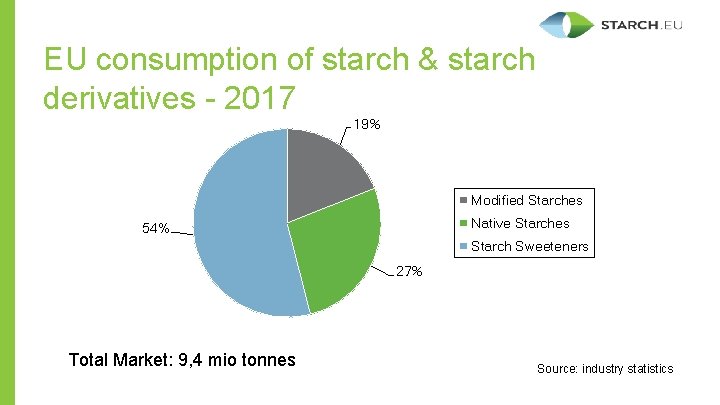
EU consumption of starch & starch derivatives - 2017 19% Modified Starches Native Starches 54% Starch Sweeteners 27% Total Market: 9, 4 mio tonnes Source: industry statistics
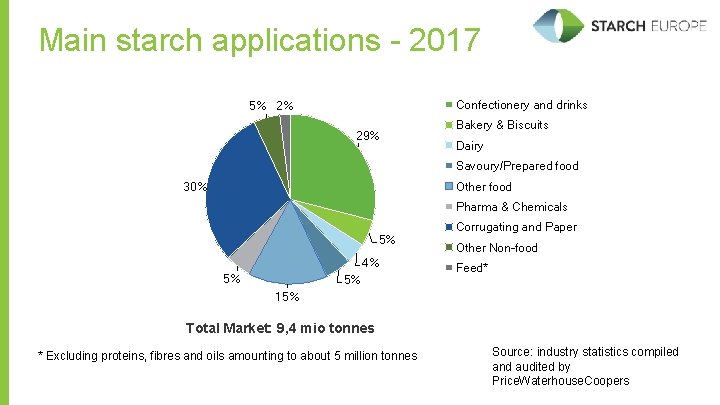
Main starch applications - 2017 Confectionery and drinks 5% 2% 29% Bakery & Biscuits Dairy Savoury/Prepared food Other food 30% Pharma & Chemicals 5% 4% 5% 5% Corrugating and Paper Other Non-food Feed* 15% Total Market: 9, 4 mio tonnes * Excluding proteins, fibres and oils amounting to about 5 million tonnes Source: industry statistics compiled and audited by Price. Waterhouse. Coopers
- Slides: 7