
Starbucks Entertainment Global Delivery of Music Sharan Dhaliwal
Starbucks Entertainment: Global Delivery of Music • Sharan Dhaliwal • Sasha Noorani • John Rupp • Dan Williams
To develop a strategy for introducing Starbucks Entertainment into two countries on distinct continents.
Current Situation Strategy and Metrics Country Analysis Financial Analysis Timeline Q&A
Perceived Loss of the Coffeehouse Aura Increased Competition Current Situation Strategy and Metrics Slowing Growth Country Analysis Financial Analysis Timeline and Conclusion
• Howard Schultz Transformation Plan • Refocus on coffee and café experience • Accelerating International Growth • How Starbucks Entertainment fits into the plan • Helps create the atmosphere that “re-ignites the emotional attachment” • Limited International sales- ready to grow Current Situation Strategy and Metrics Country Analysis Financial Analysis Timeline and Conclusion
How and where do we implement a global expansion of Starbucks Entertainment? Current Situation Strategy and Metrics Country Analysis Financial Analysis Timeline and Conclusion
• Global vs. Local – Leverage existing catalog – Develop synergy to create personal atmosphere • Digital vs. Physical – Concentrate on physical • Higher margins – Develop digital for the future • Mobile Phones Current Situation Strategy and Metrics Country Analysis Financial Analysis Timeline and Conclusion
1. Strong local presence 2. Synergy of music industry 3. Intellectual property protection Current Situation Strategy and Metrics Country Analysis Financial Analysis Timeline and Conclusion
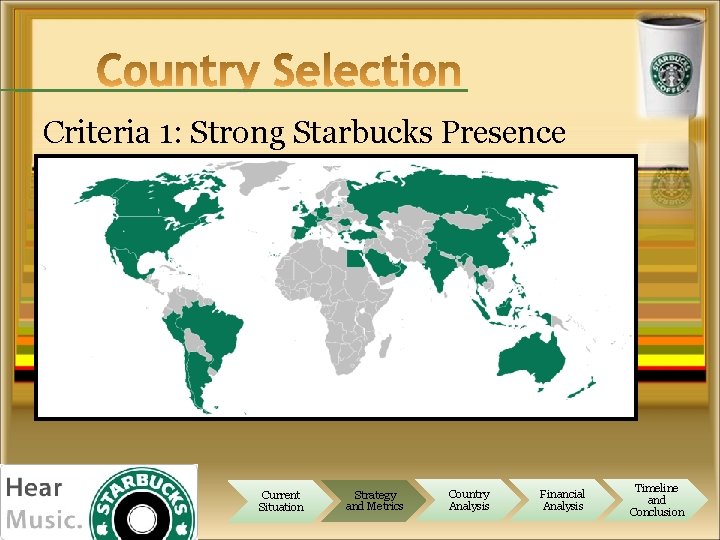
Criteria 1: Strong Starbucks Presence Current Situation Strategy and Metrics Country Analysis Financial Analysis Timeline and Conclusion
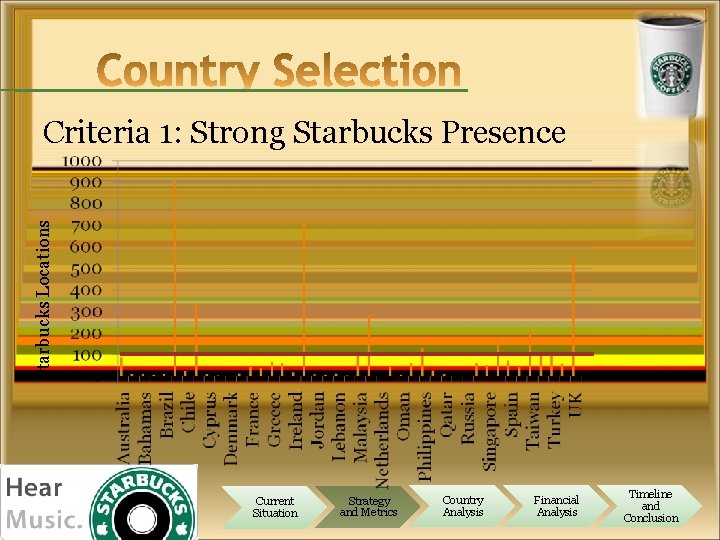
Starbucks Locations Criteria 1: Strong Starbucks Presence Current Situation Strategy and Metrics Country Analysis Financial Analysis Timeline and Conclusion
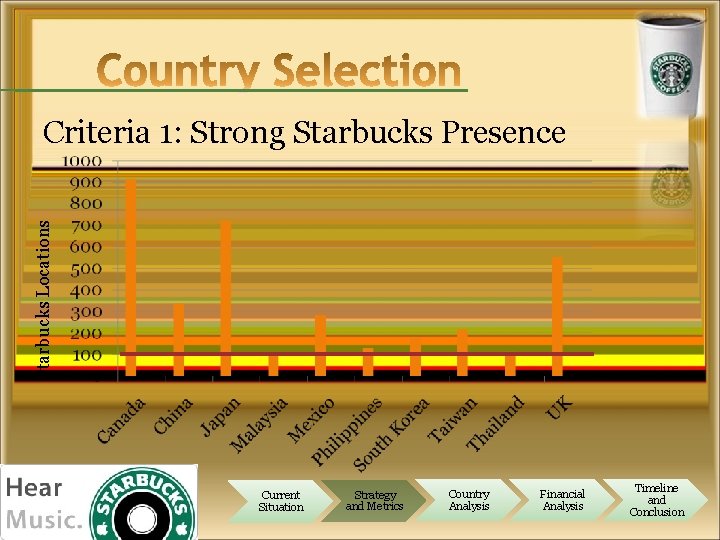
Starbucks Locations Criteria 1: Strong Starbucks Presence Current Situation Strategy and Metrics Country Analysis Financial Analysis Timeline and Conclusion
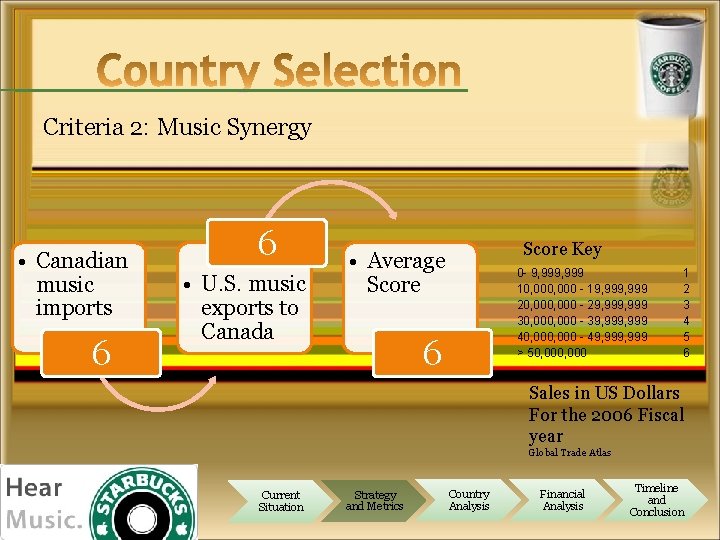
Criteria 2: Music Synergy • Canadian music imports 6 6 • U. S. music exports to Canada • Average Score 6 Score Key 0 - 9, 999 10, 000 - 19, 999 20, 000 - 29, 999 30, 000 - 39, 999 40, 000 - 49, 999 > 50, 000 1 2 3 4 5 6 Sales in US Dollars For the 2006 Fiscal year Global Trade Atlas Current Situation Strategy and Metrics Country Analysis Financial Analysis Timeline and Conclusion
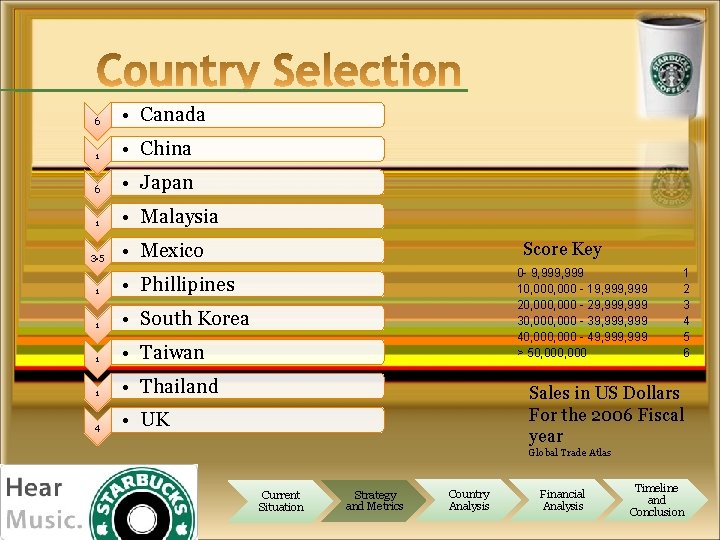
6 • Canada 1 • China 6 • Japan 1 • Malaysia 3. 5 • Mexico 1 • Phillipines 1 • South Korea 1 • Taiwan 1 • Thailand 4 • UK Score Key 0 - 9, 999 10, 000 - 19, 999 20, 000 - 29, 999 30, 000 - 39, 999 40, 000 - 49, 999 > 50, 000 1 2 3 4 5 6 Sales in US Dollars For the 2006 Fiscal year Global Trade Atlas Current Situation Strategy and Metrics Country Analysis Financial Analysis Timeline and Conclusion
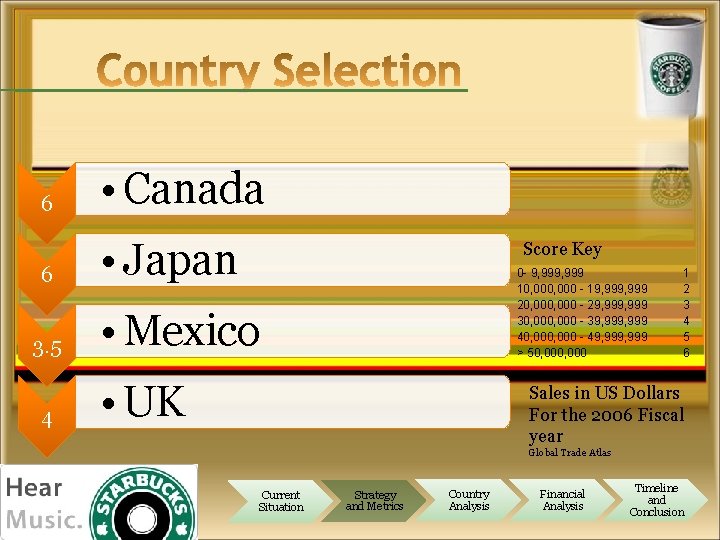
6 • Canada 6 • Japan 3. 5 4 Score Key 0 - 9, 999 10, 000 - 19, 999 20, 000 - 29, 999 30, 000 - 39, 999 40, 000 - 49, 999 > 50, 000 • Mexico • UK 1 2 3 4 5 6 Sales in US Dollars For the 2006 Fiscal year Global Trade Atlas Current Situation Strategy and Metrics Country Analysis Financial Analysis Timeline and Conclusion
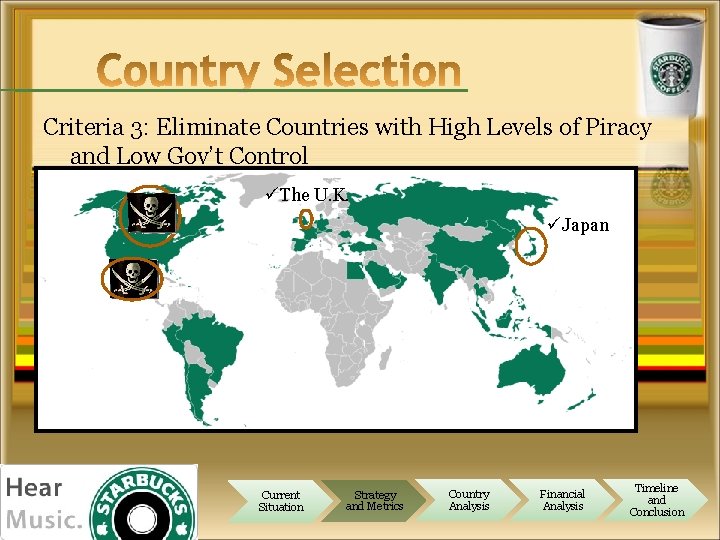
Criteria 3: Eliminate Countries with High Levels of Piracy and Low Gov’t Control üThe U. K. üJapan Current Situation Strategy and Metrics Country Analysis Financial Analysis Timeline and Conclusion
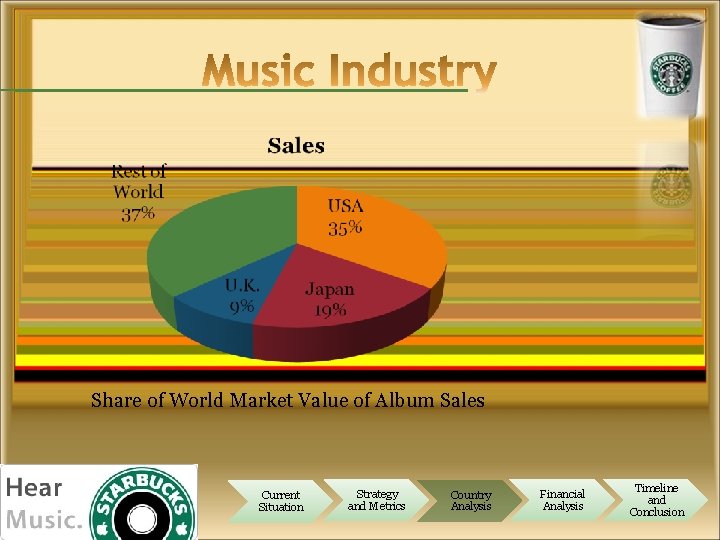
Share of World Market Value of Album Sales Current Situation Strategy and Metrics Country Analysis Financial Analysis Timeline and Conclusion
Facts of the Country Local Music Industry Digital Partner Current Situation Strategy and Metrics Country Analysis Financial Analysis Timeline and Conclusion
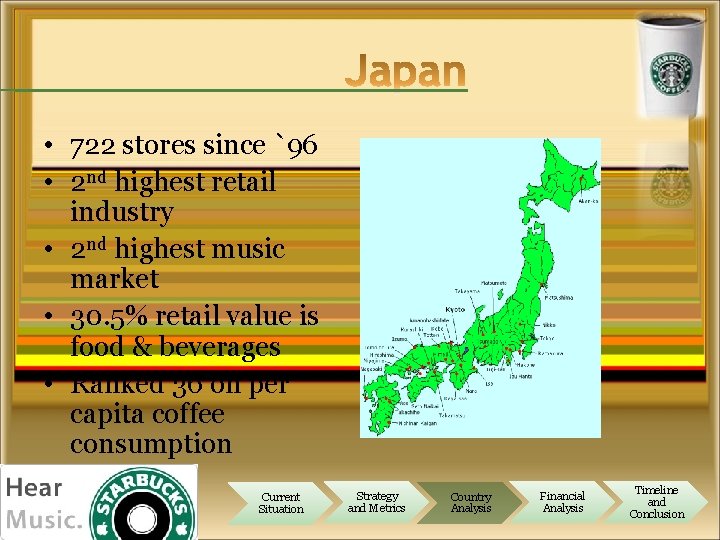
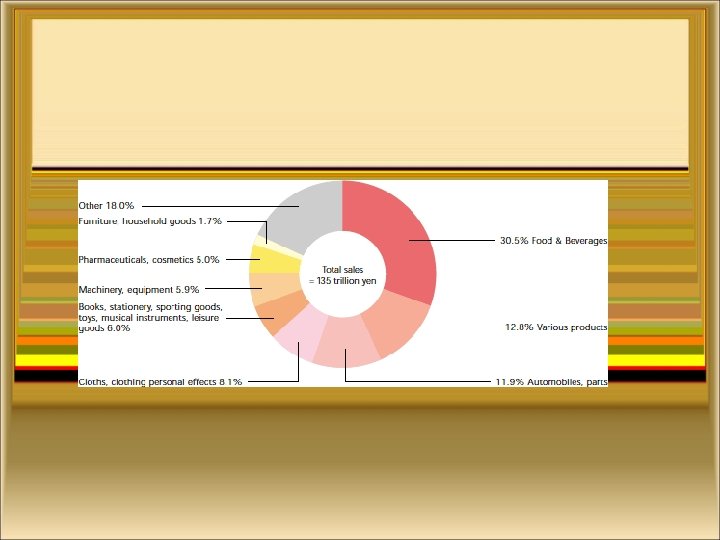
• 722 stores since `96 • 2 nd highest retail industry • 2 nd highest music market • 30. 5% retail value is food & beverages • Ranked 36 on per capita coffee consumption Current Situation Strategy and Metrics Country Analysis Financial Analysis Timeline and Conclusion
Unique Music Domestic and global popularity 91% of Digital Downloads are Mobile Current Situation Strategy and Metrics Country Analysis Financial Analysis Timeline and Conclusion
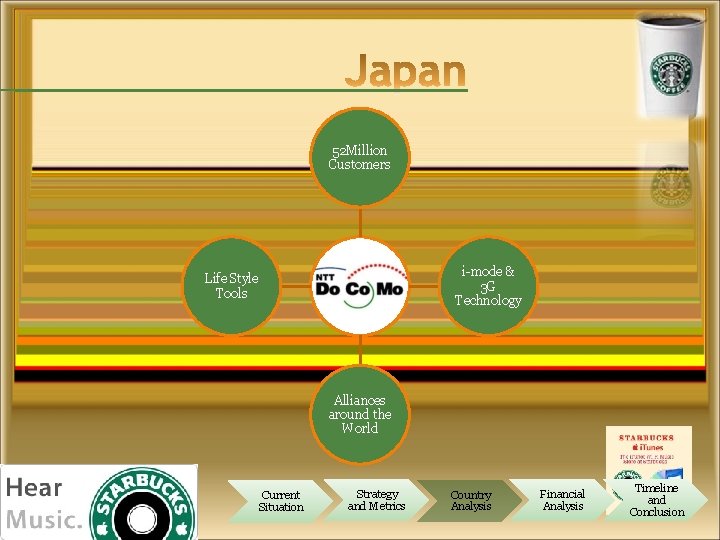
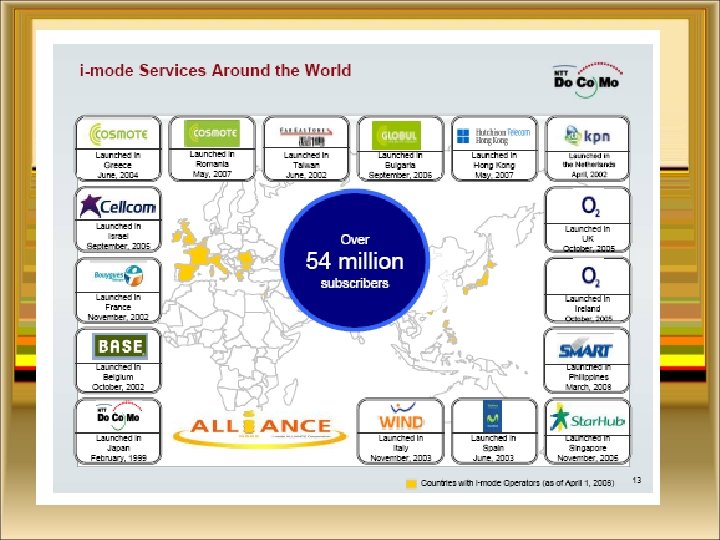
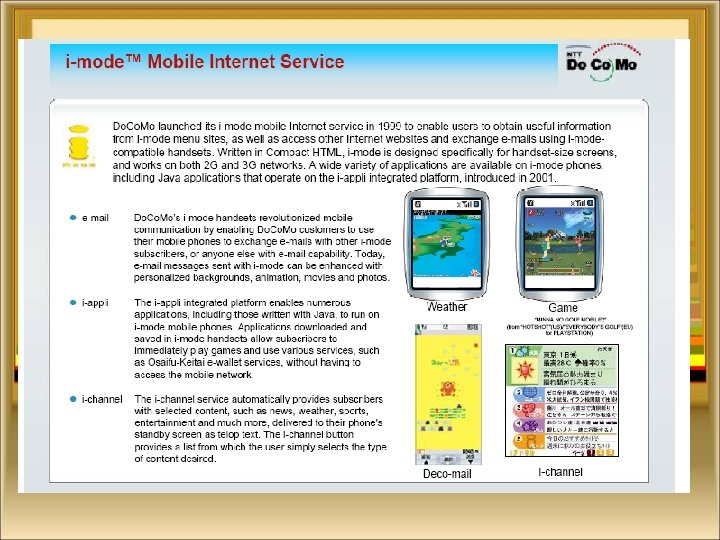
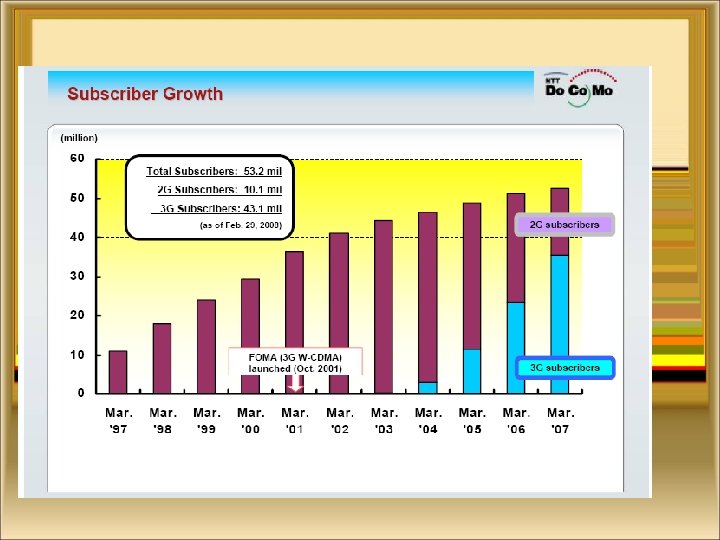
52 Million Customers i-mode & 3 G Technology Life Style Tools Alliances around the World Current Situation Strategy and Metrics Country Analysis Financial Analysis Timeline and Conclusion
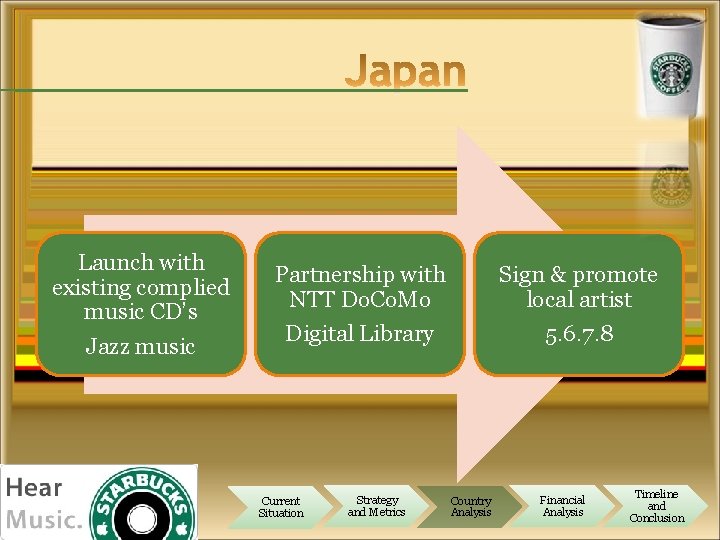
Launch with existing complied music CD’s Jazz music Partnership with NTT Do. Co. Mo Sign & promote local artist Digital Library 5. 6. 7. 8 Current Situation Strategy and Metrics Country Analysis Financial Analysis Timeline and Conclusion
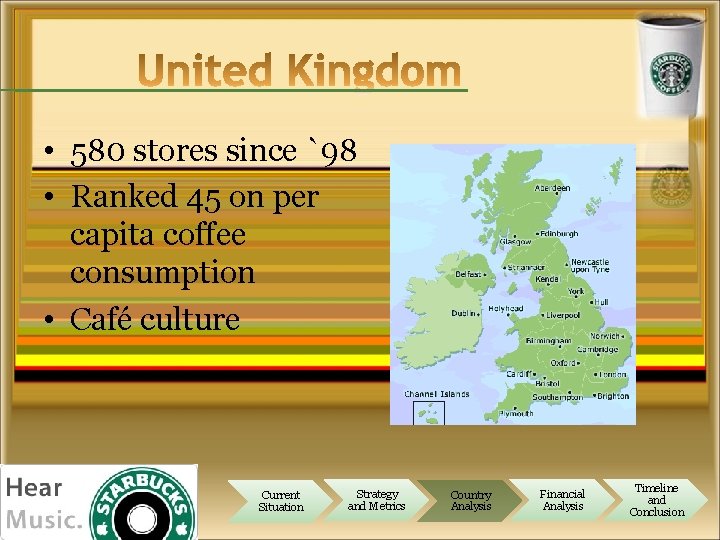
• 580 stores since `98 • Ranked 45 on per capita coffee consumption • Café culture Current Situation Strategy and Metrics Country Analysis Financial Analysis Timeline and Conclusion
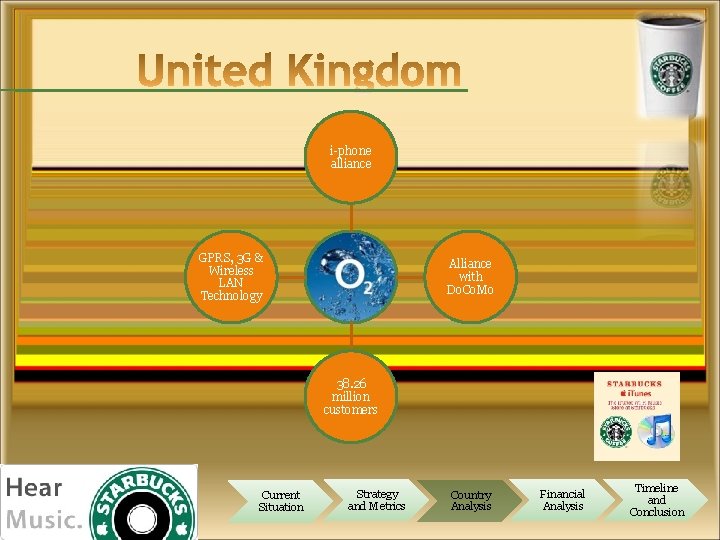
i-phone alliance GPRS, 3 G & Wireless LAN Technology Alliance with Do. Co. Mo 38. 26 million customers Current Situation Strategy and Metrics Country Analysis Financial Analysis Timeline and Conclusion
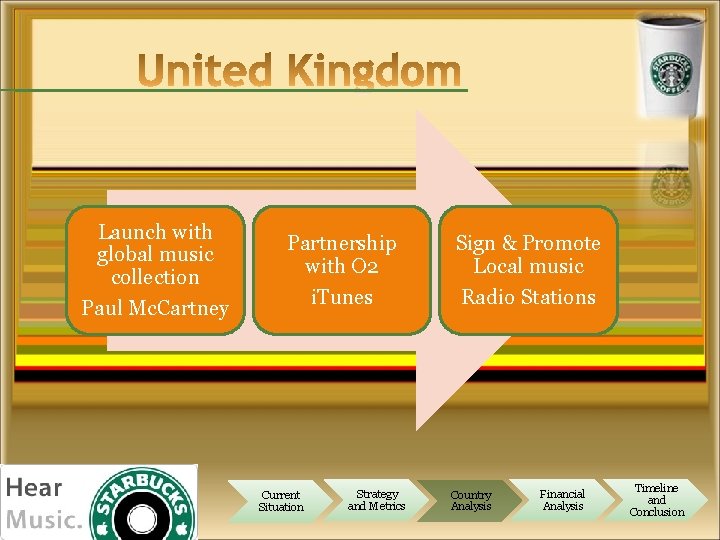
Launch with global music collection Paul Mc. Cartney Partnership with O 2 Sign & Promote Local music i. Tunes Radio Stations Current Situation Strategy and Metrics Country Analysis Financial Analysis Timeline and Conclusion

Go back to roots of Starbucks Entertainment • Boost Local Talent • Barista’s to play local music • Between the peak hours of 4 -6 pm • Compile maximum request songs • 50% profit from local artist signed on the hear music label Current Situation Strategy and Metrics Country Analysis Financial Analysis Timeline and Conclusion
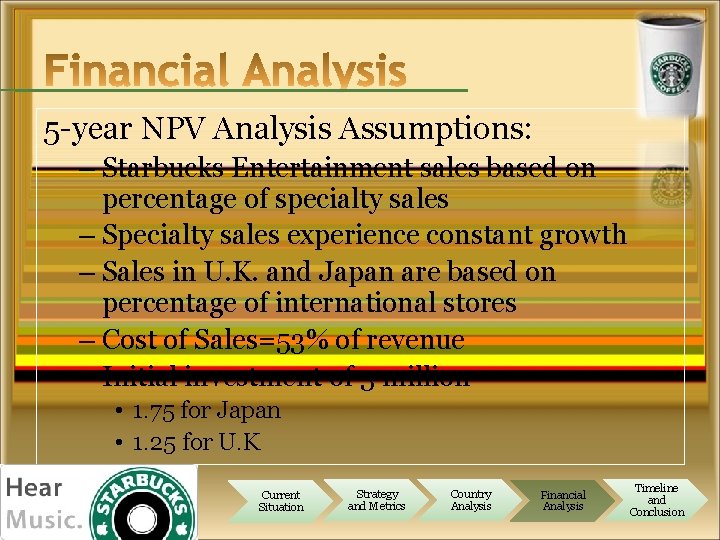
5 -year NPV Analysis Assumptions: – Starbucks Entertainment sales based on percentage of specialty sales – Specialty sales experience constant growth – Sales in U. K. and Japan are based on percentage of international stores – Cost of Sales=53% of revenue – Initial investment of 3 million • 1. 75 for Japan • 1. 25 for U. K Current Situation Strategy and Metrics Country Analysis Financial Analysis Timeline and Conclusion
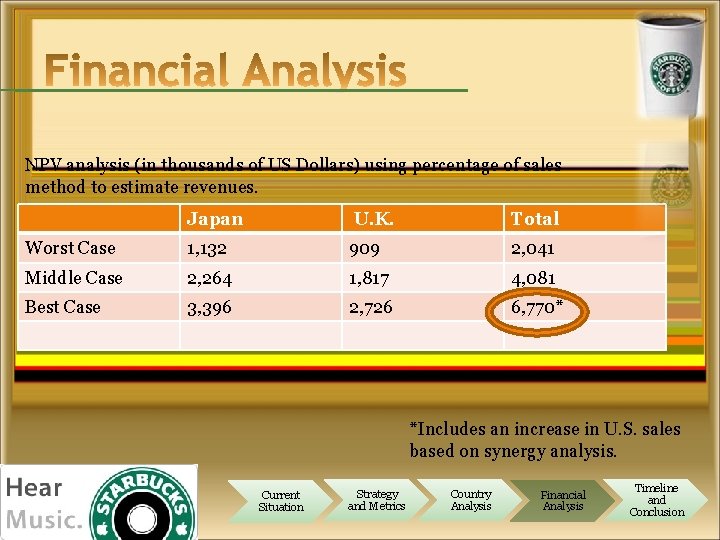
NPV analysis (in thousands of US Dollars) using percentage of sales method to estimate revenues. Japan U. K. Total Worst Case 1, 132 909 2, 041 Middle Case 2, 264 1, 817 4, 081 Best Case 3, 396 2, 726 6, 770* *Includes an increase in U. S. sales based on synergy analysis. Current Situation Strategy and Metrics Country Analysis Financial Analysis Timeline and Conclusion
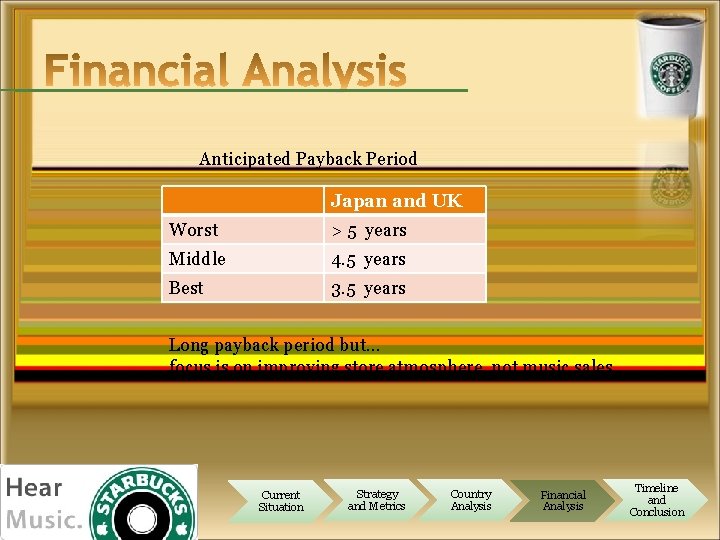
Anticipated Payback Period Japan and UK Worst > 5 years Middle 4. 5 years Best 3. 5 years Long payback period but… focus is on improving store atmosphere, not music sales Current Situation Strategy and Metrics Country Analysis Financial Analysis Timeline and Conclusion
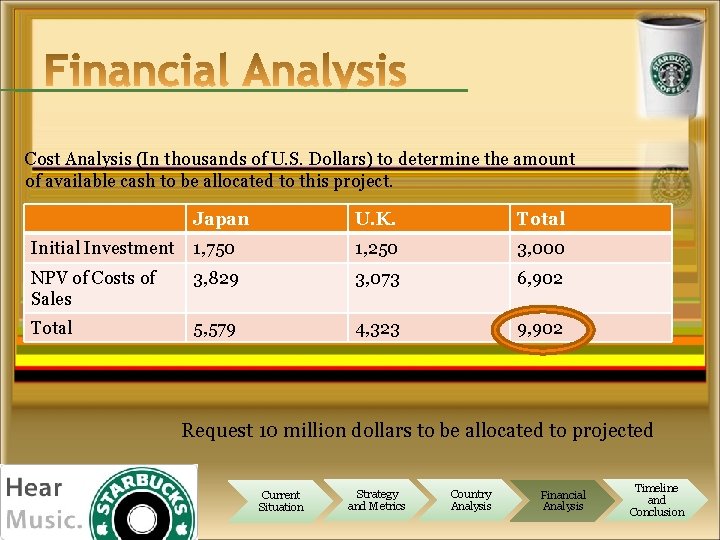
Cost Analysis (In thousands of U. S. Dollars) to determine the amount of available cash to be allocated to this project. Japan U. K. Total Initial Investment 1, 750 1, 250 3, 000 NPV of Costs of Sales 3, 829 3, 073 6, 902 Total 5, 579 4, 323 9, 902 Request 10 million dollars to be allocated to projected Current Situation Strategy and Metrics Country Analysis Financial Analysis Timeline and Conclusion
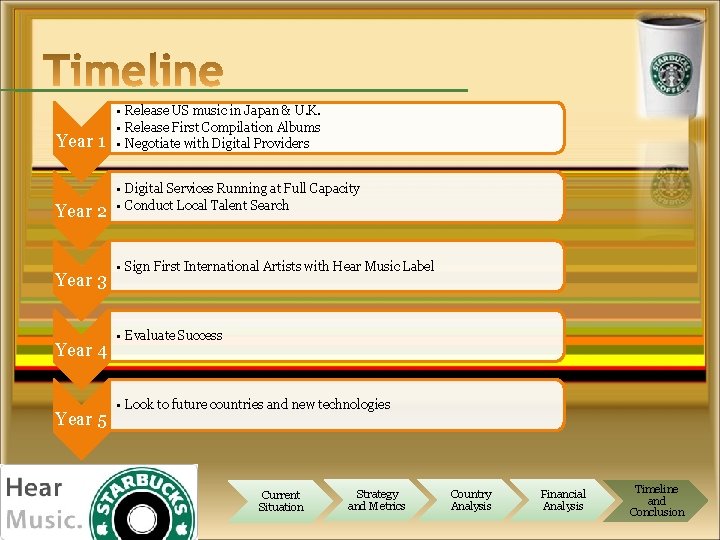
Year 1 Year 2 Year 3 Year 4 Year 5 • Release US music in Japan & U. K. • Release First Compilation Albums • Negotiate with Digital Providers • Digital Services Running at Full Capacity • Conduct Local Talent Search • Sign First International Artists with Hear Music Label • Evaluate Success • Look to future countries and new technologies Current Situation Strategy and Metrics Country Analysis Financial Analysis Timeline and Conclusion
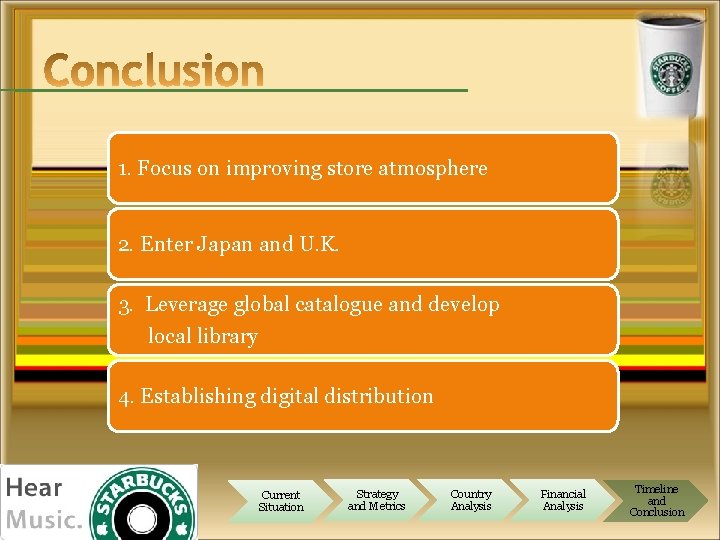
1. Focus on improving store atmosphere 2. Enter Japan and U. K. 3. Leverage global catalogue and develop local library 4. Establishing digital distribution Current Situation Strategy and Metrics Country Analysis Financial Analysis Timeline and Conclusion

Q & A
Physical vs. Digital Synergy Analysis Piracy Music Sales Japan U. K. Financials Diagrams Best-Case Likely-Case Worst-Case
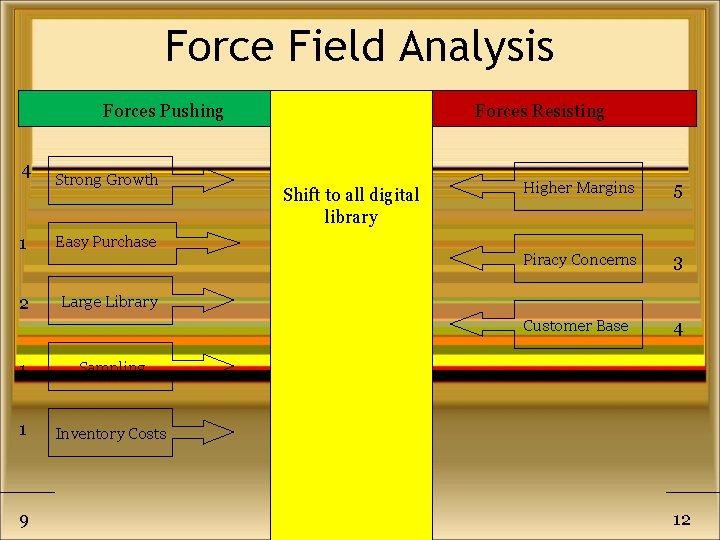
Force Field Analysis Forces Pushing 4 Strong Growth 1 Easy Purchase 2 Large Library 1 Sampling 1 Inventory Costs 9 Forces Resisting Shift to all digital library Higher Margins 5 Piracy Concerns 3 Customer Base 4 12

Digital Media Issues • Future of DRM – Apple switching to DRM free music – Amazon. com DRM free • 3 G – Small Market – Price – Timeline • Adding value to small margins
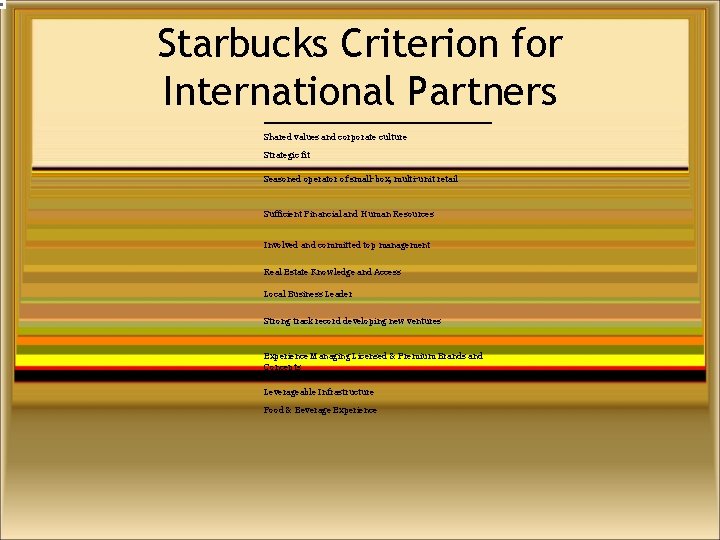
Starbucks Criterion for International Partners Shared values and corporate culture Strategic fit Seasoned operator of small-box, multi-unit retail Sufficient Financial and Human Resources Involved and committed top management Real Estate Knowledge and Access Local Business Leader Strong track record developing new ventures Experience Managing Licensed & Premium Brands and Concepts Leverageable Infrastructure Food & Beverage Experience
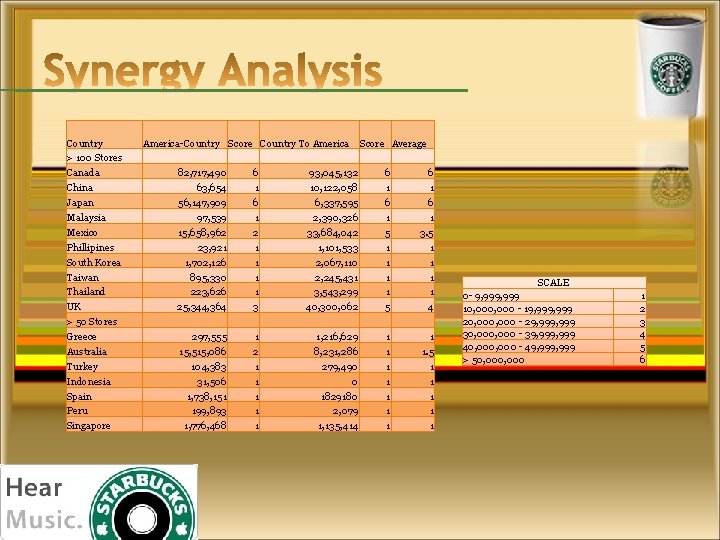
Country > 100 Stores Canada China Japan Malaysia Mexico Phillipines South Korea Taiwan Thailand UK > 50 Stores Greece Australia Turkey Indonesia Spain Peru Singapore America-Country Score Country To America Score Average 82, 717, 490 63, 654 56, 147, 909 97, 539 15, 658, 962 23, 921 1, 702, 126 895, 330 223, 626 25, 344, 364 6 1 2 1 1 3 93, 045, 132 10, 122, 058 6, 337, 595 2, 390, 326 33, 684, 042 1, 101, 533 2, 067, 110 2, 245, 431 3, 543, 299 40, 300, 062 6 1 5 1 1 5 6 1 3. 5 1 1 4 297, 555 15, 515, 086 104, 383 31, 506 1, 738, 151 199, 893 1, 776, 468 1 2 1 1 1, 216, 629 8, 231, 286 279, 490 0 1829180 2, 079 1, 135, 414 1 1 1 1 1. 5 1 1 1 SCALE 0 - 9, 999 10, 000 - 19, 999 20, 000 - 29, 999 30, 000 - 39, 999 40, 000 - 49, 999 > 50, 000 1 2 3 4 5 6

U. S. Format Industry Sales
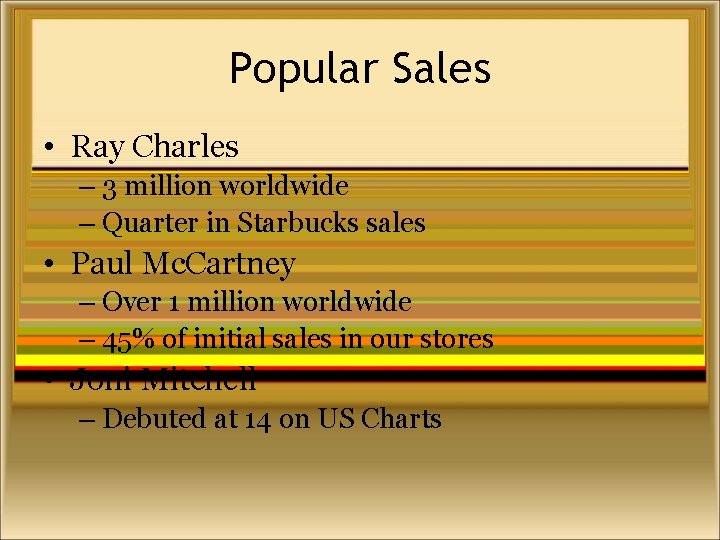
Popular Sales • Ray Charles – 3 million worldwide – Quarter in Starbucks sales • Paul Mc. Cartney – Over 1 million worldwide – 45% of initial sales in our stores • Joni Mitchell – Debuted at 14 on US Charts
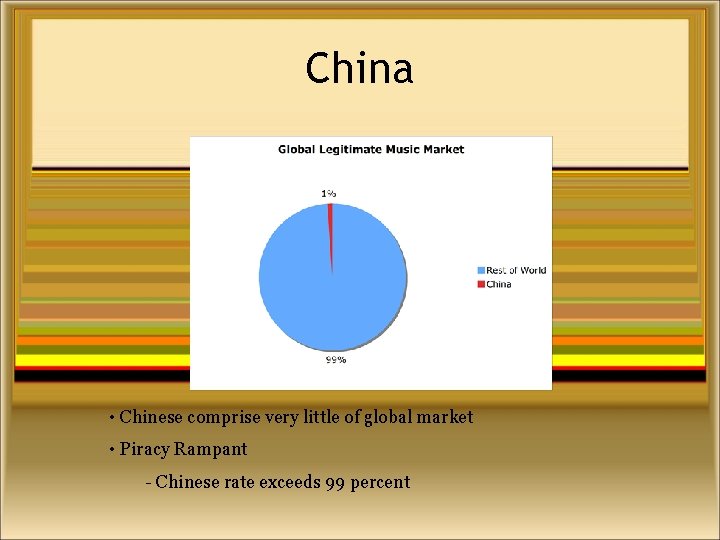
China • Chinese comprise very little of global market • Piracy Rampant - Chinese rate exceeds 99 percent
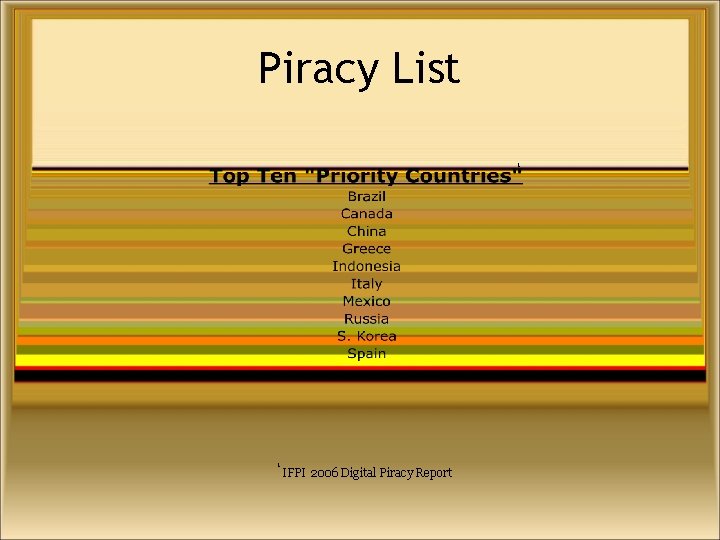
Piracy List 1 1 IFPI 2006 Digital Piracy Report
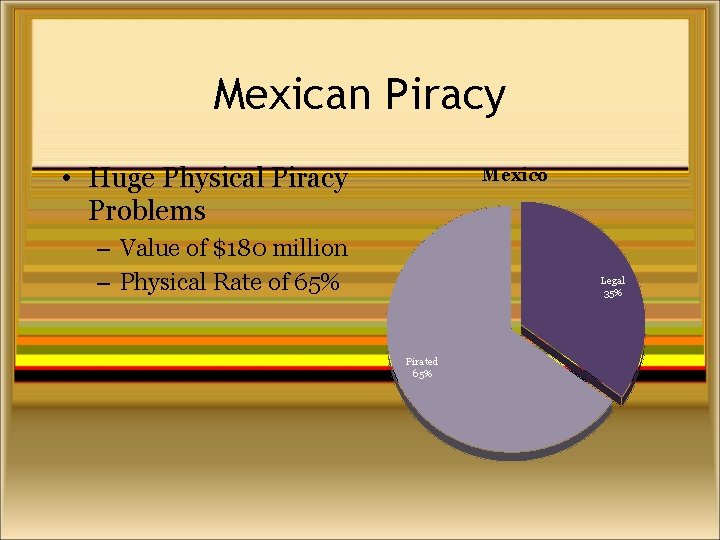
Mexican Piracy • Huge Physical Piracy Problems Mexico – Value of $180 million – Physical Rate of 65% Legal 35% Pirated 65%
Canadian Piracy • Highest per capita file swapping globally – Digital Music accounts for 3% of recorded music revenue instead of 6% globally • Between ‘ 99 and ‘ 05, 42% decrease in annual retail sales – 20% loss in employment
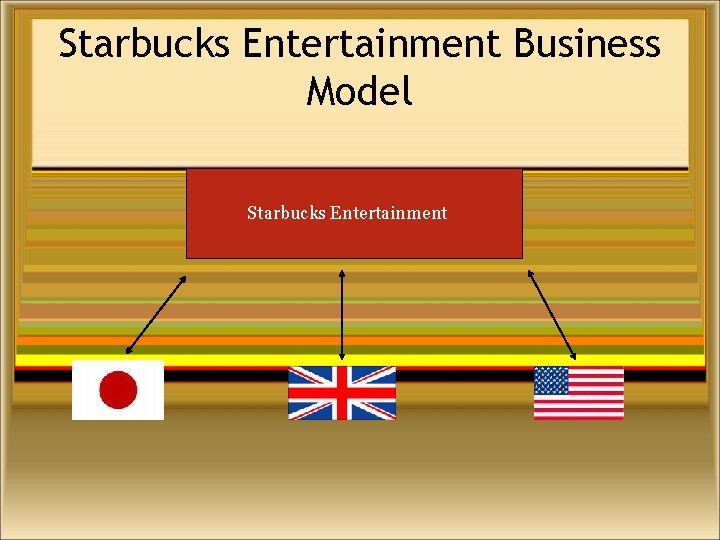
Starbucks Entertainment Business Model Starbucks Entertainment
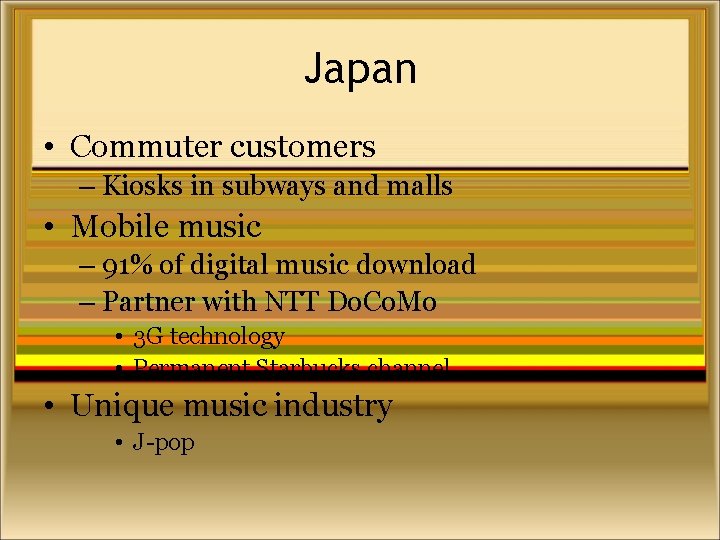
Japan • Commuter customers – Kiosks in subways and malls • Mobile music – 91% of digital music download – Partner with NTT Do. Co. Mo • 3 G technology • Permanent Starbucks channel • Unique music industry • J-pop

Japan • Launch – Hear music label • Compilation CD’s • Exclusivity contracts – Market in Japan and in U. S. & U. K. already • Popularity of J-pop • The 5. 6. 7. 8’s – Kill Bill movie – Popular both locally and regionally
NTT Do. Co. Mo Partnership • Do Communications Over the Mobile Network • 52 million customers • i-mode & 3 G • lifestyle tools • Heavily invested in multi national companies around southeast Asia
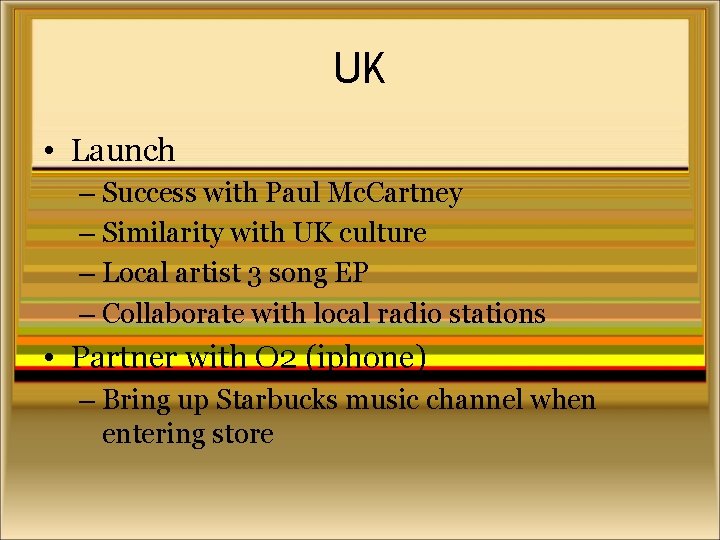
UK • Launch – Success with Paul Mc. Cartney – Similarity with UK culture – Local artist 3 song EP – Collaborate with local radio stations • Partner with O 2 (iphone) – Bring up Starbucks music channel when entering store
• Example of collaboration with radio station www. ukmusic. com • • • Camden Crawl Local talents given a stage Contest Sign on to record label Exclusivity contrast and global exposure
Starbucks • http: //www. starbucks. com/aboutus/Company_Factsheet. pdf • • Japan • http: //query. nytimes. com/gst/fullpage. html? res=9 A 05 E 5 DE 103 EF 932 A 15 753 C 1 A 9679 C 8 B 63 • http: //www. starbucks. co. jp/en/pdf/ir_information_080110. pdf • http: //www. starbucks. co. jp/en/company. html • http: //www. sazaby-league. co. jp/ • http: //www. jetro. go. jp/en/market/attract/retail/market. html • http: //www. nttdocomo. com/about/facts/index. html • UK • http: //www. o 2. com/about_us. asp • http: //www. ukmusic. com/ •
Inventory • Display max. 20 CDs in store • 6 to 8 new products a month – 6 week window accounts for 10 -15% of total record revenue
7, 422 4, 948 2, 474
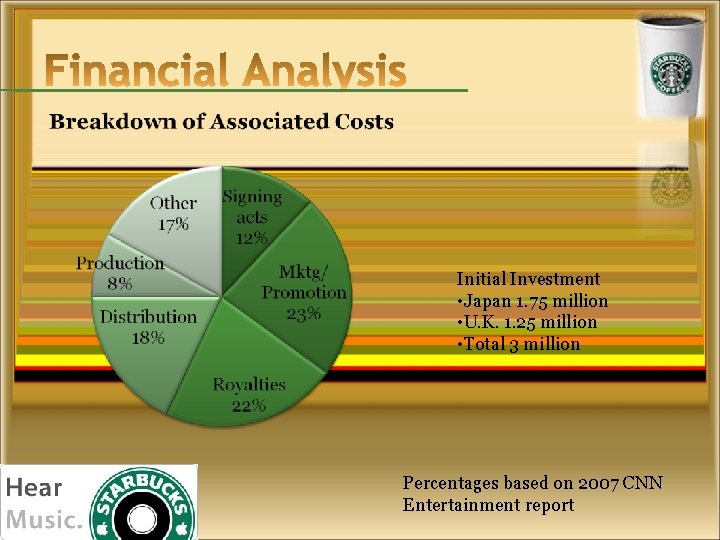
Initial Investment • Japan 1. 75 million • U. K. 1. 25 million • Total 3 million Percentages based on 2007 CNN Entertainment report
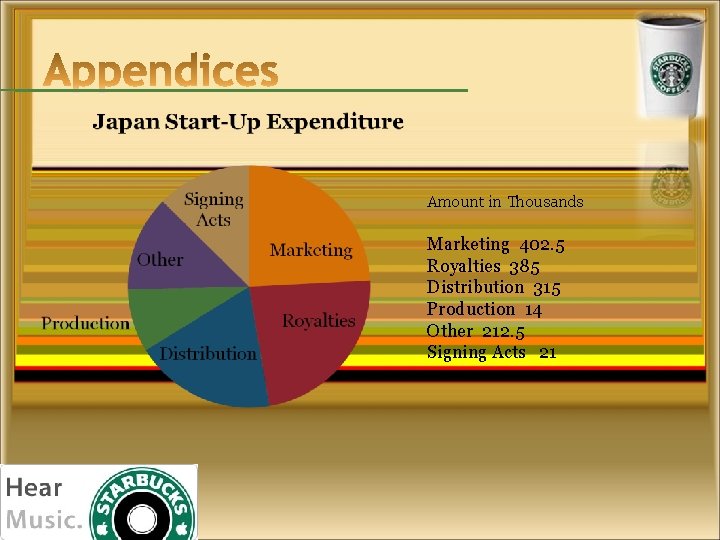
Amount in Thousands Marketing 402. 5 Royalties 385 Distribution 315 Production 14 Other 212. 5 Signing Acts 21
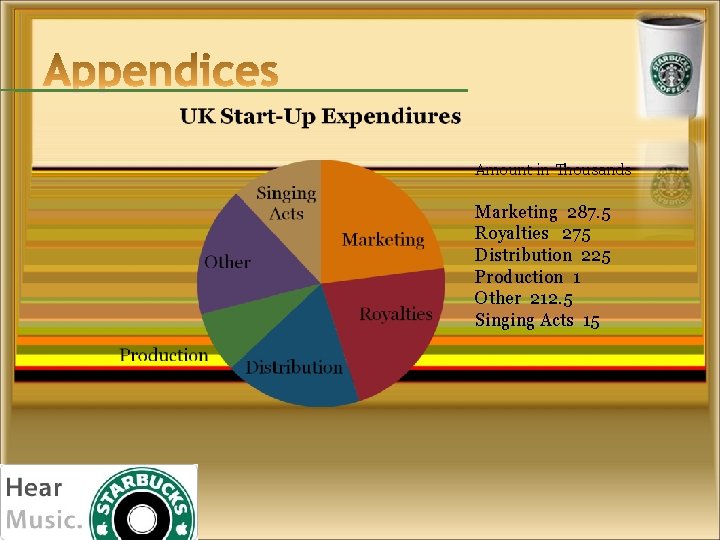
Amount in Thousands Marketing 287. 5 Royalties 275 Distribution 225 Production 1 Other 212. 5 Singing Acts 15

Cost of CD Sales
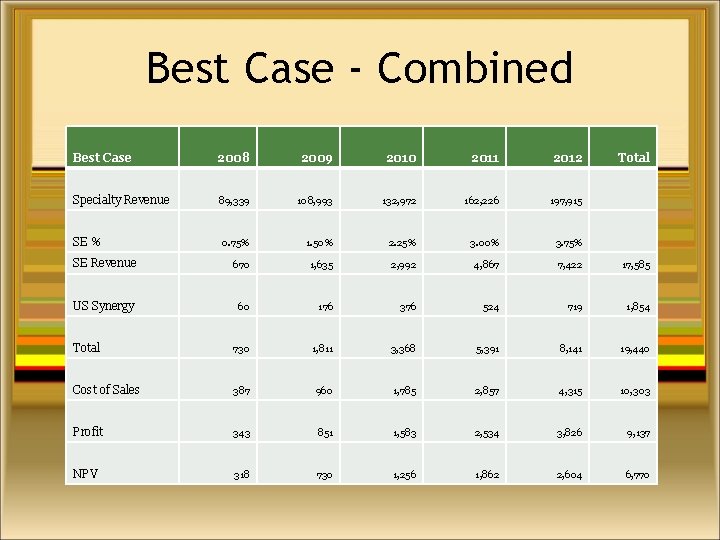
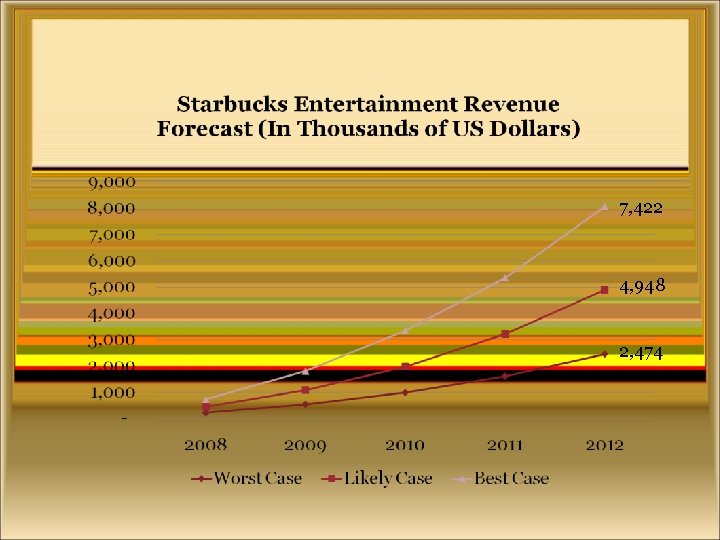
Best Case - Combined Best Case 2008 2009 2010 2011 2012 89, 339 108, 993 132, 972 162, 226 197, 915 0. 75% 1. 50% 2. 25% 3. 00% 3. 75% SE Revenue 670 1, 635 2, 992 4, 867 7, 422 17, 585 US Synergy 60 176 376 524 719 1, 854 Total 730 1, 811 3, 368 5, 391 8, 141 19, 440 Cost of Sales 387 960 1, 785 2, 857 4, 315 10, 303 Profit 343 851 1, 583 2, 534 3, 826 9, 137 NPV 318 730 1, 256 1, 862 2, 604 6, 770 Specialty Revenue SE % Total
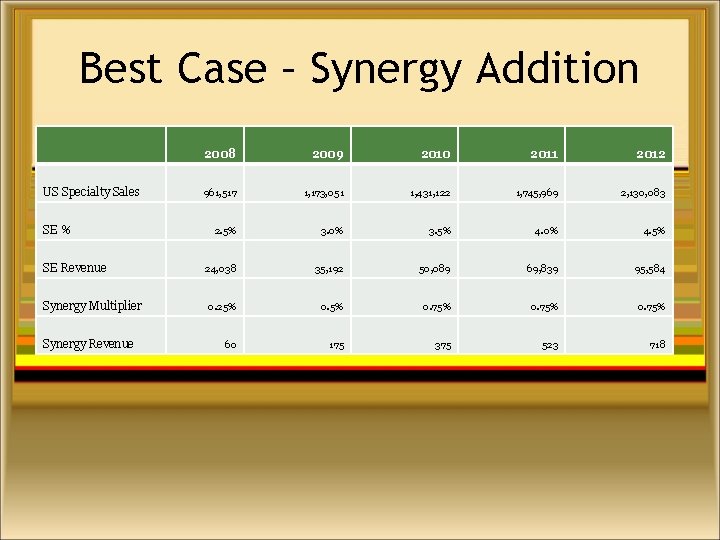
Best Case – Synergy Addition US Specialty Sales SE % SE Revenue Synergy Multiplier Synergy Revenue 2008 2009 2010 2011 2012 961, 517 1, 173, 051 1, 431, 122 1, 745, 969 2, 130, 083 2. 5% 3. 0% 3. 5% 4. 0% 4. 5% 24, 038 35, 192 50, 089 69, 839 0. 25% 0. 75% 60 175 375 523 718 95, 584
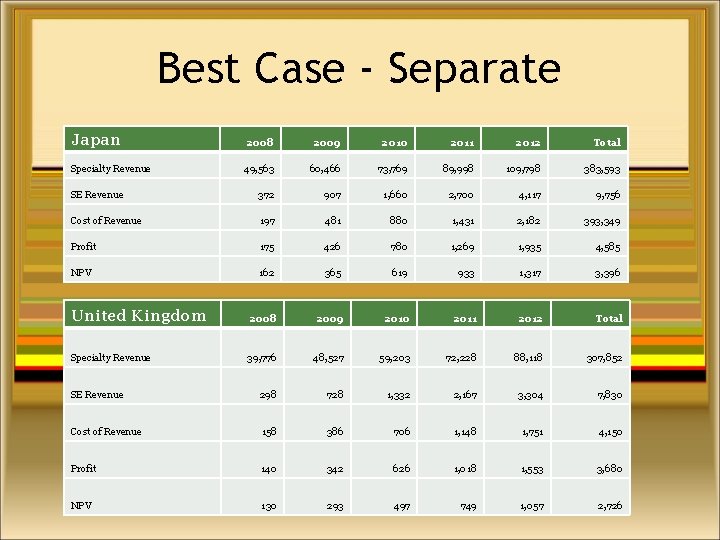
Best Case - Separate Japan 2008 2009 2010 2011 2012 Total 49, 563 60, 466 73, 769 89, 998 109, 798 383, 593 SE Revenue 372 907 1, 660 2, 700 4, 117 9, 756 Cost of Revenue 197 481 880 1, 431 2, 182 393, 349 Profit 175 426 780 1, 269 1, 935 4, 585 NPV 162 365 619 933 1, 317 3, 396 2008 2009 2010 2011 2012 Total Specialty Revenue 39, 776 48, 527 59, 203 72, 228 88, 118 307, 852 SE Revenue 298 728 1, 332 2, 167 3, 304 7, 830 Cost of Revenue 158 386 706 1, 148 1, 751 4, 150 Profit 140 342 626 1, 018 1, 553 3, 680 NPV 130 293 497 749 1, 057 2, 726 Specialty Revenue United Kingdom
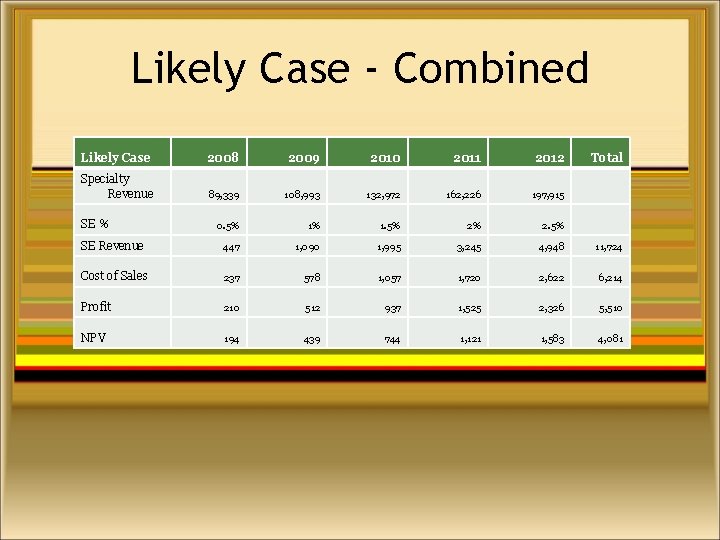
Likely Case - Combined Likely Case 2008 2009 2010 2011 2012 89, 339 108, 993 132, 972 162, 226 197, 915 0. 5% 1% 1. 5% 2% 2. 5% SE Revenue 447 1, 090 1, 995 3, 245 4, 948 11, 724 Cost of Sales 237 578 1, 057 1, 720 2, 622 6, 214 Profit 210 512 937 1, 525 2, 326 5, 510 NPV 194 439 744 1, 121 1, 583 4, 081 Specialty Revenue SE % Total
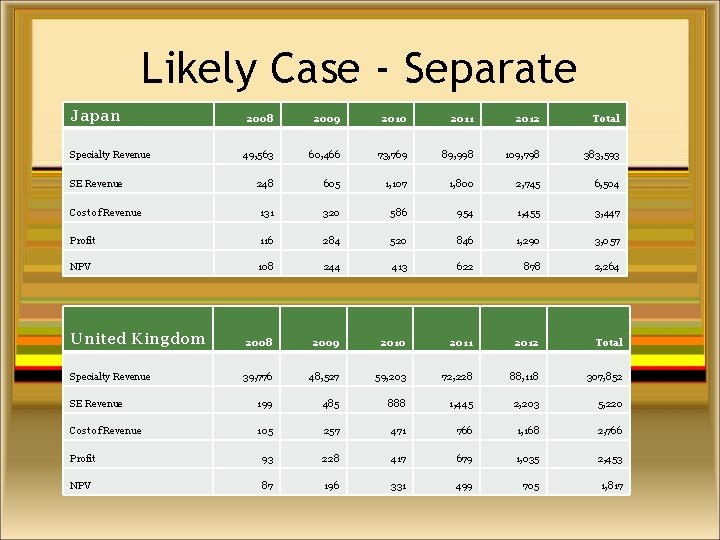
Likely Case - Separate Japan 2008 2009 2010 2011 2012 Total 49, 563 60, 466 73, 769 89, 998 109, 798 383, 593 248 605 1, 107 1, 800 2, 745 6, 504 Cost of Revenue 131 320 586 954 1, 455 3, 447 Profit 116 284 520 846 1, 290 3, 057 NPV 108 244 413 622 878 2, 264 Specialty Revenue SE Revenue United Kingdom 2008 2009 2010 2011 2012 Total 39, 776 48, 527 59, 203 72, 228 88, 118 307, 852 SE Revenue 199 485 888 1, 445 2, 203 5, 220 Cost of Revenue 105 257 471 766 1, 168 2, 766 Profit 93 228 417 679 1, 035 2, 453 NPV 87 196 331 499 705 1, 817 Specialty Revenue
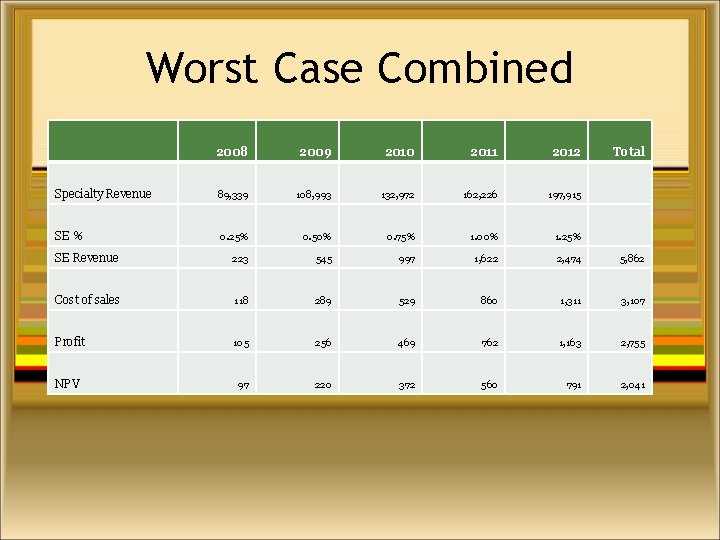
Worst Case Combined Specialty Revenue SE % 2008 2009 2010 2011 2012 89, 339 108, 993 132, 972 162, 226 197, 915 0. 25% 0. 50% 0. 75% 1. 00% 1. 25% Total SE Revenue 223 545 997 1, 622 2, 474 5, 862 Cost of sales 118 289 529 860 1, 311 3, 107 Profit 105 256 469 762 1, 163 2, 755 NPV 97 220 372 560 791 2, 041
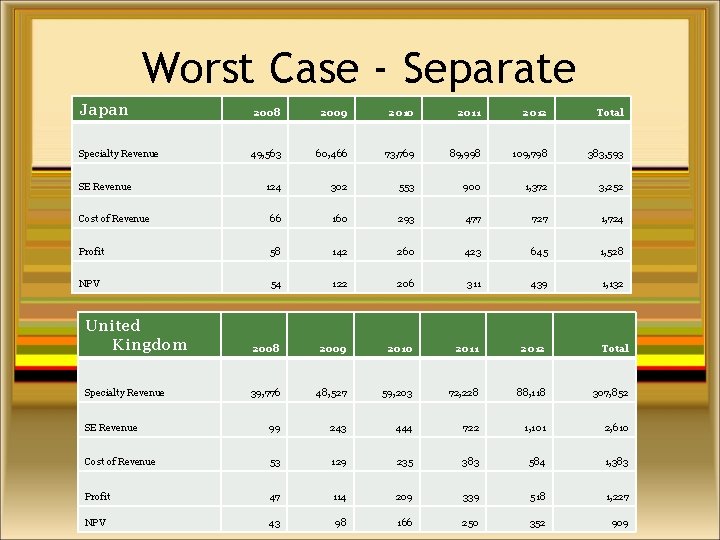
Worst Case - Separate Japan 2008 2009 2010 2011 2012 Total 49, 563 60, 466 73, 769 89, 998 109, 798 383, 593 SE Revenue 124 302 553 900 1, 372 3, 252 Cost of Revenue 66 160 293 477 727 1, 724 Profit 58 142 260 423 645 1, 528 NPV 54 122 206 311 439 1, 132 Specialty Revenue United Kingdom 2008 2009 2010 2011 2012 Total 39, 776 48, 527 59, 203 72, 228 88, 118 307, 852 SE Revenue 99 243 444 722 1, 101 2, 610 Cost of Revenue 53 129 235 383 584 1, 383 Profit 47 114 209 339 518 1, 227 NPV 43 98 166 250 352 909 Specialty Revenue
- Slides: 68