
STAR REPORT NORTHAMPTON COMMUNITY COLLEGE HOSPITALITY MANAGEMENT PROGRAM

- Slides: 29
STAR REPORT NORTHAMPTON COMMUNITY COLLEGE HOSPITALITY MANAGEMENT PROGRAM CLICK HERE FOR AUDIO
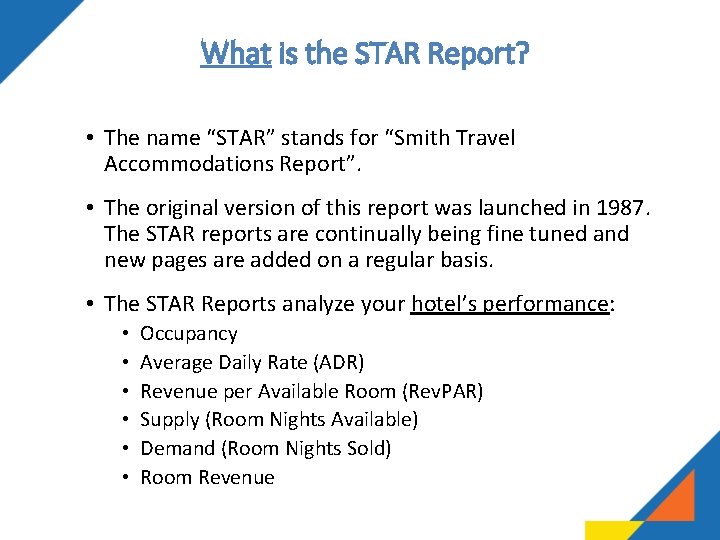
What is the STAR Report? • The name “STAR” stands for “Smith Travel Accommodations Report”. • The original version of this report was launched in 1987. The STAR reports are continually being fine tuned and new pages are added on a regular basis. • The STAR Reports analyze your hotel’s performance: • • • Occupancy Average Daily Rate (ADR) Revenue per Available Room (Rev. PAR) Supply (Room Nights Available) Demand (Room Nights Sold) Room Revenue
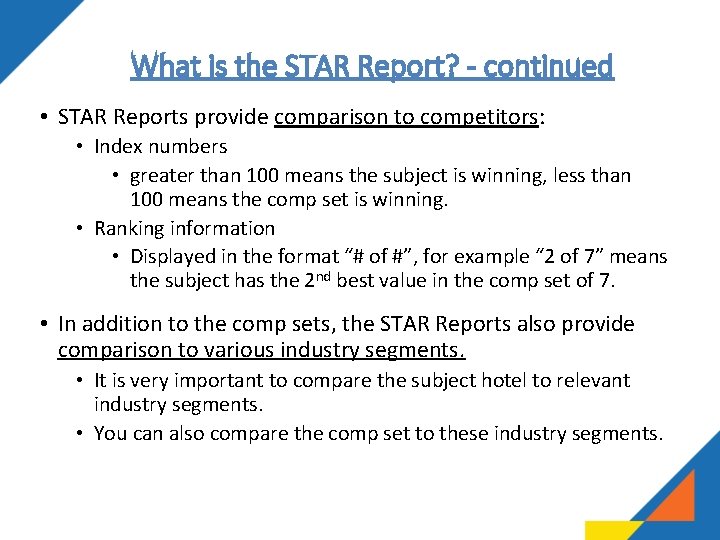
What is the STAR Report? - continued • STAR Reports provide comparison to competitors: • Index numbers • greater than 100 means the subject is winning, less than 100 means the comp set is winning. • Ranking information • Displayed in the format “# of #”, for example “ 2 of 7” means the subject has the 2 nd best value in the comp set of 7. • In addition to the comp sets, the STAR Reports also provide comparison to various industry segments. • It is very important to compare the subject hotel to relevant industry segments. • You can also compare the comp set to these industry segments.
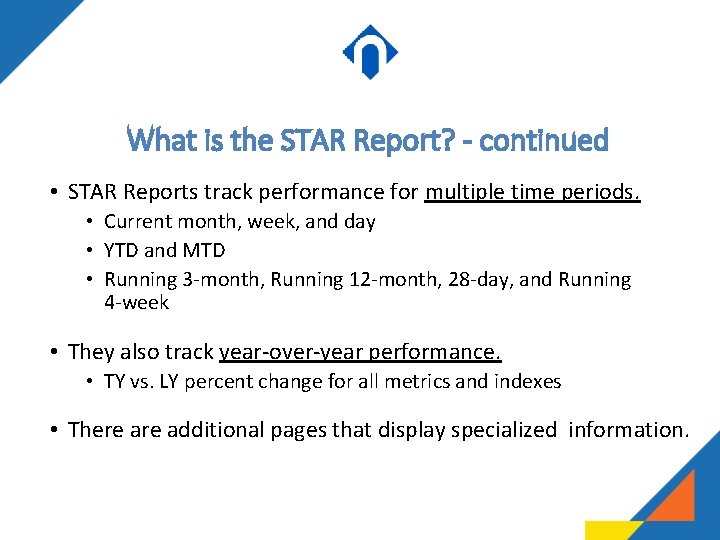
What is the STAR Report? - continued • STAR Reports track performance for multiple time periods. • Current month, week, and day • YTD and MTD • Running 3 -month, Running 12 -month, 28 -day, and Running 4 -week • They also track year-over-year performance. • TY vs. LY percent change for all metrics and indexes • There additional pages that display specialized information.
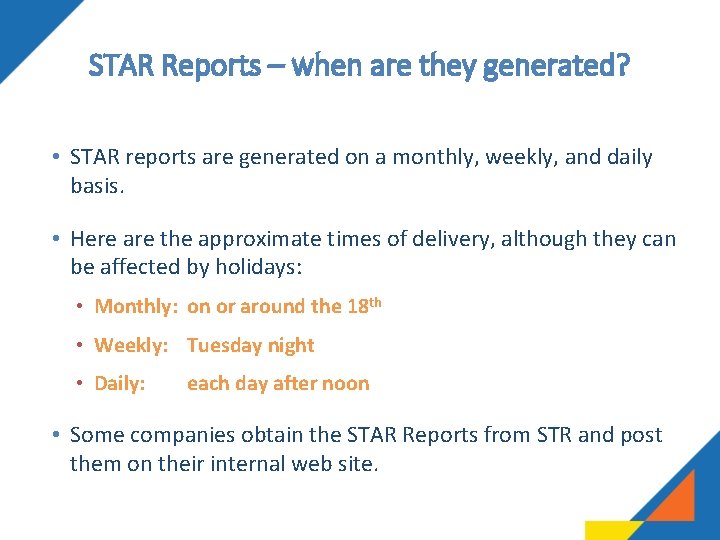
STAR Reports – when are they generated? • STAR reports are generated on a monthly, weekly, and daily basis. • Here are the approximate times of delivery, although they can be affected by holidays: • Monthly: on or around the 18 th • Weekly: Tuesday night • Daily: each day after noon • Some companies obtain the STAR Reports from STR and post them on their internal web site.
Why do I need the STAR Report? • Benchmarks your performance. • Allows you to keep an eye on your competitors and your market. • Lends perspective to good and bad performance. • Aids pricing decisions, helps improve profitability. • Allows you to monitor the effect of your business strategies. • View Supply, Demand, & Revenue changes in your market (new hotels, more travelers, more money).
Benchmarking 101: my hotel vs. the competition
How do I use the STAR Report? – hints • Start by looking at Rev. PAR and then drill down and check Occupancy and ADR. • Indexes make it easy to see whether you won or lost. Ranking shows your position. • Start with YTD, and Running numbers to see monthly data in perspective. • Start with Weekday/Weekend numbers and drill down into specific Days of the Week looking for opportunities to improve. • If Segmentation data is available, drill down from total to Group, Transient, and Contract metrics looking for opportunities to improve.
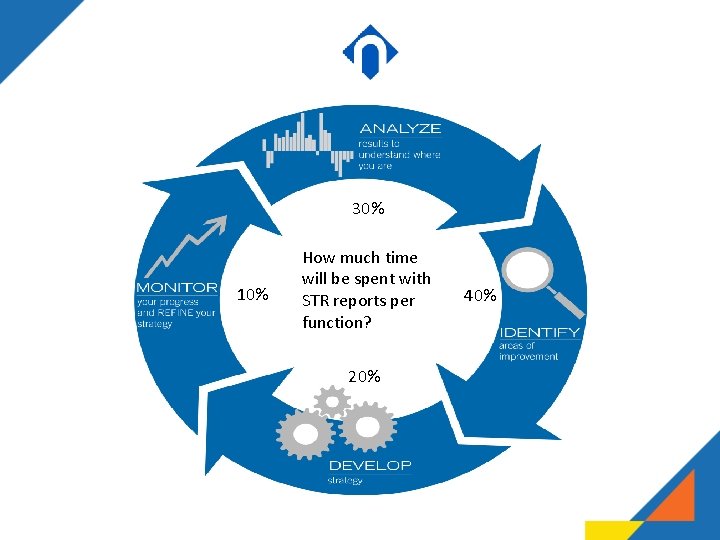
30% 10% How much time will be spent with STR reports per function? 20% 40%
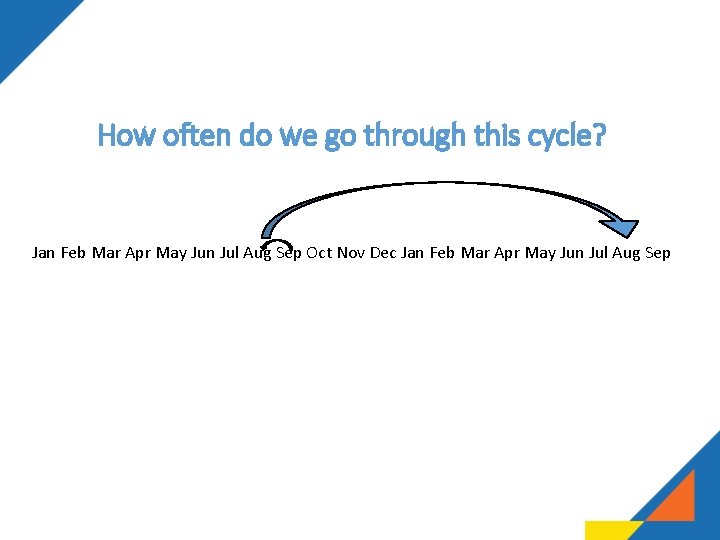
How often do we go through this cycle? Jan Feb Mar Apr May Jun Jul Aug Sep Oct Nov Dec Jan Feb Mar Apr May Jun Jul Aug Sep
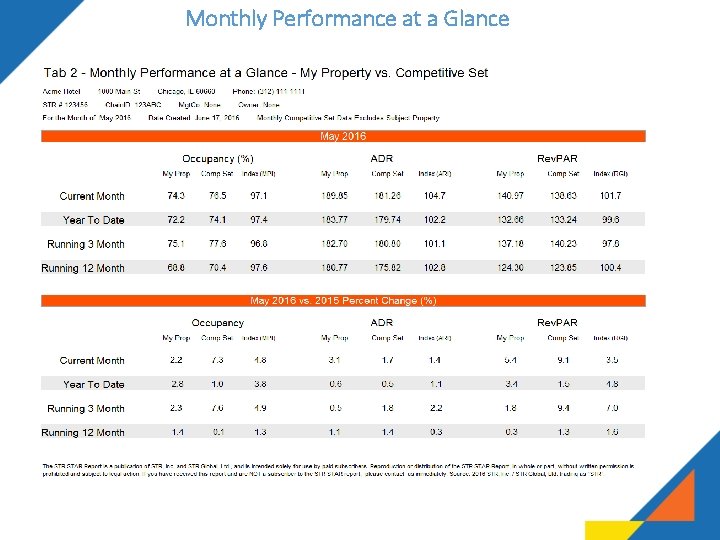
Monthly Performance at a Glance
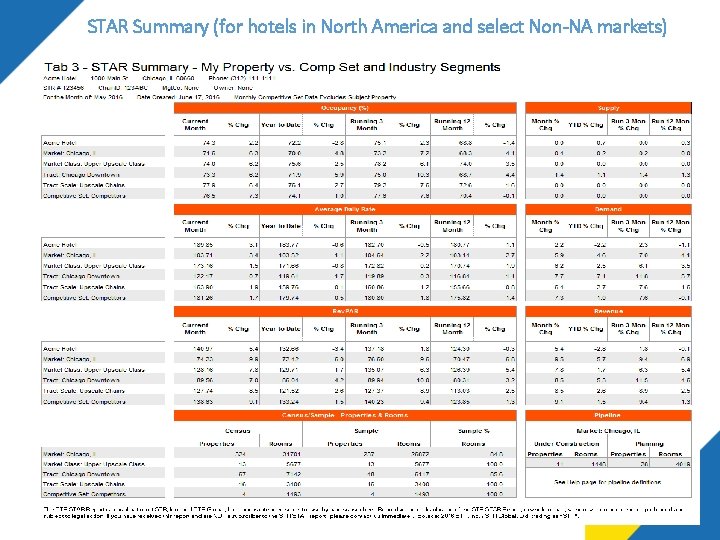
STAR Summary (for hotels in North America and select Non-NA markets)
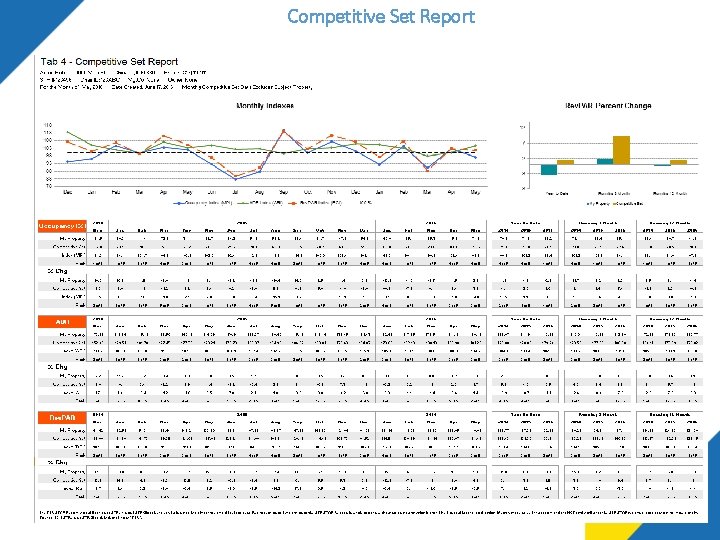
Competitive Set Report
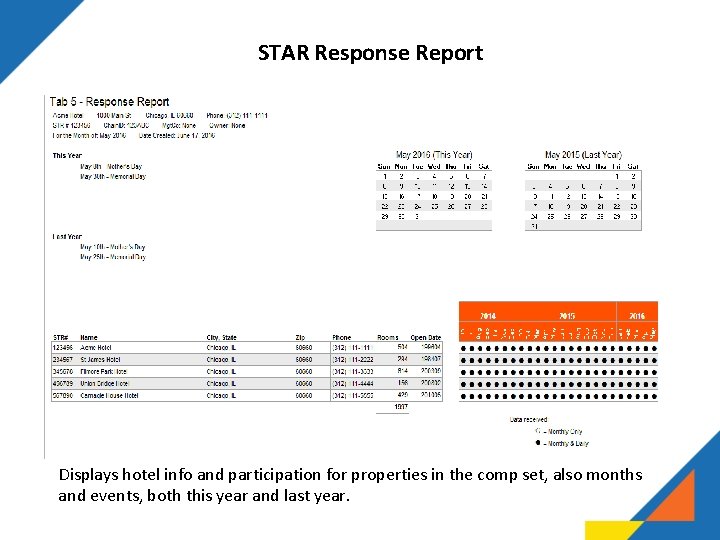
STAR Response Report Displays hotel info and participation for properties in the comp set, also months and events, both this year and last year.
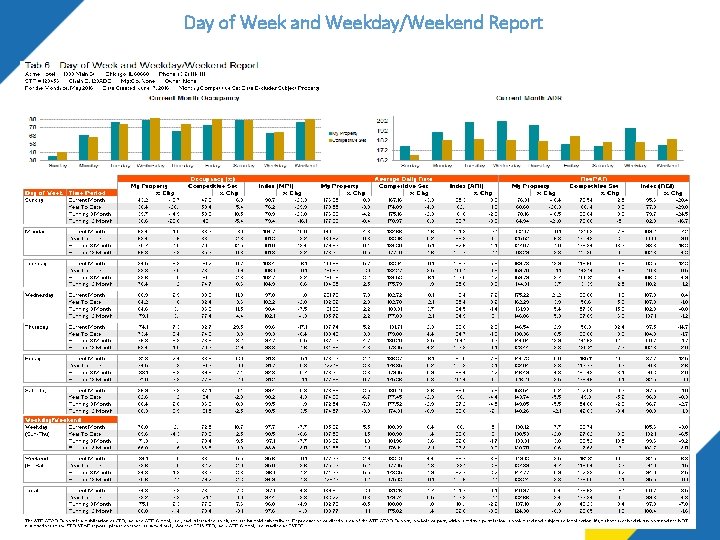
Day of Week and Weekday/Weekend Report
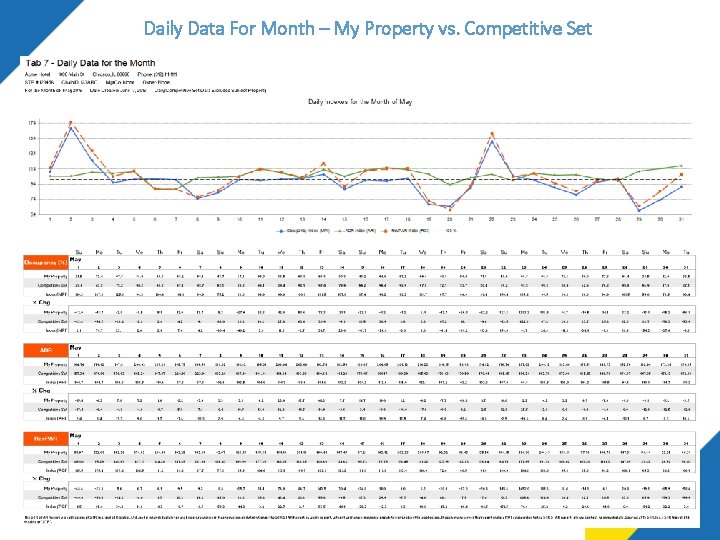
Daily Data For Month – My Property vs. Competitive Set
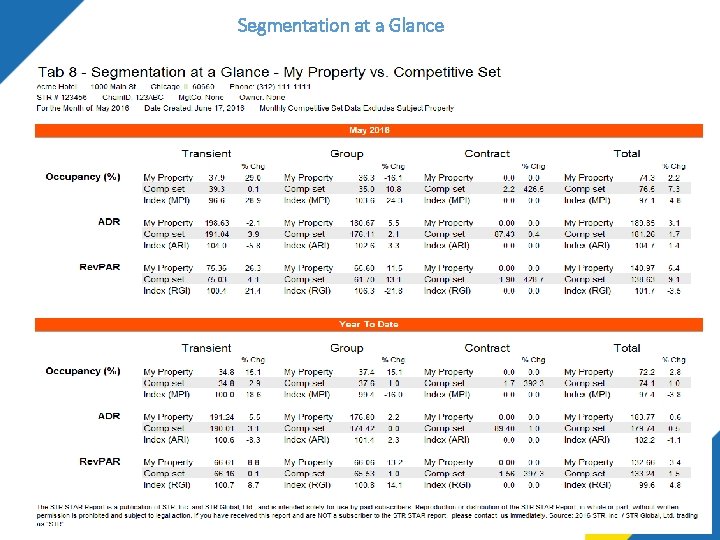
Segmentation at a Glance
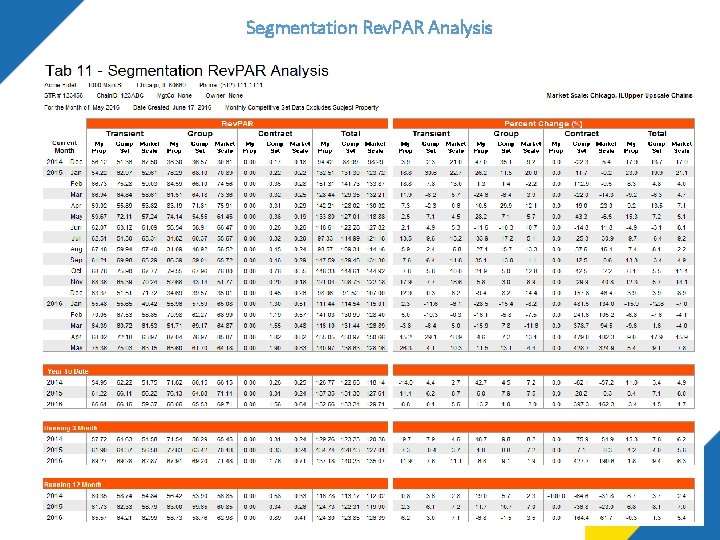
Segmentation Rev. PAR Analysis
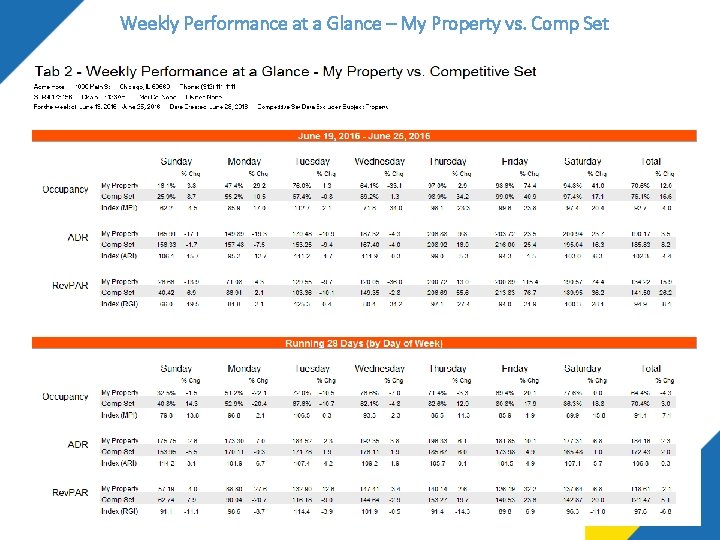
Weekly Performance at a Glance – My Property vs. Comp Set
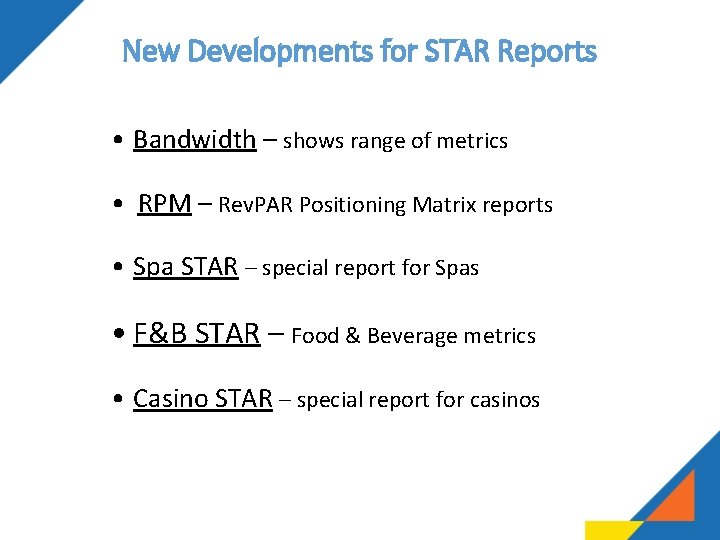
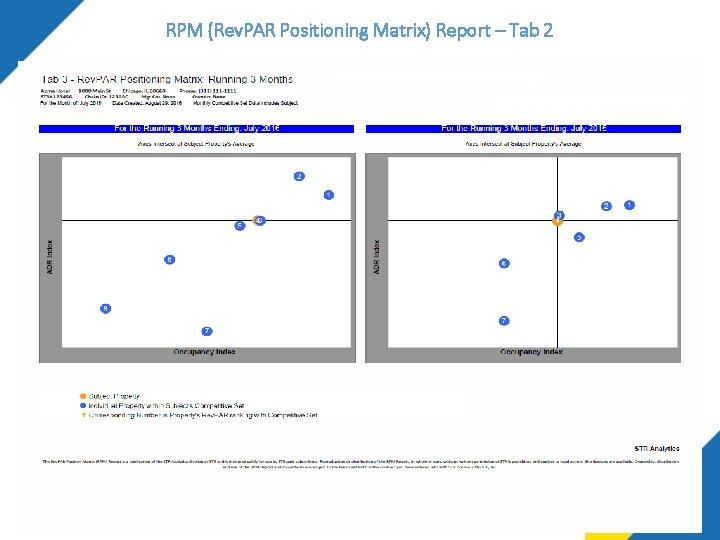
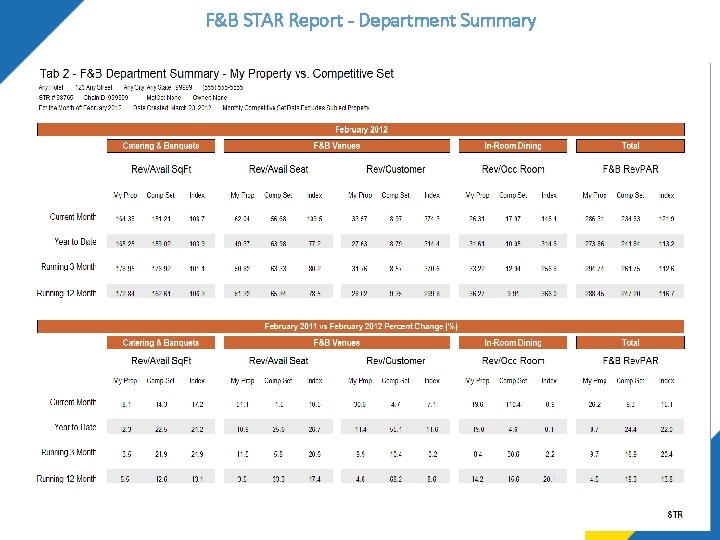
New Developments for STAR Reports • Bandwidth – shows range of metrics • RPM – Rev. PAR Positioning Matrix reports • Spa STAR – special report for Spas • F&B STAR – Food & Beverage metrics • Casino STAR – special report for casinos
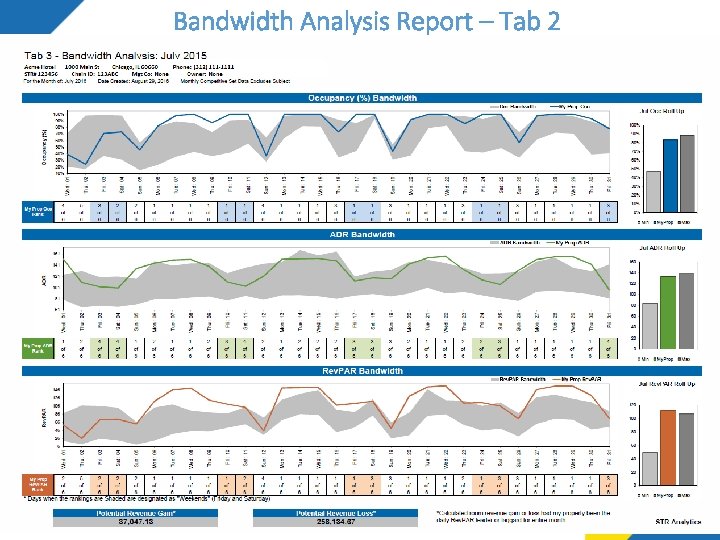
Bandwidth Analysis Report – Tab 2
RPM (Rev. PAR Positioning Matrix) Report – Tab 2
F&B STAR Report - Department Summary
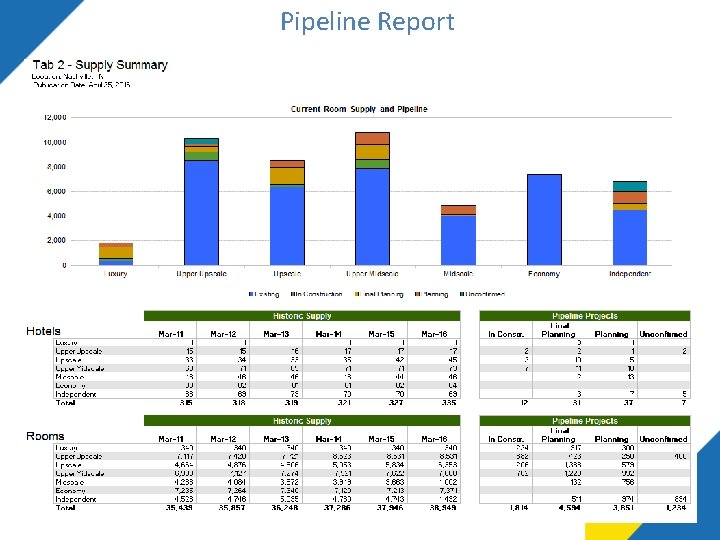
Pipeline Report
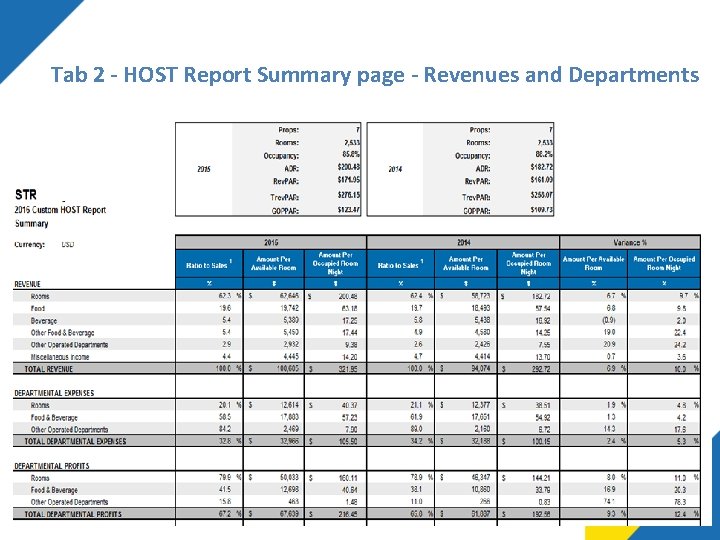
Tab 2 - HOST Report Summary page - Revenues and Departments
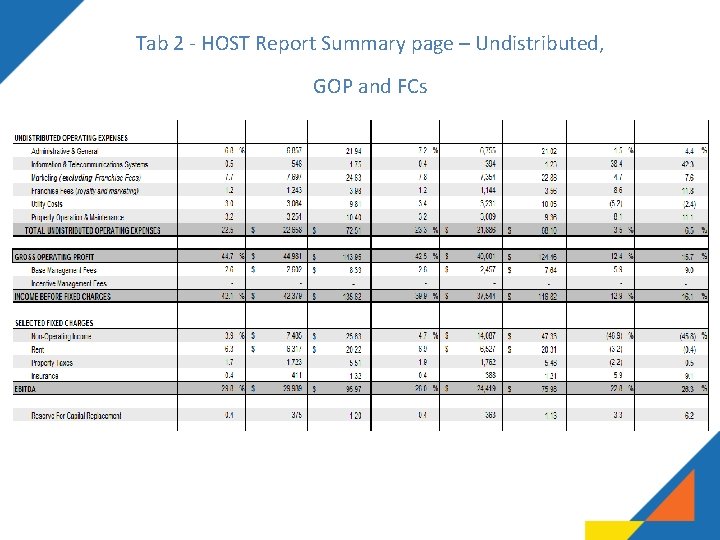
Tab 2 - HOST Report Summary page – Undistributed, GOP and FCs
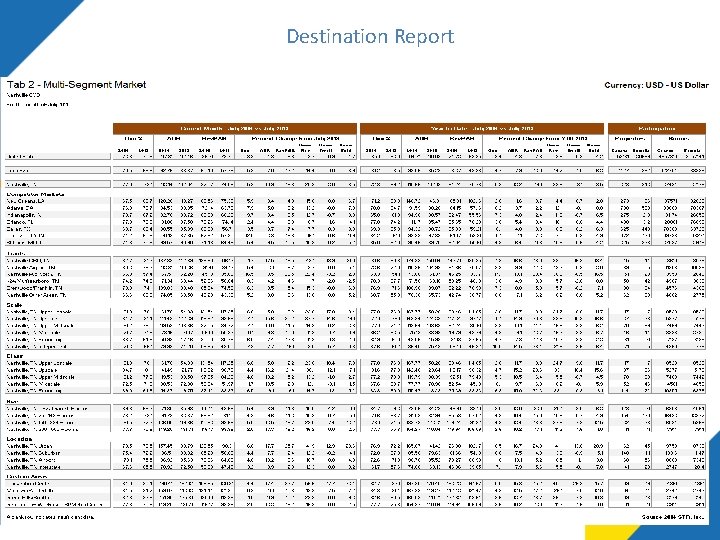
Destination Report
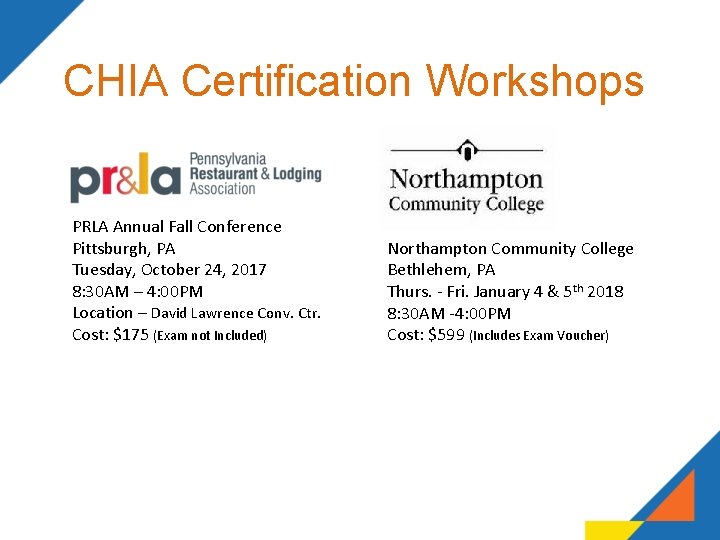
CHIA Certification Workshops PRLA Annual Fall Conference Pittsburgh, PA Tuesday, October 24, 2017 8: 30 AM – 4: 00 PM Location – David Lawrence Conv. Ctr. Cost: $175 (Exam not Included) Northampton Community College Bethlehem, PA Thurs. - Fri. January 4 & 5 th 2018 8: 30 AM -4: 00 PM Cost: $599 (Includes Exam Voucher)
THANK YOU FOR ATTENDING!