Star galaxy quasar and star spectral types classification


 ► Light is")


")
")


 of the source is shifted to")


- Slides: 44
Star, galaxy, quasar and star spectral types classification with broadband photometry Zhixin Wang
Purpose ► Explore machine learning methods for the classification of photometric data.
Photometry ► Measuring the flux radiated by astronomical objects(e. g stars) ► Light is gathered by a telescope ► Pass light through a set of bandpass filters ► Measure light intensity with a CCD photometer ► Source extraction is performed on the CCD image data ► Flux is converted to instrumental magnitude, and then calibrated against some standard stars to get the apparent magnitude
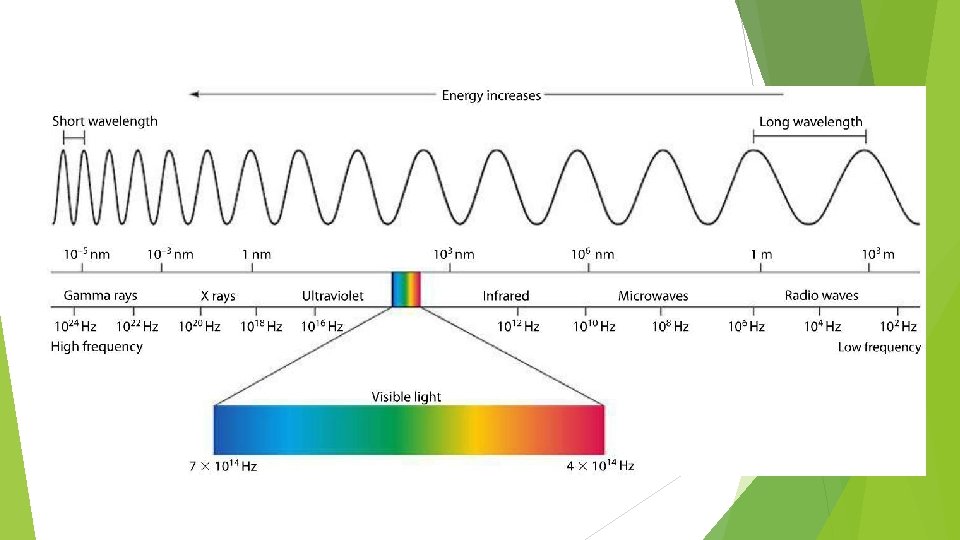
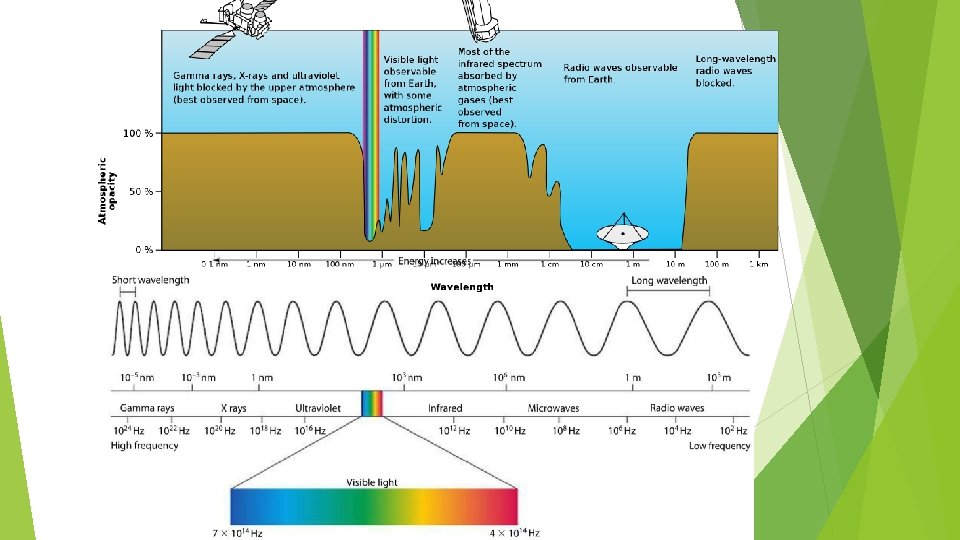
What is light? ► Astronomical objects emit electromagnetic radiation at different wavelength
Spectrum
Spectrum ≈ Continuum + Absorption/Emission lines Star: blackbody radiation Galaxy: Superposition of stellar spectrum
Spectrum ≈ Continuum + Absorption/Emission lines Quasar: Host galaxy light + Superposition of thermal radiation from different parts of the accretion disk; show a broad and flat flux distribution
Passband: Spectrum -> Photometry ► A filter selectively transmits light(only those within a range of wavelength can pass) ► The characteristic of a filter is described by its transmission curve ► Photometric system is a set of well-defined passband that is usually used in observations. (i. e. observing an object through different filters)
Charge Coupled Device(CCD)
Charge Coupled Device(CCD)
Photometric data & Label Photometric data from SAGE survey
Machine learning ► How can machines help us to classify astronomical objects? ► Supervised learning algorithm: Infer a function based on training data that predicts an output value based on the inputs. ► In our project… ► Task: classification ► Input: Magnitudes at each passband ► Output: class label(star, galaxy, quasar) ► Algorithm: learn the function f(input) -> output ► Where’s the training data?
Spectroscopic survey ► Spectroscopic surveys directly measure the spectrum of the sources(instead of using certain passbands) ► Type of an object can be very accurately determined through template fitting techniques(e. g https: //arxiv. org/pdf/1207. 7326. pdf, for BOOS survey) ► Therefore, we consider the labels provided by the spectroscopic surveys as the ground truth ► The next step is to cross-match objects in the SAGE catalog with those in the spectroscopic survey
Cross-matching ► Cross-matching is done based on the celestial coordinates ► A Python package for the R tree algorithm is used ► A matching radius of 2 arcsec is used ► The SAGE catalog is matched with the spectrum observed in the LAMOST survey.
Photometric data & Label Photometric data from SAGE survey Matched Labels
Data Pre-processing ► Correct for interstellar extinction ► Lights from distance stars or galaxies were absorbed by interstellar medium. ► We utilize the dust map given by Schlegel et al. 1998 to correct for this effect. ► Magnitute-limited sample: ► The two surveys have different depth. Therefore, in order to maintain the completeness of the training data, we only select objects with g-band magnitude g<19 mag. ► Convert to photometric colors ► We convert the five passband magnitudes to four photometric colors. Color index is defined as the difference between magnitude at two bands.
Visualization
Visualization
Splitting To evaluate and optimize the performance of the model, we split the data to training, validation, and test sets. The model will be trained on the training set, tuned on the validation set, and finally tested on the test set
Algorithm: Random Forest ► The Random Forests algorithm creates ensemble of decision trees, trained on a subset of the dataset that is created by bootstrap aggregating(bagging), and implements random selection of features at each decision tree split. ► Supervised, for task of classification ► RF 1: for classifying stars, galaxies, and quasars ► RF 2: for assigning star spectral types(OBAFGKM)
Tuning
Tuning
Tuning
Results
Results
Results
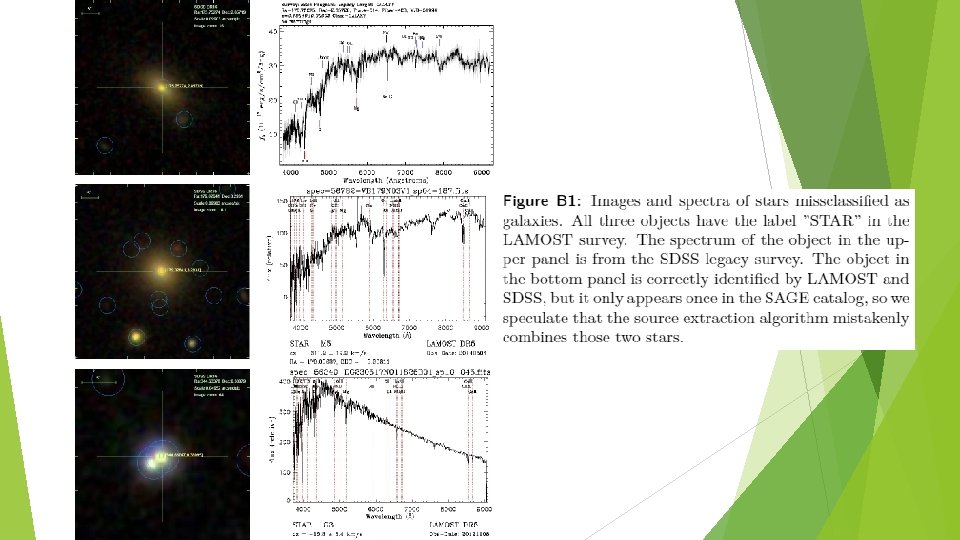
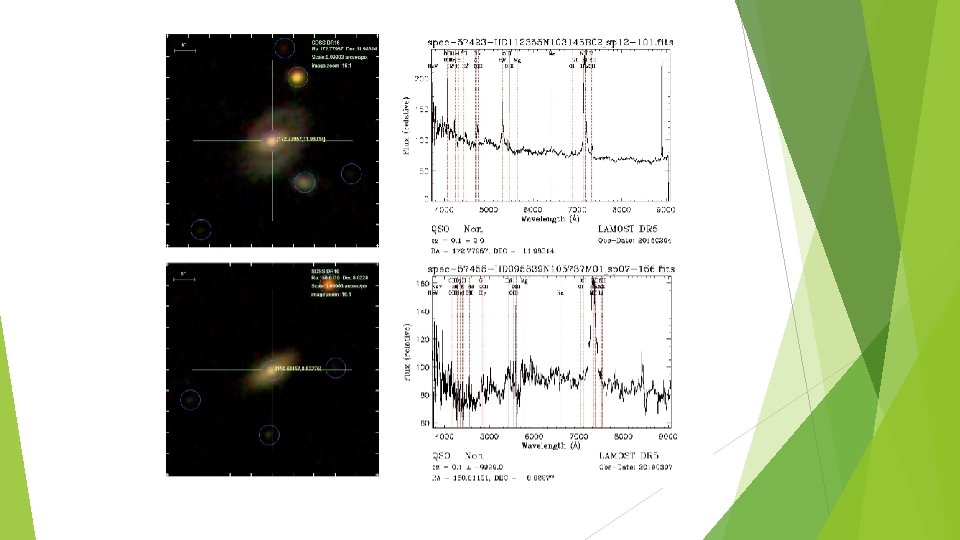
Discussion: Misclassified samples Star->Galaxy ► Misclassification in the LAMOST 1 D pipeline ► Two stars aligned on almost the same line of sight
Discussion: Misclassified samples Galaxy->Star, Quasar ► Galaxies misclassified as stars and quasars are located at the border of the decision boundary in the color space(based on probabilities. . . ) ► This indicates that the model is lack of discriminative power between these classes ► Inclusion of morphological features may reduce this type of error
Redshift? Effect of redshift: The spectral energy distribution(SED) of the source is shifted to longer wavelength
Redshift?
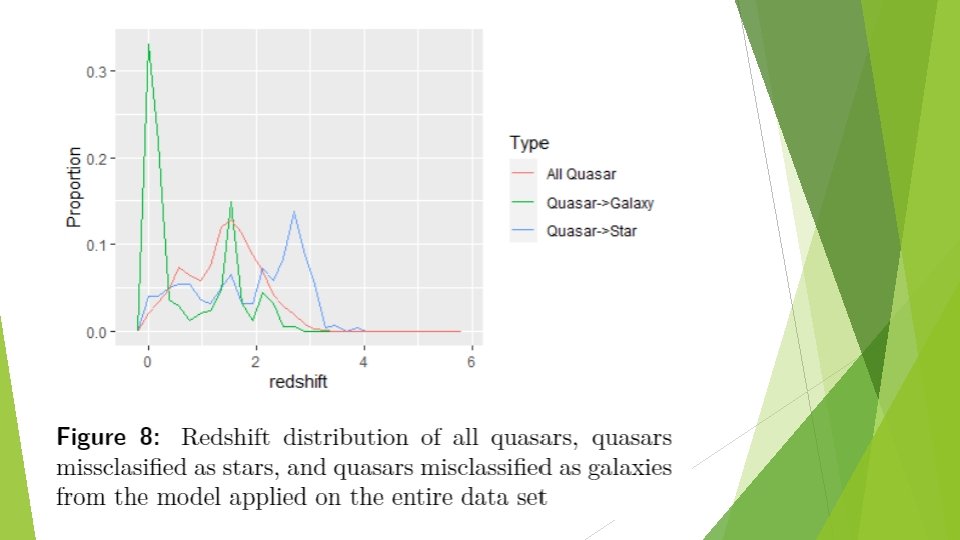
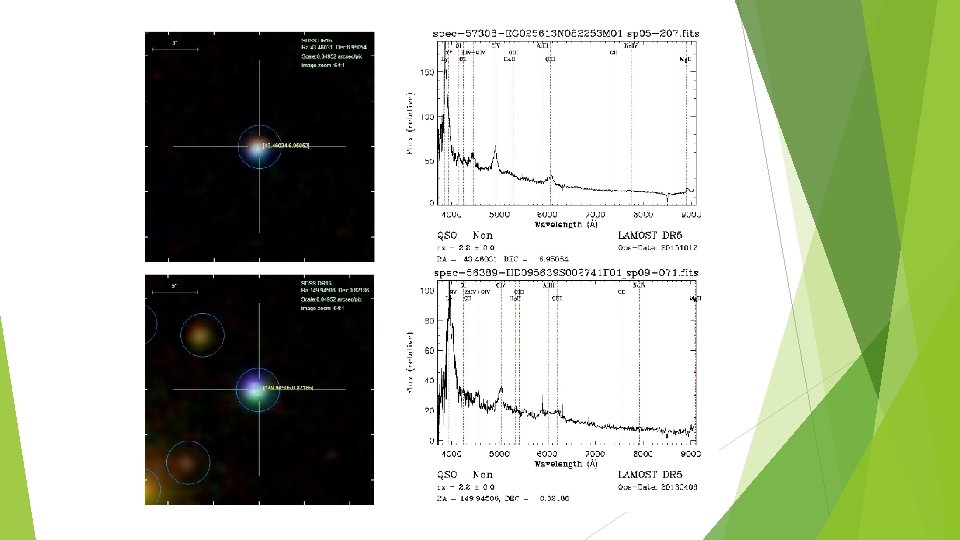
Discussion: Misclassified samples Quasar->Star ► Quasars missclassified as stars tend to have larger redshifts than other quasars(2. 2<z<3) ► Similar color in optical bands & Limited training data ► This type of error can be reduced by including near-IR bands into the model. Because quasar spectrum is a mostly flat continuum through infrared, but the flux density of a blackbody spectrum(stars) decreases as wavelength increases
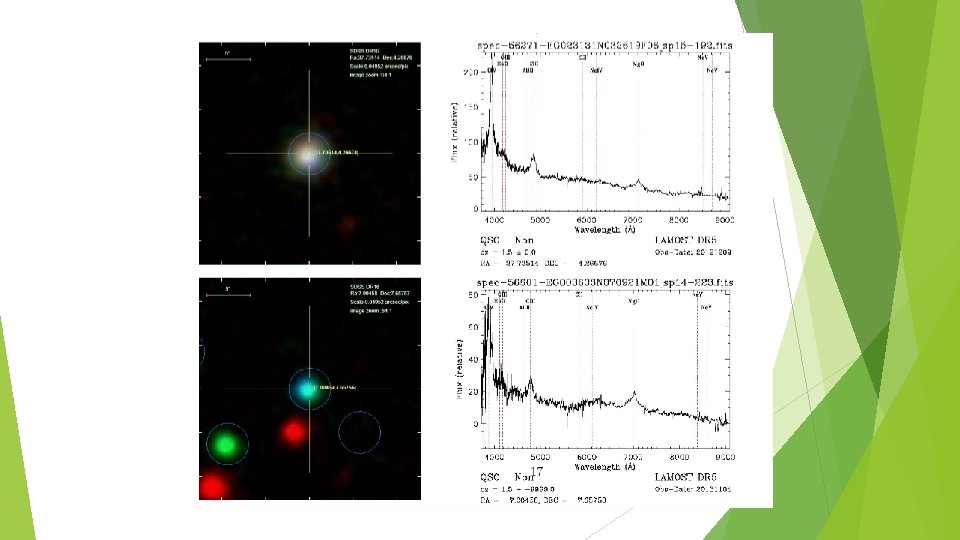
Discussion: Misclassified samples Quasar->Galaxy ► For those with low redshift values, the lights from their host galaxy can be comparable to that of the active galactic nucleus, resulting in a galaxy-like spectrum. ► We speculate that the two peaks(z around 1. 6 and 2. 2) in the redshift distribution of missclassified quasars resulted from certain spectral line being redshifted to certain wavelengths.
Discussion: Spectral types ► Those class with limited amount of data (white dwarf, type B star) show poor performance ► There's no clear cut between the MK classes of stars either in the color space or with other spectral features. (think of it as binning instead of classifying) ► Effective temperature regression may provide more accurate information
Summary ► We implement the random forest algorithm to classify star, galaxy and quasar using four photometric color. ► The overall accuracy of the model is 99. 54%, and the F 1 score for the three classes are 0. 998, 0. 935 and 0. 770. ► The model can provide reliable labels for the objects observed in the SAGE survey with g mag < 19. ► The overall accuracy for the stellar classification model is 82. 09%. This model still can be improved
Future Work ► Possible improvements ► Including morphological features: Several previous studies utilized morphological features to separate galaxies from other objects and results show that those features usually have higher importance than photometric ones(magnitude or color) ► Extend to near-IR: By combining the SAGE survey catalog with near-IR measurements, we can effectively classify those high-redshift objects. ► More training data: the extragalactic catalog of LAMOST survey is largely incomplete at deeper magnitudes(g > 20 mag). Matching our current data with other spectroscopic catalogs can help us to extend the model to fainter objects.
Future Work ► Future directions ► Compare different ML methods: We can test different supervised or unsupervised ML methods on a subset of the data to find the most effective one for this task. ► Deep Learning: Instead of building a model from the extracted magnitudes, we can use deep learning methods(e. g CNN) to directly classify sources from the raw image data. ► Stellar parameter regression: After separating stars from other objects, we can train a model to estimate the stellar parameters(i. e. effective temperature, surface gravity, metallicity) which will provide more information for future studies on this catalog.
Questions