Standards Unit N 6 Developing Proportional Reasoning Calculators
. 60")


- Slides: 13
Standards Unit N 6: Developing Proportional Reasoning Calculators (at least 1 between 2). 60 -90 mins. There is no card sorting involved in this lesson. The ‘cards’ are merely templated problems, and are not sorted or positioned in any way. I may have had such cards created, but they are useless. Discard if found.
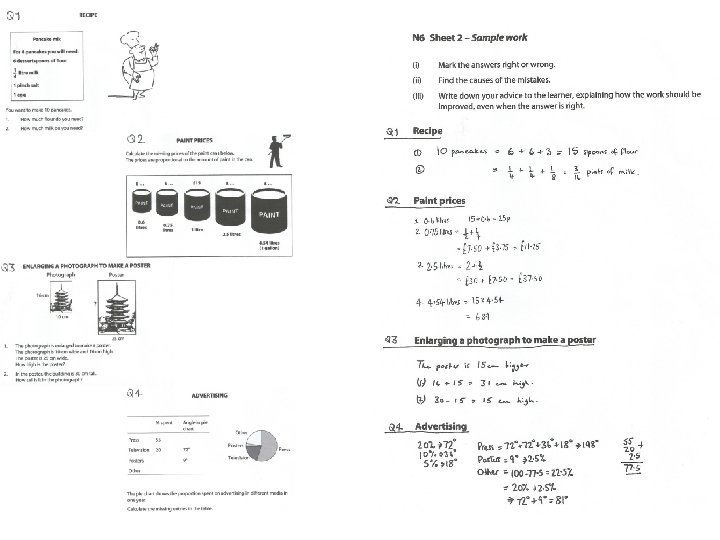
Consumable Resources Needed: Each student needs 1 A 4 copy of Sheet 2, Sample work to write on and ‘mark’. Each student needs 1 A 4 copy of Sheet 3, Making up Your own Questions. Photocopy a double-sided sheet containing both (1 is already created, and held with other resource sheets Re-usable Resources Needed: I have 13 copies of the Questions – enough to share between 2 or 3 students.
Solve these problems
All these problems involved two quantities Q 1 No. of pancakes & Amount of ingredients Q 2 Quantity of paint & Cost of paint Q 3 Height of poster & Width of poster Q 4 % of money spent & Angle in the Pie chart They are all proportional because if we multiply the first quantity by something (say x 3), we must multiple the second quantity by the same amount
What other pairs of things are proportional? 1. 2. 3. 4. 5. Faster you go, further you travel. Circumference of a circle, and its radius The nights you stay in a hotel, and the total cost The amount of savings you have in a bank, and the interest you get. The amount you spend in a supermarket, and the number of school vouchers you get. Some things that are NOT proportional? 1. 2. 3. 4. 5. 6. The faster you go, the LESS time it takes to get there. The amount you eat, and how full you feel. How much you talk, and how much you listen How much exercise you do, and how much you sleep. How old you are, and your pocket money Your age and your height
Solving Proportion Problems in 1 Step litres £ Proportion problems are really just multiplication problems! You usually just have to find the multipliers.
Solving Proportion Problems in 1 Step What do you think this diagram means? litres £ 4 10 7 ? What are the multipliers now?
Solving Proportion Problems in 1 Step Another example. What does this mean? litres £ 7 18 2. 5 ? What are the multipliers now?
Solving Proportion Problems in 2 Steps Or you might find this 2 -step method easier 4 10 1 ? 7 ?
Your Turn Solve any problems you couldn’t do using the new diagram method. (or use it instead of the method you used previously) 1
Now… Some of these cards describe Proportional problems, and some don’t. 1. Decide if each is a proportional problem. If it isn’t, draw a line through it! 2. For all remaining problems, create your own (quite difficult) problems. 3. In your exercise books, use one of the diagram methods, or your own method, to solve all your own problems. 1
Review How do you know if a situation is proportional or not? Are each of these statements True or False? ther doubles. o e th , s le b u o d e If one valu r is zero too. he ot e th , ro ze is e lu va e on If If you add one to one value, you must add one to the other too. If one value is on e, the other is on e too. If you were to plot a graph of one value against the other, it would be a straight line through the origin. If you were to plot a graph of one value against the other, it would be a straight horizontal line.