Standard Deviation Chemistry 141 Precision and Accuracy Accuracy


2 1 9. 6 -0. 4 . 16")


- Slides: 23
Standard Deviation Chemistry 141
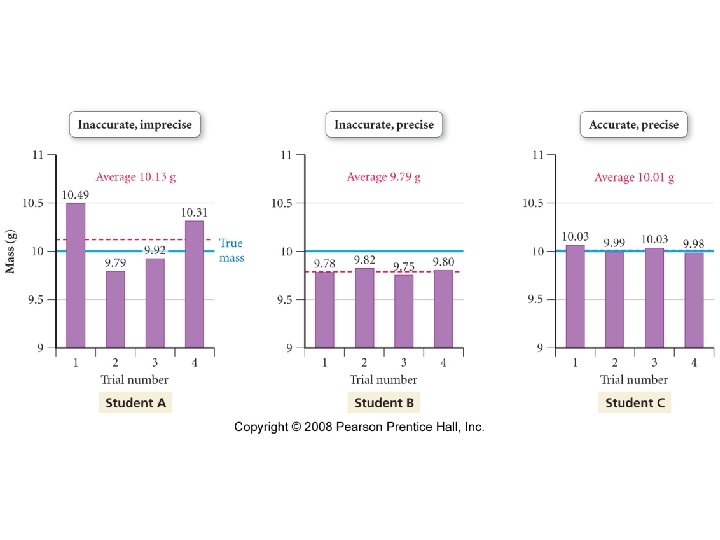
Precision and Accuracy • Accuracy -- Refers to how close to the true value a given measurement is. • Precision -- Refers to how well a number of independent measurements agree with one another.
Absolute Error The difference between the measured value and the true value is referred to as the absolute error. Assume that analysis of an iron ore by some method gave 11. 1% while the true value was 12. 1%, the absolute error is: 11. 1% - 12. 1% = -1. 0%
Relative Error The relative error is the percentage of the absolute error to the true value. For the argument above we can calculate the relative error as: Relative error = (absolute error/true value)x 100% = (-1. 0/12. 1)x 100% = -8. 3%
Error Analysis • Types of error – Random – Systematic – Gross
Error Analysis • Types of error – Random • Not mistakes but inherent in measuring process. • May be positive or negative. • Cause the data to be spread symmetrically around the true value • May be minimized by doing repeated trials of an experiment – Systematic – Gross
Error Analysis • Types of error – Random – Systematic • Caused by consistently making the same mistake for all measurements. • Tend to give precise though incorrect results. • May be minimized by using different techniques to gather data. – Gross
Error Analysis • Types of error – Random – Systematic – Gross • Results in a value which is far different than either the true value or the mean • Caused by sample inconsistencies or experimental error (ie reading measuring instrument wrong on one trial)
Definitions • Mean value – “the average” • Median value – Middle value • Spread or range – difference between highest and lowest measurement • Deviation – difference between mean and any specific measurement
Average Deviation Trial Mass 1 9. 6 2 9. 8 3 10. 3 4 10. 0 5 10. 8 6 9. 5 Mean 10. 0
Average Deviation Trial Mass Deviation 1 9. 6 -0. 4 2 9. 8 -0. 2 3 10. 3 +0. 3 4 10. 0 5 10. 8 +0. 8 6 9. 5 -0. 5 Mean 10. 0
Average Deviation Trial Mass Deviation /dev/ 1 9. 6 -0. 4 2 9. 8 -0. 2 3 10. 3 +0. 3 4 10. 0 5 10. 8 +0. 8 6 9. 5 -0. 5 Mean 10. 0 0. 4
Standard Deviation • σ represents the standard deviation • d represents the individual deviation • n is the number of trials.
Standard Deviation Trial Mass Deviation /dev/ (dev)2 1 9. 6 -0. 4 . 16 2 9. 8 -0. 2 . 04 3 10. 3 +0. 3 . 09 4 10. 0 . 00 5 10. 8 +0. 8 . 64 6 9. 5 -0. 5 . 25 Mean 10. 0 0. 4 Sum=1. 57
Standard Deviation
Standard Deviation σ = 0. 6 g So 68% of measurements lie between 9. 4 and 10. 6 grams 95% of measurements lie between 8. 8 and 11. 2 grams >99% of measurements lie between 8. 2 and 11. 8 grams
Significant Figures • Significant digits -- refers to the total number of digits in a measurement where one of the digits is uncertain and the others are certain. • According to standard deviation calculations, the last digit is uncertain—sig figs work pretty well in the absence of statistical work-up!
Rules for determining number of significant figures • All non-zero digits are significant. • All zeros between nonzero digits (or significant zeros) are significant. • Zeros used as placeholders are not significant. – all zeros to left of 1 st non-zero digit are not significant. (For example 0. 0068 -- two sig figs the zeros are placeholders. ) – for numbers greater than 1, zeros to the right of last digit are ambiguous if no zeros after decimal point. Assume not significant for this class. • Zeros after last digit are significant for numbers <1 or if they occur after decimal point for number >1. • Exact numbers have an infinite number of significant figures.
Calculations with Significant Figures • In addition and subtraction, the last digit retained in the sum or difference is determined by the position of the first doubtful digit. • For example 37. 24 1002. 46 • + 10. 3 + 6. 3 • ------------- • 47. 54 1008. 76 • Rounds to 47. 5 1008. 8
Calculations with Significant Figures • In multiplication and division, an answer has no more sig figs than the measurement with the least number of sig figs. • For example 3. 427 x 0. 00692 = 0. 02371484 = 0. 0237
Experiment • You will measure the mass of water delivered by a beaker and by a graduated cylinder multiple times and determine the mass of water delivered with each instrument and the standard deviation. You will then determine the density of regular and diet Coke using the most appropriate tools. • Results will be entered on the spreadsheet at www. grossmont. edu/cwillard.
Sample Data Table Temperature of water________ Density of water at measured temperature_____ Balance used ___________ Trial number 1 2 3 Sum Mean Mass beaker + 50 ml water (g) Mass drained beaker (g) Mass water (g) Volume water (m. L) (calculated from density) Deviation 2