STAGES OF POPULATION GROWTH Population Growth can be

STAGES OF POPULATION GROWTH
 OR Limited (S curve)")
Population Growth can be… • Exponential (J curve) OR Limited (S curve)
 Lag Phase 3) Stationary Phase 2) Log Phase 4)")
STAGES OF POPULATION GROWTH 1) Lag Phase 3) Stationary Phase 2) Log Phase 4) Decline/Death Phase
 LAG PHASE – Only a small number of organisms")
POPULATION GROWTH STAGES • 1) LAG PHASE – Only a small number of organisms are sexually mature and able to reproduce – The organisms may be adjusting to their environment
 LOG PHASE – Exponential or Logarithmic acceleration – Many")
POPULATION GROWTH STAGES • 2) LOG PHASE – Exponential or Logarithmic acceleration – Many organisms have reached sexual maturity – They are able to reproduce – The organisms have adjusted to the conditions around them (able to get food, shelter, water, etc for survival)
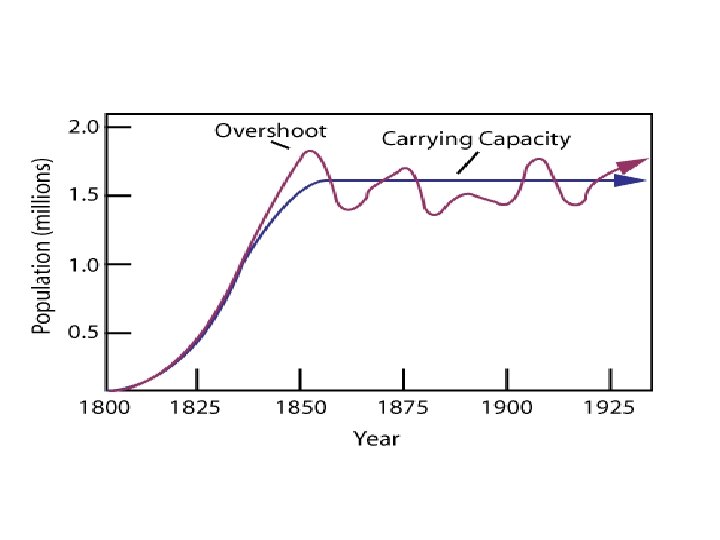
 STATIONARY PHASE – Growth ceases (slows down) and population remains")
POPULATION GROWTH STAGES 3) STATIONARY PHASE – Growth ceases (slows down) and population remains relatively fixed in size – The carrying capacity is reached – The number of births and deaths balance each other out – The immigration and emigration rate are roughly the same
 DECLINE/DEATH PHASE – Population dies off – May return")
POPULATION GROWTH STAGES • 4) DECLINE/DEATH PHASE – Population dies off – May return to lag phase and the cycle may repeat

PREDATOR PREY CURVES

PREDATOR PREY CURVES

PREDATOR/ PREY CURVES • Show the rise and fall of predator and prey populations • Developed by Italian mathematician Volterra from watching the rise and fall of Adriatic fishing fleets. • Shows peaks and valleys when population levels rise and fall in response to the predator-prey feeding relationship

PREDATOR/ PREY CURVES • theory suggest that… • when prey are numerous their predators increase in numbers • This reduces the prey population, which in turn causes predator number to decline. • The prey population eventually recovers, starting a new cycle.

HARE = prey, LYNX = predator

YOUR TURN… Using the values on this graph, write 5 sentences to explain what is happening…

Credits • Mrs K Casha
- Slides: 15