
Stage 2 Project Group 2 Team members Stella

Stage 2 Project Group 2 Team members Stella Ngatia Harold Smith Komivi Atchrimi Fred Tulay Vincent Belcastro
Risk Analysis for Capital Budgeting �Risk analysis is the process of defining and analyzing the dangers to individuals, businesses and government agencies posed by potential natural and human-caused adverse events. �In IT and other fields, a risk analysis report can be used to align technology-related objectives with a company's business objectives. �A risk analysis report can be either quantitative or qualitative.
Sensitivity Analysis �Sensitivity analysis breaks the NPV calculation into its components assumptions and show the NPV varies as underlying assumptions change. �As observed in our project excel spreadsheet, various scenarios are depicted of how the NPV is used to determine the cost of capital, growth and terminal values of capital. �By conducting a sensitivity analysis, we learn how these assumptions can be applied to specific project as depicted by the results shown on the next slides….
Sensitivity Analysis Cont’d �Sensitivity analysis is simply the method for determining how sensitive our NPV analysis is to changes in our variable assumptions. To begin a sensitivity analysis, we must first come up with a base-case scenario. �This is typically the NPV using assumptions we believe are most accurate. From there, we can change various assumptions we had initially made based on other potential assumptions. �NPV is then recalculated, and the sensitivity of the NPV based on the change in assumptions is determined. Depending on our confidence in our assumptions, we can determine how potentially risky a project can be.
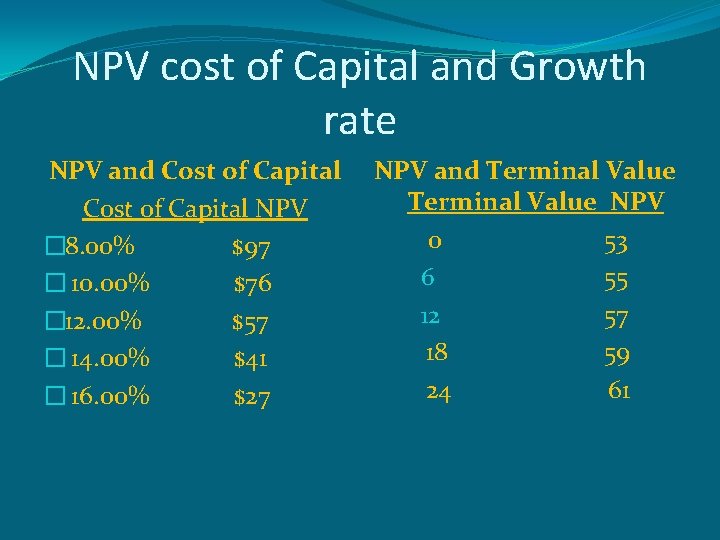
NPV cost of Capital and Growth rate NPV and Cost of Capital NPV � 8. 00% $97 � 10. 00% $76 � 12. 00% $57 � 14. 00% $41 � 16. 00% $27 NPV and Terminal Value NPV 0 53 6 55 12 57 18 59 24 61

Recognizing the scenarios �As depicted in the above slides, applying various assumptions let’s us know the various rates at which capital can be obtained taking into consideration these assumptions indicated. �In finance, the net present value (NPV) or net present worth (NPW) of a time series of cash flows, both incoming and outgoing, is defined as the sum of the present values (PVs) of the individual cash flows of the same entity.
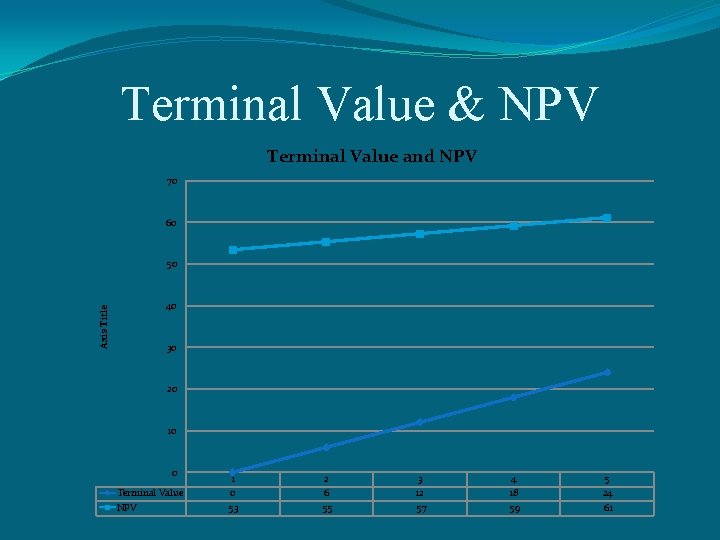
Terminal Value & NPV Terminal Value and NPV 70 60 Axis Title 50 40 30 20 10 0 Terminal Value NPV 1 0 53 2 6 55 3 12 57 4 18 59 5 24 61

NPV and Terminal Value � Investment is a central concept in the world of business. Few businesses can generate large returns without investing. This is why the term ‘investment’ is intrinsically linked with the term ‘return’ — the soundness of an investment depends on its return. � To evaluate the economics of an investment, first list the alternatives and their relevant cash flows over the life of the asset (usually several years). � Cash outflows include the costs of the new asset and of its operation. Cash inflows include operational savings and incremental cash flows from the opportunities that the asset makes available to the company. � An important part of predicting cash flows is their timing because money today is worth more than the same amount of money in the future. This concept is called ‘the time value of money.
Terminal value of NPV � The terminal value of a project like indicated in our spread sheet shows at what point in the life of the project that cash flows will reduce or ceased to generate revenue. � This doesn’t apply to an investment or firm with an indefinite life such as an expansion of the firm. � In this case, we estimate the value of the remaining free cash flow beyond the forecast horizon by including an additional, one-time cash flow at the end of the forecast horizon called the terminal value or continuation value of the project. Determining the cash flow of a project required a scenario analysis. � Scenario Analysis evaluates the expected value of a proposed investment or business activity. The statistical mean is the highest probability event expected in a certain situation. By creating various scenarios that may occur and combining them with the probability that they will occur, an analyst can better determine the value of an investment or business venture, and the probability that the expected value calculated will actually occur. (Berk & De. Marzo, 2014, p. 250 )
Scenario Analysis �Scenario analysis is designed to see the consequences of an action under different sets of factors. For example, it shows how an investment's NPV would differ under high and low inflation. �Scenarios should be practicable enough to provide an accurate depiction of the outcomes. A "good" scenario for an investor should not include winning the lottery because, though good, it is neither probable nor realistic for analyzing possible results. �Many scenario analyses use 3 scenarios: base case, worst case, and best case. However, the number and conditions of the scenarios in each analysis can vary. (Berk & De. Marzo, 2014, p. 257)
Conclusion �Sensitivity Analysis help in determining if a particular project is worth undertaking considering the various time scenarios that may arise during the course of the project �Scenario Analysis is a process that help determine events as they occur during the life of the project and the possible out. In reality, certain factors may affect more than one parameter, NPV of cash flow, etc.
- Slides: 11