
SSC 2030 Energy Systems Sustainability 2 Global climate
SSC 2030: Energy Systems & Sustainability 2. Global climate change 2. 1: The elephant in the room: What is GCC? 2. 2: What is the evidence of GCC? 2. 3: What are the cause(s) of GCC? 2. 4: Paradigms, change, revolutions and transitions 2. 5: Decarbonization and the energy trilemma
2. Global climate change 2. 2: What is the evidence of GCC?
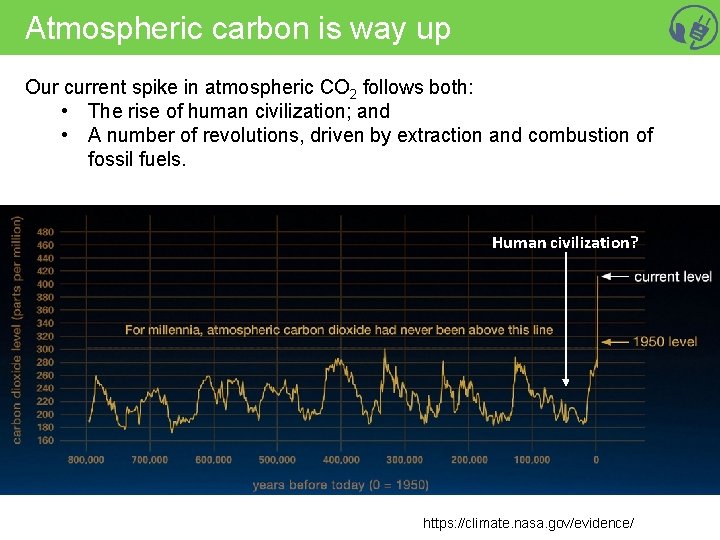
Atmospheric carbon is way up Our current spike in atmospheric CO 2 follows both: • The rise of human civilization; and • A number of revolutions, driven by extraction and combustion of fossil fuels. Human civilization? https: //climate. nasa. gov/evidence/
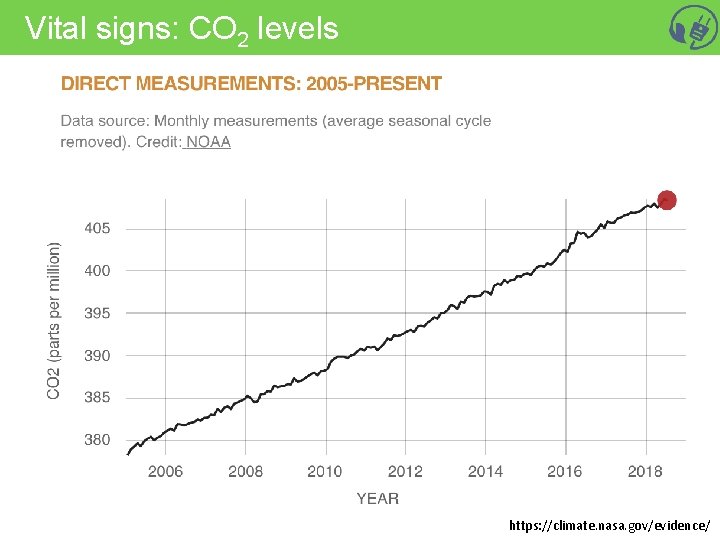
Vital signs: CO 2 levels https: //climate. nasa. gov/evidence/
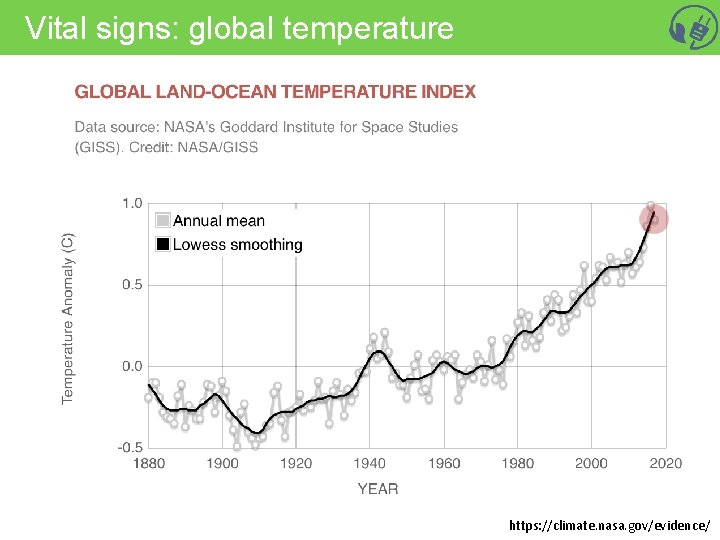
Vital signs: global temperature https: //climate. nasa. gov/evidence/
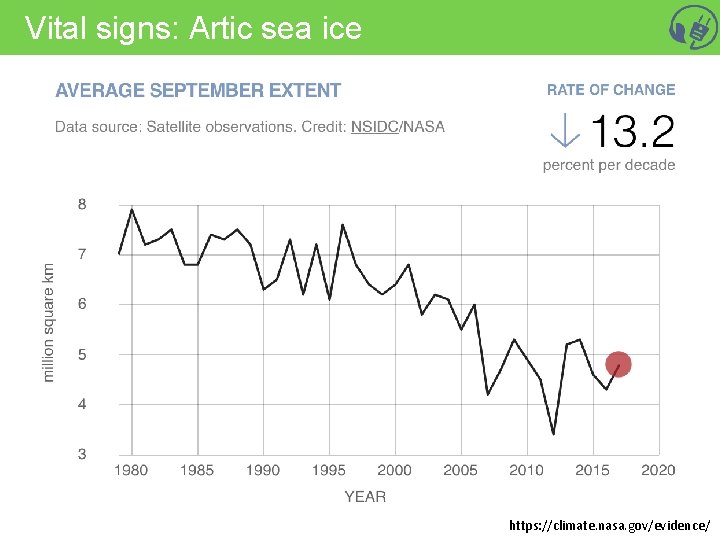
Vital signs: Artic sea ice https: //climate. nasa. gov/evidence/
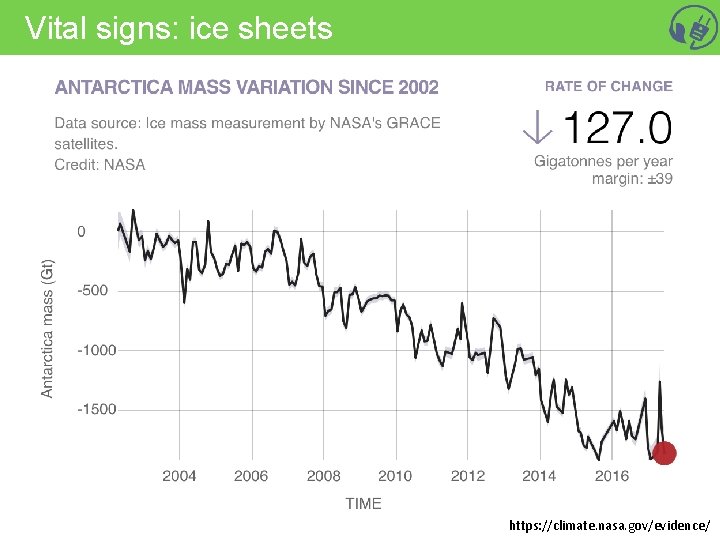
Vital signs: ice sheets https: //climate. nasa. gov/evidence/
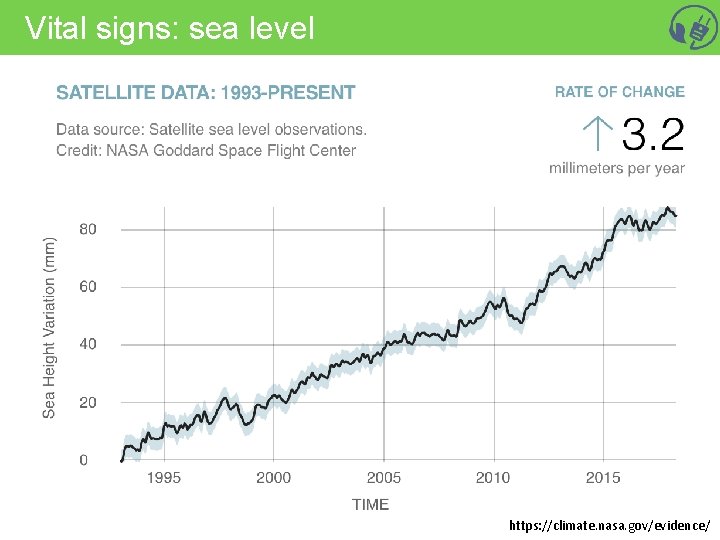
Vital signs: sea level https: //climate. nasa. gov/evidence/
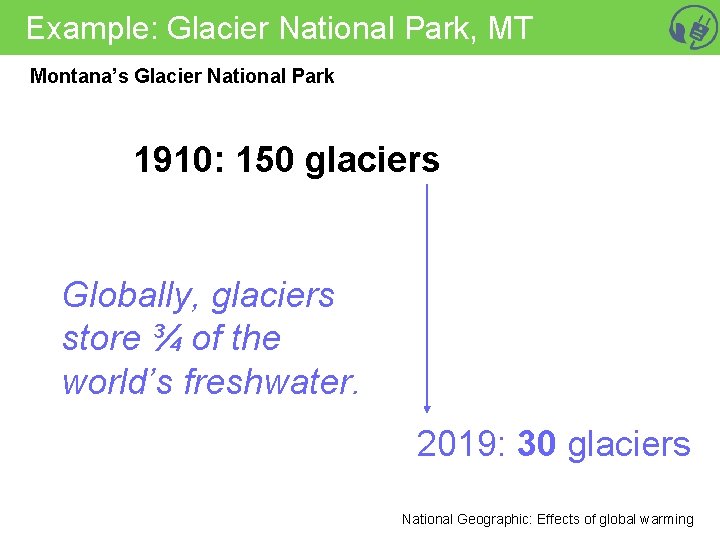
Example: Glacier National Park, MT Montana’s Glacier National Park 1910: 150 glaciers Globally, glaciers store ¾ of the world’s freshwater. 2019: 30 glaciers National Geographic: Effects of global warming
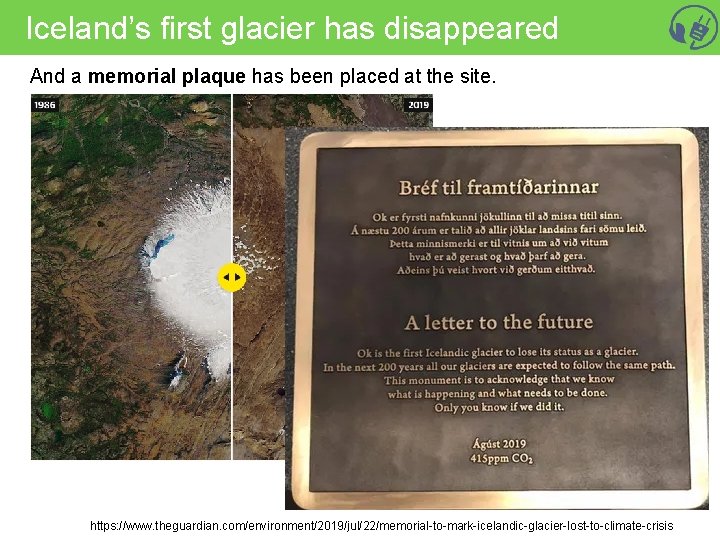
Iceland’s first glacier has disappeared And a memorial plaque has been placed at the site. https: //www. theguardian. com/environment/2019/jul/22/memorial-to-mark-icelandic-glacier-lost-to-climate-crisis
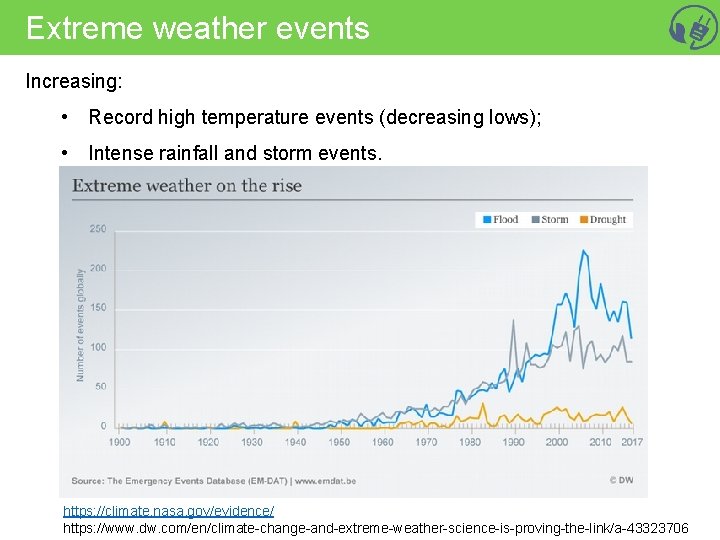
Extreme weather events Increasing: • Record high temperature events (decreasing lows); • Intense rainfall and storm events. 2012 Arctic Sea ice minimum – lowest on record https: //climate. nasa. gov/evidence/ https: //www. dw. com/en/climate-change-and-extreme-weather-science-is-proving-the-link/a-43323706
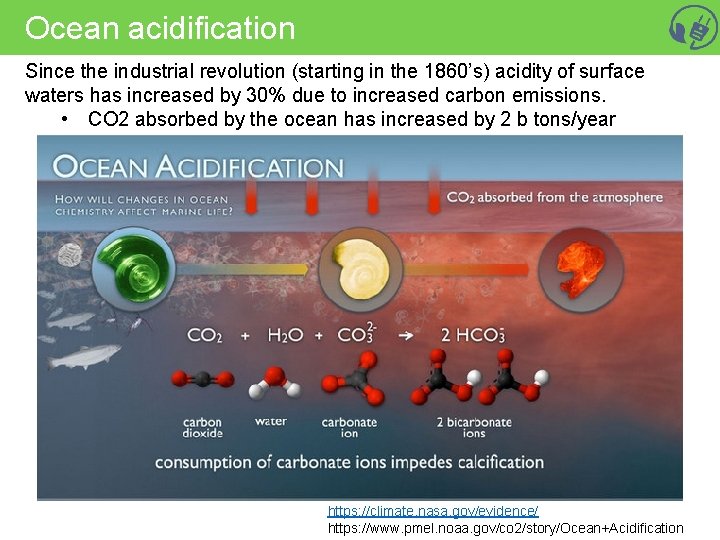
Ocean acidification Since the industrial revolution (starting in the 1860’s) acidity of surface waters has increased by 30% due to increased carbon emissions. • CO 2 absorbed by the ocean has increased by 2 b tons/year https: //climate. nasa. gov/evidence/ https: //www. pmel. noaa. gov/co 2/story/Ocean+Acidification
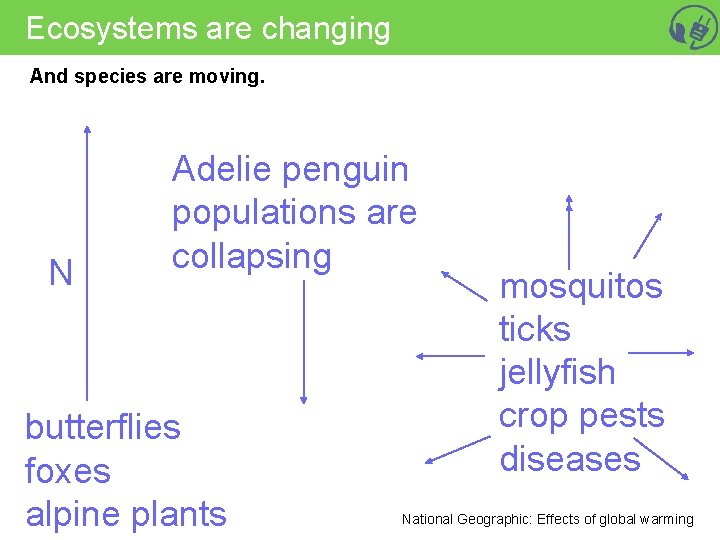
Ecosystems are changing And species are moving. N Adelie penguin populations are collapsing butterflies foxes alpine plants mosquitos ticks jellyfish crop pests diseases National Geographic: Effects of global warming
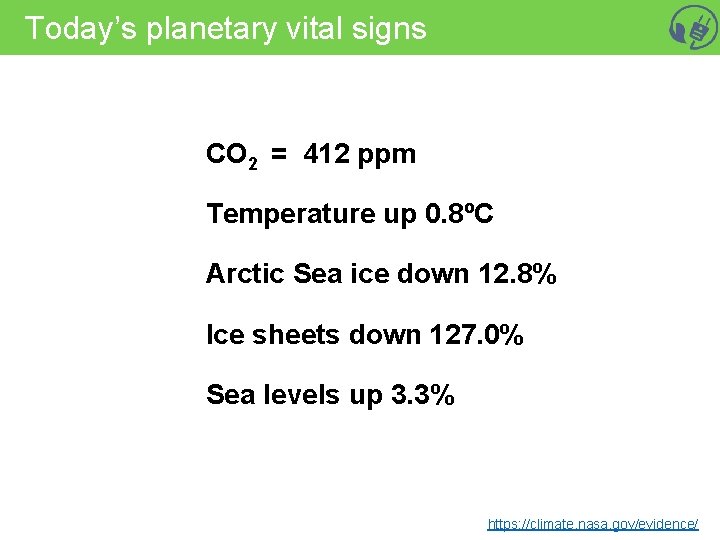
Today’s planetary vital signs CO 2 = 412 ppm Temperature up 0. 8ºC Arctic Sea ice down 12. 8% Ice sheets down 127. 0% Sea levels up 3. 3% https: //climate. nasa. gov/evidence/
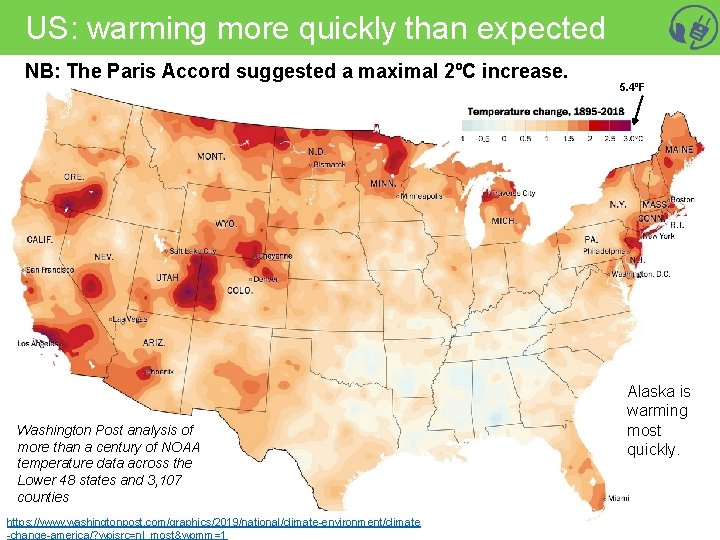
US: warming more quickly than expected NB: The Paris Accord suggested a maximal 2ºC increase. Washington Post analysis of more than a century of NOAA temperature data across the Lower 48 states and 3, 107 counties https: //www. washingtonpost. com/graphics/2019/national/climate-environment/climate -change-america/? wpisrc=nl_most&wpmm=1 5. 4ºF Alaska is warming most quickly.
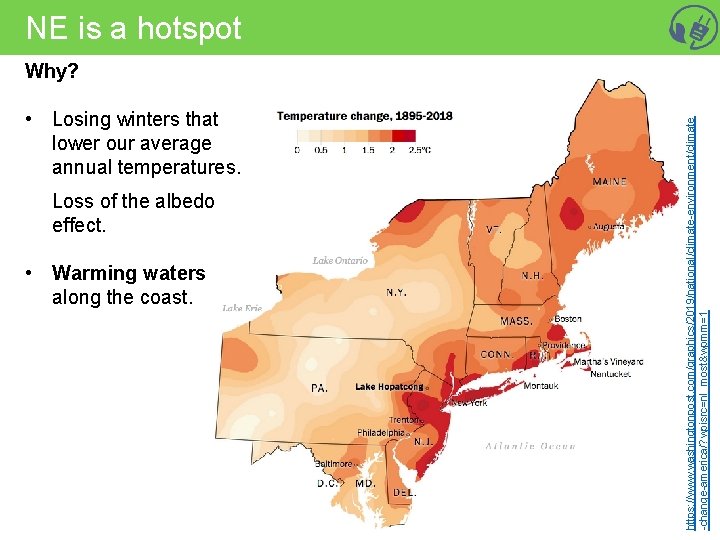
NE is a hotspot • Losing winters that lower our average annual temperatures. Loss of the albedo effect. • Warming waters along the coast. https: //www. washingtonpost. com/graphics/2019/national/climate-environment/climate -change-america/? wpisrc=nl_most&wpmm=1 Why?
Predictions of future change in the US? • Change will continue through 2100…. And on. • Temperatures will continue to rise. • Growing seasons will lengthen. • Northern US: more winter and spring precipitation Southwest US: less precipitation • Droughts in the Southwest • Heatwaves will increase across the country. • Hurricanes will become stronger and more intense. • Sea level will rise 1 - 4 feet by 2100. • Arctic Sea will become ice-free in summer by ~2050. https: //climate. nasa. gov/evidence/
Regional predictions Northeast: heat waves heavy downpours sea-level rise Northwest: reduced supplies of freshwater sea-level rise erosion and inundation effects from increasing ocean acidity increasing wildfire, insect damage to forests Southeast: sea-level rise extreme heat decreased availability of freshwater Midwest: extreme heat heavy downpours and flooding many changes and risks to Great Lakes Southwest: increased and extreme heat drought wildfires and insect outbreaks ecosystems agriculture fisheries water supplies health Infrastructure economy https: //climate. nasa. gov/evidence/
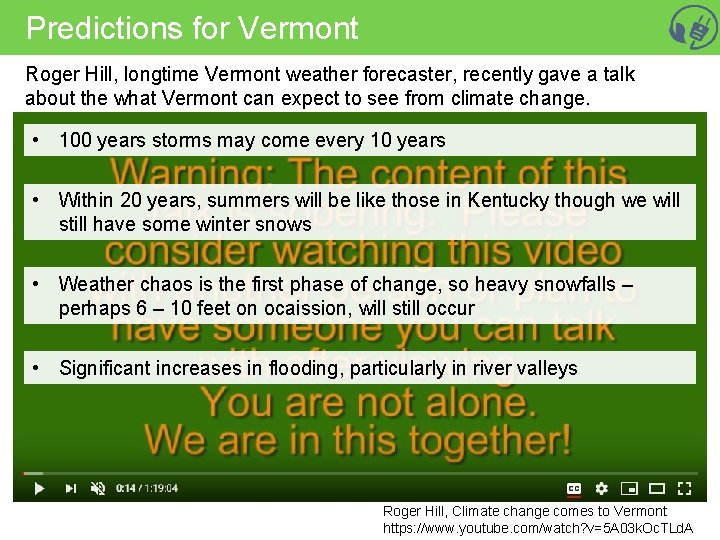
Predictions for Vermont Roger Hill, longtime Vermont weather forecaster, recently gave a talk about the what Vermont can expect to see from climate change. • 100 years storms may come every 10 years • Within 20 years, summers will be like those in Kentucky though we will still have some winter snows • Weather chaos is the first phase of change, so heavy snowfalls – perhaps 6 – 10 feet on ocaission, will still occur • Significant increases in flooding, particularly in river valleys Roger Hill, Climate change comes to Vermont https: //www. youtube. com/watch? v=5 A 03 k. Oc. TLd. A
- Slides: 19