SSAS 2012 Tabular Mode Best Practices Itay Braun

SSAS 2012 Tabular Mode Best Practices Itay Braun CTO & BI Architect, Twingo Manager of the Microsoft BI User Group in Israel itay@twingo. co. il

Target • Understanding what is exactly SSAS 2012 Tabular Mode and when to use it • Understanding the “small letters “ Exact Limitations

Power. View • Great Visualization functionality • Simple and intuitive • • • BTW, Part of Share. Point 2010 Enterprise Edition Can only query SSAS 2012 Tabular Model

Power. View • Great Visualization functionality • Simple and intuitive BTW, – Part Share. Point 2010 Enterprise Edition – Can only query SSAS 2012 Tabular Model

Agenda • General BI Solution Architecture • What is SSAS 2012 Tabular Mode – – – BISM and other Main Features Direct Query DAX vs. MDX Processing Security Clients • Po. C – Lessons Learned

BI Solution Architecture

BI Solution Requirements • Business Requirements: • • • single version of the truth unified data KPI and CPM Dashboards Reports… • Technology is just an Enabler • Main Technological Requirements: – – – Easy to change and maintain Security Good performances Self Service BI Good visualization layer

Using a New Technology • What does it do? • When should I use it? – And when shouldn’t I use it? • What’s it place in the technological road map? – Two examples • Similar Technologies – Who are the biggest competitors? – Which old technology replaced by the new one?

SSAS 2012 Tabular Mode • Customers ask: – Does it replace good old MOLAP or is it just a better Power. Pivot? – From now on, should I develop in Tabular Mode only? – We understand that in-memory column database is faster. How fast is Tabular compared to MOLAP? – We understand that development at Tabular Mode is simpler. We are SSAS 2008 R 2 experts and know nothing about DAX and Tabular. Would you still say Tabular is simpler option for us?

Is SSAS 2012 Tabular Mode Enterprise Ready?

WHAT IS SSAS 2012 TABULAR MODE?

What is SSAS 2012 Tabular Mode • New DB Engine • Tabular Mode – – Column Store In-Memory Compression (about 1: 3; sometimes much better) All data copied (processed) to the Tabular model • Direct SQL – Queries translated to SQL, running directly against the relational SQL Server. – Tabular Mode’s version of ROLAP
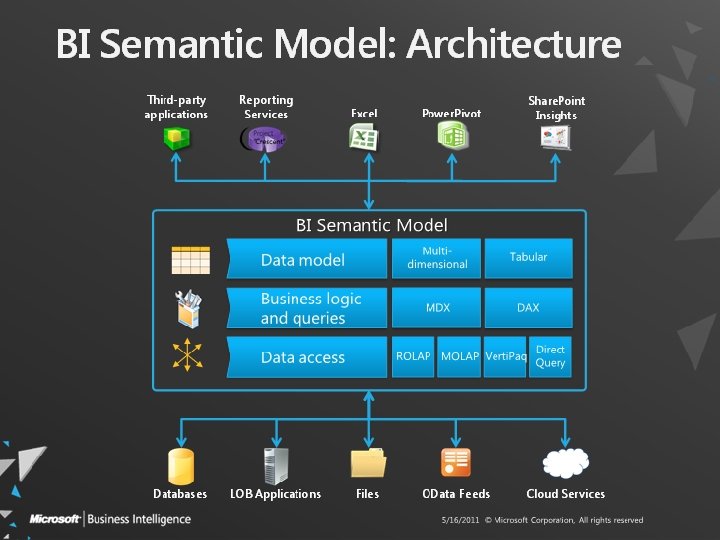

BISM – BI Semantic Model • BISM is a concept, not a technical term • Users can easily query the intuitive data model – No need to understand complex data source structure • The BISM provides: – Data Model – Business Logic and Queries – Data Access • The implementation of the BISM are these three technologies: • MOLAP • SSAS Tabular Mode • Power. Pivot
")
Tabular vs. Multi Dimensional • Tabular – – Quicker development From detailed (granular, images) data to aggregate data Good performances Some features are missing • Multi-Dimensional – Rich Multi-dimensional functionality – Known and well documented engine – Suitable for very large cubes, beyond server’s memory size
")
Schema (SQL Server Data Tools)

Management Studio

Tabular Mode - Main Features • Understanding the main features of a technology is the key to understand when and how to use it – Feature by Server Mode or Solution Type

Developing a Model • Use the Visual Studio SQL Server Data Tools to build a BISM • Open an existing Power. Pivot Model using SSDT or Management Studio • Deployment – Immediate changes implementation at the SDDT – Use small DB for development

Workspace Database • Created during model authoring using SSDT. • Disappeared automatically when closing the project • The workspace database resides in-memory. Workspace DB

Data Sources • The model can use multiple data sources

Tabular Mode Schema vs. Data Source Views • Much simpler than a Data Source View • Building the Adventure. Works DB using Tabular Mode is about x 4 times faster.

Tabular Mode Schema • Dimension = One Table • No Dimension Wizard to create Hierarchies

Tabular Mode Schema • Measures and KPI are defined here. No cube Wizard.

Tabular Mode Schema • Edit Table Properties

Tabular Mode Schema- Adding a column • Adding new calculated columns in the schema is possible. • Either add calculated columns to the source DB or to the BISM

Adding a new columns • Add new columns using DAX – At the OLAP Data Source View you write an expression in the source language, TSQL, PLSQL…

Schema - Limitations • Self Joins are not supported • Two tables can have only one active relationships – No role playing dimension • Many to Many relationships allowed using DAX

Dimensions • Active / non active relationships – Only ONE relationship can be active – No Role Playing Dimensions – The Date Dimension can be connected by either Order. Date or Ship. Date or Due. Date You’ll have to build many date dimensions

Dimensions • Multiple Hierarchies

Snowflake Dimensions • A dimension is based on one table / view only. – A hierarchy can be based on one Table. – Create a view on the data source which joins the tables. • . Category name from Dim Category with a measure works as expected

Dimensions - Limitations • • • No member properties No Parent-Child No linked dimensions No need for Attribute Relationships The dimension is a table – A dimension can be based on one and only one table – Dimension names taken directly from the • Large dimensions (million members ) performed better

Measures • Sum, min, max, count, distinct count…or complex DAX Expressions • A table can contain both attributes and measures.

Multi Grain Measure Groups • Support many “Measure Groups” with different dimensionality • For ex. Internet Sales (product level), Sales Quota (Category Level)

KPI • Key performance Indicators are the heart of any BI solution • Replaces existing Measures

KPI • Easy to create using a wizard • Value – existing measure • Target – measure or a number • Status – using a GUI

Perspectives • Same as in SSAS Multidimensional • Allows users to see a Database in a simpler way • Can hide: – – – Tables (dimensions) Columns (Attributes) Hierarchies Measures KPI

Partitions • Same logic as in SSAS Multidimensional. • Easy to create • Can be processed alone (like in Multidimensional)
")
What’s missing? • • • Translations Sync Two Databases Actions Custom Assemblies (SSAS Procedures) Self Join (Parent Child) Role Playing Dimensions

More Limitations • Named Set • Scopes • Write Back

Direct Query

Direct. Query Mode • Direct. Query mode uses data that is stored in a SQL Server database. • Used for Real Time analysis • No processing – Changes to the underlying source data reflected immediately. – no extra management overhead of having to maintain a separate copy of the data.

Direct Query • Performances – No clear answer, depends on the source DB – Still checking the efficiency of the generated SQL Queries. • Security - Any security enforced by the back-end database is guaranteed to be enforced, using row-level security • Unlike Multi Dimensional, you Can’t mix Direct Query and Tabular Partitions

Direct Query Limitations • Can only use one SQL Server DB as a source • The entire model is either using Direct. Query or not. • Limited use of DAX functions • Client restrictions: Can only be queried by using DAX – Excel can’t be used because it uses MDX

DAX vs. MDX
 vs. DAX • MDX (Tabular) vs.")
DAX vs. MDX • MDX (Multi Dimensional Cube) vs. DAX • MDX (Tabular) vs. DAX (Tabular)

Querying a Tabular Model using MDX • Quick start – just use MDX to query the model – You don’t have to learn DAX – In general speaking, MDW performs well – Fine tuning DAX queries

What is DAX • Set of Excel-like formulas • Enables advanced data modeling inside the Power. Pivot for Excel or Tabular Mode • Two types of calculations – calculated columns – measures

Learn DAX • Quick. Start: Learn DAX Basics in 30 Minutes • http: //www. sqlbi. com/ • Chris Webb’s blog. 6 lessons about DAX start here • Converting MDX to DAX – First Steps

DAX vs. MDX • DAX and MDX coexists peacefully • Tabular Mode can be queried using both DAX and MDX • Use MDX for data analysis (group by, hierarchies) • Use DAX for detailed reports – MDX uses Crossjoin to join many columns. - Excel uses MDX, Power. View uses DAX, SSRS can use both

DAX vs. MDX • More Limitations – MDX can only query In-Memory Models – DAX can query both In-Memory and Direct Query Models. – DAX cannot be used to query Multi Dimensional Cubes • Microsoft are working on it
 vs. (MOLAP + MDX) • The fact that Verti. Paq is")
(Tabular + DAX) vs. (MOLAP + MDX) • The fact that Verti. Paq is an in-memory database doesn't mean that it will perform much better than a multidimensional cube. • Warm Cache MOLAP Cube query will probably perform better or just as good as DAX. – Query results caching
 vs. (MOLAP + MDX) • DAX on Tabular mode usually give")
(Tabular + DAX) vs. (MOLAP + MDX) • DAX on Tabular mode usually give you good performance without special tuning. • DAX queries are never cached – Second (warm) run is just as fast the first (cold) one. • Distinct Count queries usually performed better using DAX + Tabular – Overall good performance of DC even with MDX
 query is better then")
When number of days increased – the runtime of MDX(CUBE) query is better then DAX (Tabular)
 and make aggregations")
Complex query that run on list of members (Products and Dates) and make aggregations – will return faster in MDX (Cube) (and much faster from the warm cache) than in DAX. MDX Query Same Query in DAX

DAX in XMLA • Easy to manage parameters • DAX Editor sample

Processing
 One")
Processing Highlights • • Tables can be partitioned Process FULL Process ADD (incremental) One table (dimension) can be processed without processing the related measures

Processing

Processing Error It says “processed” but the error message and a closer look on the partitions shows the table has never been processed

Processing • Process the dimensions • Process the measures • Unlike MOLAP, It is possible to query tables (dimensions and measures ) while other tables haven’t been processed yet. Processing the dimensions but not the measure tables

Partitions

Partitions • Every table can be partitioned. • Since Dimension = Table, a dimension can be partitioned too. – Not sure this is a good idea.

Partitions • It is possible to process only some of the partitions

Process Full • Processes a partition or table and all the objects that it contains. • Drops all data, and then processes the object. – Any affected calculated columns, relationships, user hierarchies, or internal engine structures (except table dictionaries) are recalculated. • This kind of processing is required when a structural change has been made to an object.

Processing Options • Process Clear - Drops all the data in a database, table, or partition. • Process Data - Loads data into a partition or table. • Process Defrag - Optimizes the table dictionary (an internal engine structure) – For ex. After deleting old partition, the dictionary still contains references to these deleted rows. – The best practice is to run it frequently, based on your sliding window design

Processing Options • Process Recalc - recalculates calculated columns, rebuilds relationships, rebuilds user hierarchies and rebuilds other internal engine structures. – Must be issued after Process Clear or Process Data.

Handling Unknown Values • A dimension key in the Fact table might be missing in the dimension table. – For ex. A sale of 2024. 99$ for a non-existing product • It is not possible to configure the processing behaviour. • All unknown rows merged into one “unknown’ member

Using Views in the Tabular Model • Use views to filter small amount of data at the development phase, later change the view definition to return all data. • Using views let you do changes in the underlying DB without affecting the Tabular Model Schema.

Process. Add • The simplest solution – add a new partition + Full processing • It is possible to run process add to load new data. • It is under the responsibility of the DBA to avoid duplication. • You can change the query binding using the UI. – Use views as much simpler query binding.

Parallel Processing • It is possible to process many tables on parallel. • However, only one partition of a table at a time.

Security

Security • Two main permissions: – Database Permissions – Allowed Row Sets • Create roles using SSDT. • Use DAX to restrict access – =Region[Country]=”USA” • Dynamic security is also possible – http: //msdn. microsoft. com/enus/library/hh 213165(v=sql. 110). aspx

Security • Create a role

Add the role name to the connection string Always uses Visual Total View filtered data

Po. C – Lessons Learned

Po. C – Lessons Learned • Forget what you know about SSAS 2008, new design is needed – No Migration Wizard – Consider de-normalization. • Server Configuration – Server Properties (SSAS - Tabular) – Memory paging allows models to be larger than the physical memory of the server

Clients

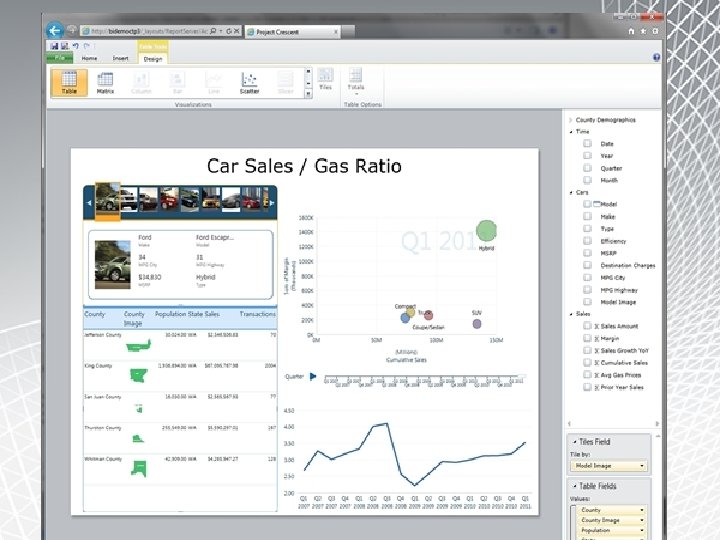
Power. View • A feature of SQL Server 2012 Reporting Services Add-in – Requires Microsoft Share. Point Server 2010 Enterprise Edition • Interactive data exploration and visualization • Intuitive ad-hoc reporting for business users • A browser-based Silverlight application

Clients - Power. View • For only SSAS 2012 Tabular Mode or Power. Pivot. – SSAS 2012 Multi-dimensional as data source is planned for the near future. • Watch demo here • More info at MSDN

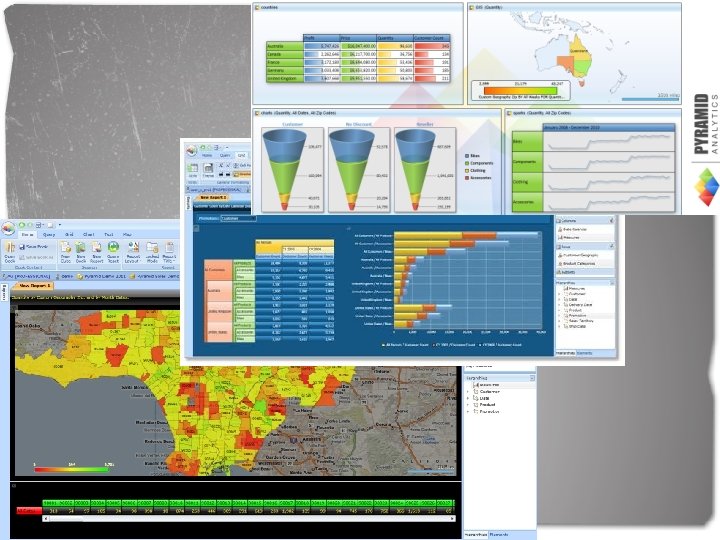
Clients – Pyramid Analytics • The Pyramid Analytics Suite is a highly scalable, enterprise data analytics application that brings sophistication with simplicity in a synergistic web -based interface for consuming Microsoft Analysis Services OLAP cubes. • Bio. Point Dashboards • Bio. XL - A complete browser-based cube viewing solution

Clients – Excel 2010

Clients - Custom • Build your own app using AMO

Monitoring • Good monitoring is essential for Enterprise Ready solutions. – – Profiler Dynamic Management Views Performance Monitor No query log, though

Licensing • Tabular Mode not in Standard Edition

Conclusion • Multi Dimensional OLAP: – Familiar, Huge Install base, wide knowledgebase, stable, large scale implementations, monitoring tools, many OLAP Viewers • Tabular Mode – New Technology – Simple, easier development, sometimes faster – Microsoft now focusing on this technology

Links • My Blog: http: //blogs. microsoft. co. il/blogs/itaybraun • Cathy dumas’ blog: http: //cathydumas. com/ • DAX Editor - http: //daxeditor. codeplex. com/ • Paul Te Braak’s blog • Adventure. Works tutorial for tabular models • DAX quick start guide

Thanks
- Slides: 90