SSADM Structured Systems Analysis and Design Method Hazrlayan


 Data flows External entities")


- Slides: 31
SSADM – Structured Systems Analysis and Design Method Hazırlayan Yard. Doç. Dr. Zehra KAMIŞLI ÖZTÜRK
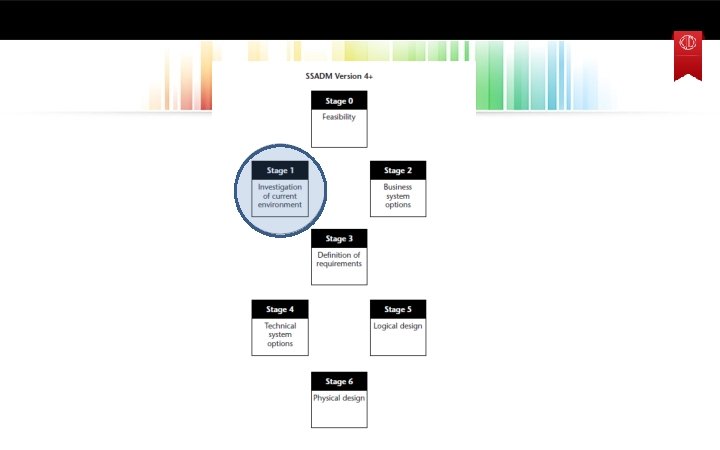
Investigation of the current environment Investigate and define requirements
Analysts are looking for the answer of these questions • Is the current system reliable? • Is there an integrity of the current system? Does it provide valid information? • can the system easily be divided? • The system has no backup process • Does the system Works regularly in the most intense moments? • Does it meet current and future needs?
Fact finding techniques • Interviews / surveys Analyst should be well prepared • a time on a given day • Start from the top levels of management! • receive audio recording instead of writing! Do not miss important points • current form and files in the current system can provide information!
Investigate current processing • This Step also involves fact-finding, but focuses on producing models or diagrams of the processing in the current system. The key technique here is Data Flow Modelling.
Data Flow Diagrams At this stage of SSADM, the diagrams include: 1. context diagrams 2. Document flow diagrams 3. Data Flow Diagrams (DFDs)
Data Flow Diagrams • what data is involved, and where the data goes to. – the processes involved in the current (and required) system • How the data is created, updated, stored? • Processes –activities • The things you did at weekend? – Going to cinema, at which oclock? . . .
four elements to a DFD • • Processes (or activities) Data flows External entities Data stores
Processes at DFD • The processes show an activity carried out by someone in the organization which involves data in some way.
Data flows • Data flows show the movement of data around the system. • They take the form of an arrow which shows the direction of the data
External Entities • These are people or organizations outside of the system being investigated. • They will send data into the system or receive data from it.
Data Stores • These are places where data is stored. For example, an Orders file would be a data store. • Jack Trout’s members’ shoebox at Swillbuckets is a data store M: manuel
Example: Partial DFD
Data flow diagram rules • Processes Have to have the input and output • Data flows should be exit in the process box • There can not be a flow into the data store from an external entity • label of external entitites must be a name • Flow to data store: Update • flow from the data store: receiving data from the data store
Context diagram • This is the first diagram we draw. • In order to prevent it looking too complicated, we might summarize the key data flows. • All the processes in the system are contained in one process box. • The aim is to get an overview of which external entities send or receive data from our system at present. • A context diagram is a tool to establish the scope of the system under investigation. • It is similar to a DFD, but does not obey the rules outlined above.
Document flow diagram • This follows on from the context diagram. • It looks inside the one process box in the context diagram and breaks it up into departments or areas of work. • It also allows us to show exactly which parts of the overall system we are going to investigate. • Some parts might not need looking at.
Simple steps in data flow modelling • The main tasks to be completed, in order, are: 1 Draw a context diagram. 2 Draw a document flow diagram. 3 Draw a top-level data flow diagram. 4 Draw lower level data flow diagrams.
Data Flows and Entities 1. Determination of the external entitites
2. Draw the context diagram A dashed line can be used to show data flows between external entities
3. Identify internal areas/departments • In a college – Department, Student, Tutor, – Admin, Support • In the Medical Centre – Reception, Doctor and Nurse We also need to identify the data flows between these areas We need to identify the internal areas which might send data between themselves
4. Draw the document flow diagram Document System boundary Electronic Word of mouth Written
5. Convert the document flow diagram into a toplevel data flow diagram 1. Start with the document flow diagram. 2. Focus on the sources/recipients (ellipses) inside the boundary (ex: Doctor, Nurse and Reception). 3. Look at the data flows coming into and going out of these ellipses. 4. What processes generate these data flows? What are the main processes carried out by Doctor, Nurse and Reception?
5. Convert the document flow diagram into a toplevel data flow diagram Let’s take Reception – we might start with the data flow ‘appointment’. What process generates this ‘appointment’? Remember that we’re trying to be general at the moment, so we could identify a process called ‘Process Appointment’. This would cover a number of our data flows. Another data flow is ‘registration form’. What process generates ‘registration form’? Being general again, we might call it ‘Register Patient’. Other data flows are ‘prescription’ and ‘referral’. What processes generate these? They could be brought together under the process ‘Process Patient Requirements’.
Level 1 DFD 5. Convert the document flow diagram into a toplevel data flow diagram • Put these general processes together in one diagram and we have our DFD. • For the sake of simplicity, data stores can be left out of this top-level diagram. They will appear in the lower level diagrams. Who? When? What? How?
6 Develop the lower level DFDs using functional decomposition • Level 1 DFD gives us a very general overview of what goes on in the Medical Centre, but provides no details about what really happens. • Thus each Level 1 process might be broken down into a number of Level 2 processes. • When drawing the lower level DFDs, we must now incorporate the data stores.
Level 2 DFDs for the Medical Centre Level 2 DFD ‘Register Patient’
Level 2 DFD - ‘Process Appointment’.
Level 2 DFD – ‘Process Patient Requirements’.
limitations with DFDs • They don’t show us how the data is structured. • They don’t show the effect of time or sequence. • They may not help communicate with the user – they may be too complex. • They take a long time to draw and redraw. • They may never be complete.