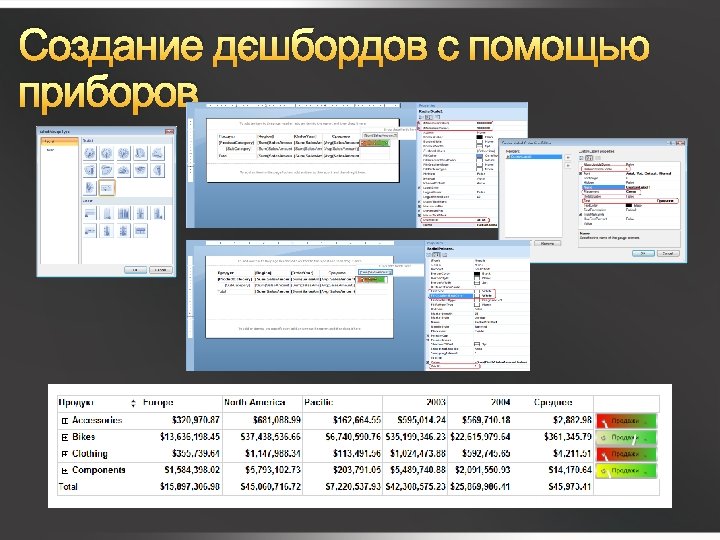
SQL Server BI Share Point Server Excel Dashboards

SQL Server: комплексное предложение в области BI Доставка Share. Point® Server Отчеты Excel Dashboards Workbooks Analytic Views Scorecards Планир ование Средства конечного пользователя Excel ® Performance. Point Services™ Microsoft SQL Server Reporting Services SQL Server Analysis Services SQL Server DBMS SQL Server Integration Services Oracle SAP Siebel . . .

Microsoft SQL Server Reporting Services Вышли между SQL Server 2000 и 2005 27 января был 5 -летний юбилей http: //www. microsoft. com/presspass /press/2003/dec 03/1217 sqlbihonorspr. mspx http: //www. microsoft. com/presspass /features/2004/jan 04/0127 sqlreporting. mspx В настоящий момент входят в состав большинства редакций SQL Server 2008, включая Express with Advanced Services http: //www. microsoft. com/downloads/details. aspx? Family. Id=B 5 D 1 B 8 C 3 -FDA 5 -4508 -B 0 D 0 -1311 D 670 E 336&displaylang=en Т. е. раздаются нахаляву

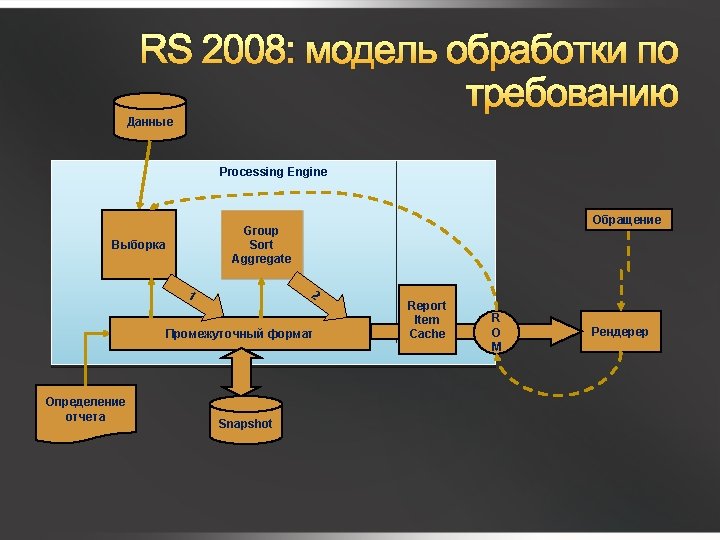
Архитектура Reporting Services Report Viewer Share. Point SSMS Report Viewer Web Part Web Service Proxy Источники данных Web Services & URL Access Службы безопасности Report Server Report Engine Выходные форматы Data Processing Security Адресаты доставки (E-mail, Share. Point, Custom) Rendering Пользовательская визуализация Custom Report Item Scheduling & Delivery RDCE Customized RDL SQL Server Catalog

Масштабируемость Failover Cluster 2 N Reporting Data 1 Report Catalog SSRS Scale Out Deployment Report Server

Компоненты SSRS 2005 Report Builder Report Manager Management Studio Report Designer Share. Point V 3 Configuration Tool 3 rd Party Applications Web Service ASP. NET IIS Report Data Sources WMI Windows Service WMI Provider Report Server Database Share. Point V 3 Databases Configuration Files

Компоненты SSRS 2008 Report Builder Report Designer Management Studio Share. Point V 3 Configuration Tool 3 rd Party Applications Windows Service Web Service Report Manager Background Processing WMI Report Data Sources Platform WMI Provider Report Server Database Share. Point V 3 Databases Configuration Files

Компоненты SSRS 2008 Report Builder Report Designer Management Studio Share. Point V 3 3 rd Party Report Processing Applications Configuration Tool Scheduling & Delivery Web Service Extensibility Report Manager Database Maintenance Background Processing WMI Report Data Sources Platform WMI Provider Report Server Database Share. Point V 3 Databases Configuration Files

Компоненты SSRS 2008 Report Builder Report Designer Management Studio Share. Point V 3 3 rd Party Applications Configuration Tool App Domain Management ASP. NET Web Service Authentication Report Manager Memory Management Service Network Interface Background Processing WMI Report Data Sources Platform WMI Provider Report Server Database Share. Point V 3 Databases Service Platform Configuration Files

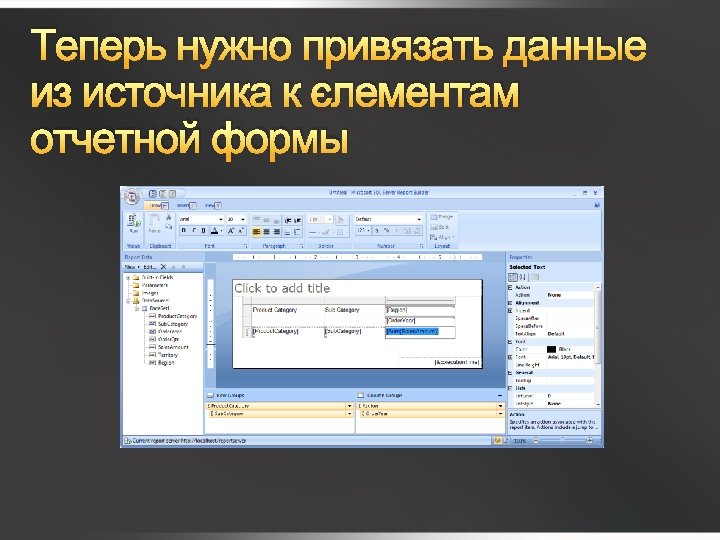
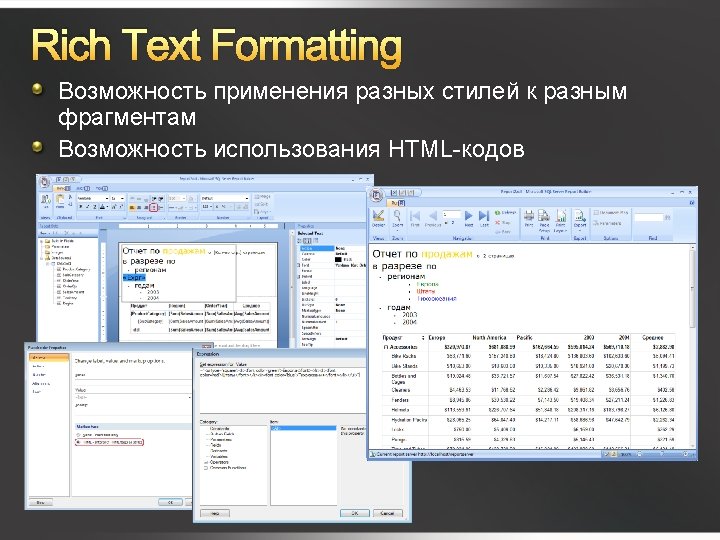
Средства разработки отчетов Шаблон Report Designer в Visual Studio Ставится в составе клиентской части SQL Server Report Builder 2. 0 http: //www. microsoft. com/downlo ads/details. aspx? Family. ID=9 f 783 224 -9871 -4 eea-b 1 d 5 f 3140 a 253 db 6&Display. Lang=en Notepad Имеется в виду, что определение отчета хранится в виде XML и его можно редактировать руками Описание схемы RDL - http: //download. microsoft. com/do wnload/6/5/7/6575 f 1 c 8 -460748 d 2 -941 dc 69622 e 11 c 32/RDL_spec_08. pdf
, Stacked (3 -D), 100% Stacked (3")
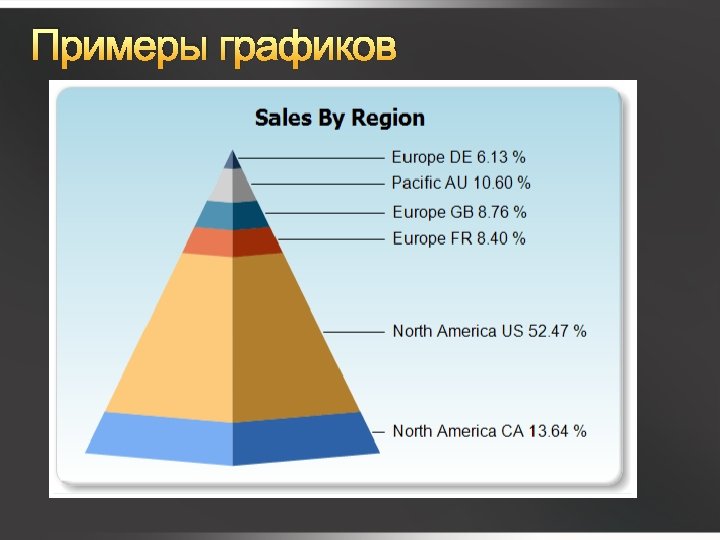
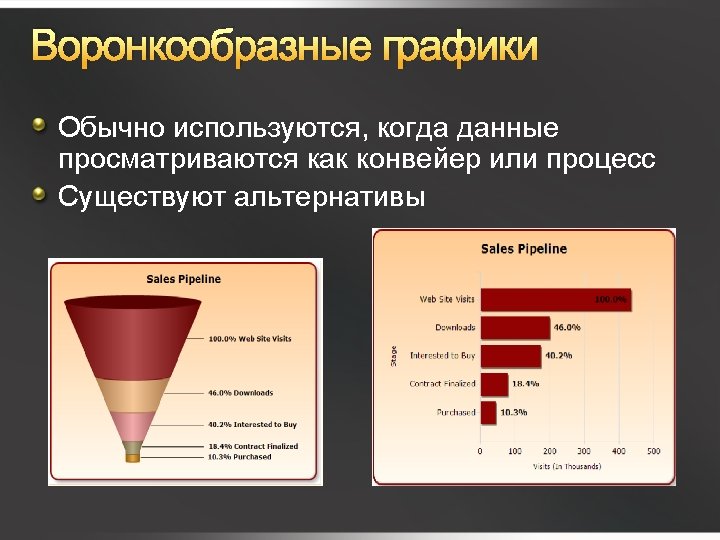
Типы графиков в SSRS 2008 Column (3 -D), Stacked (3 -D), 100% Stacked (3 -D), Clustered (3 -D), Cylinder (3 -D) , Stacked Cylinder (3 -D), 100% Stacked Cylinder (3 -D), Clustered Cylinder (3 -D) Line (3 -D), Smooth Line, Stepped Line, Smooth Line, Stepped Line with Markers, Smooth Line with Markers Shape Pie (3 -D), Exploded Pie (3 -D), Doughnut, Exploded Doughnut, Funnel (3 -D), Pyramid (3 -D) Area (3 -D), Smooth Area (3 -D), Stacked, Smooth Area (3 -D) 100% Stacked (3 -D) Новое в SQL Server Reporting Services 2008 Range Smooth, Range Column, Range Bar, Stock, Candlestick, Error Bar, Boxplot Bar, Stacked (3 -D), 100% Stacked (3 -D), Clustered (3 -D) Stacked Horizontal Cylinder (3 -D), Stacked 100% Horizontal Cylinder (3 -D), Clustered Horizontal Cylinder (3 -D) Scatter Bubble Polar, Radar (3 -D) Pareto Histograms
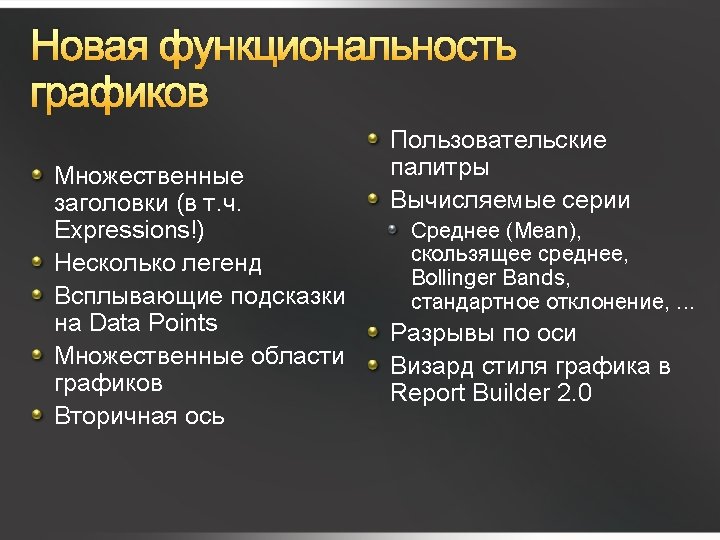
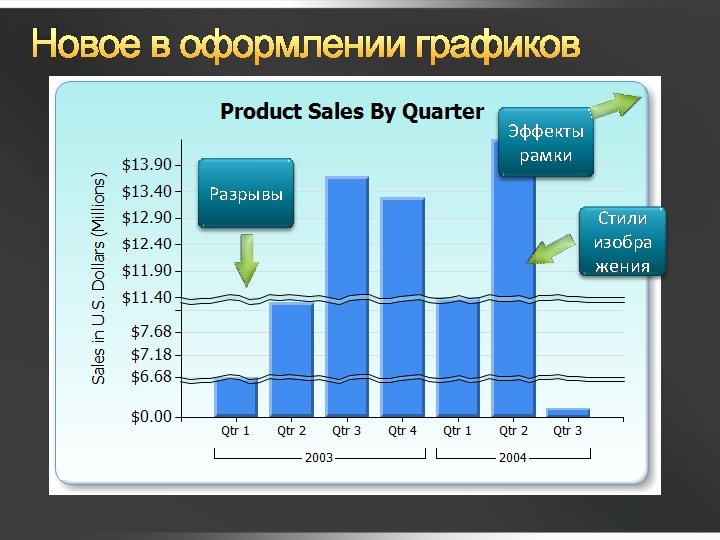

Новое в оформлении графиков Multiple Legends Calculated Series Strip lines Multiple Chart Areas

Гистограммы Установить Series Type = Column Custom Attributes Histogram. Segment. Interval. Number Histogram. Segment. Interval. Width Histogram. Show. Percent. On. Secondary. Axis

Диаграммы Парето Установите Chart Type = Column Custom Attributes Show. Column. As Property = “Pareto” Уберите Axis Title по Secondary Axis, выбрав Chart Area Value Axis в Property Grid

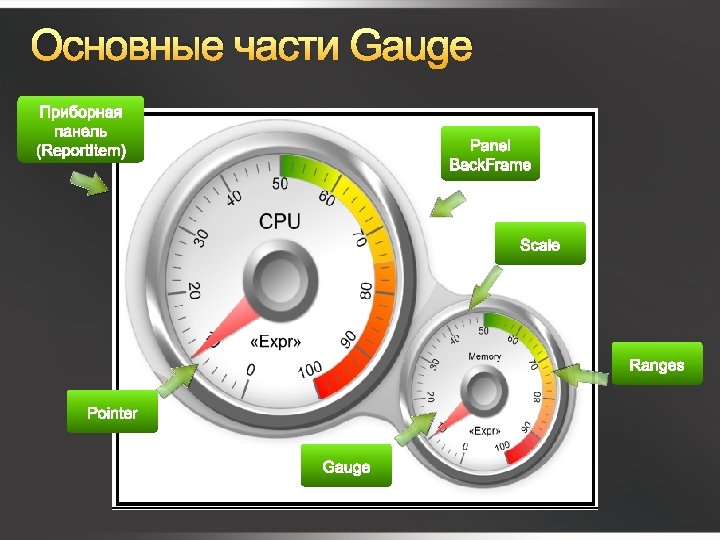
Примеры Radial Gauge Bullet Graph

© 2007 Microsoft Corporation. All rights reserved. Microsoft, Windows Vista and other product names are or may be registered trademarks and/or trademarks in the U. S. and/or other countries. The information herein is for informational purposes only and represents the current view of Microsoft Corporation as of the date of this presentation. Because Microsoft must respond to changing market conditions, it should not be interpreted to be a commitment on the part of Microsoft, and Microsoft cannot guarantee the accuracy of any information provided after the date of this presentation. MICROSOFT MAKES NO WARRANTIES, EXPRESS, IMPLIED OR STATUTORY, AS TO THE INFORMATION IN THIS PRESENTATION.
- Slides: 51