SQL SERVER ADMIN BEST PRACTICES WITH DMVS William
SQL SERVER ADMIN BEST PRACTICES WITH DMV'S William Assaf, Sparkhoun
SQL SERVER ADMIN BEST PRACTICES WITH DMV'S An incomplete tour of SQL Server DMV’s, covering the most important topics and getting you started on getting the most you can out of these crucial performance indicators.
AUDIENCE Everyone can benefit from knowledge of these helpful tools, from developers to report writers to DBA’s of all levels of experience.

PURPOSE OF THIS PRESENTATION There are far too many DMVs to be covered in the scope of this presentation, here are the most useful and popular. Getting anything out of DMVs will require you to try them yourself. Short, quick-hitting labs throughout. We won’t get to all Labs, but you
STOP ME If you have a question If you have used the DMV in an interesting, practical way If you’d like to stare at the TSQL code a little bit longer • Don’t worry – slides and samples will be posted on my blog at SQLTact. com • Some labs use Microsoft’s Wide. World. Importers sample database: https: //github. com/Microsoft/sql-serversamples/releases/tag/wid. Wide. World. Importers-Full. bake-worldimporters-v 1. 0 • Toolbox for all Labs on Github: 5

WHAT IS A DMV? Dynamic Management Views are in place to provide system transparency. The DMV’s we are talking about today are the foundation of countless third party SQL monitoring applications.

WHAT IS A DMV? They all fall into a category of DMO’s. Some are DMF’s, table-valued Functions with parameters. For these purposes, we will call them all DMV’s, because we can 7
WHAT IS A DMV? Most DMO’s in this session work back to SQL 2005 (90). Some database-level DMV’s require the database to be in the needed compatibility mode or higher Some towards the end of the presentation have been introduced more recently, including some in SQL 2019 Often, DMV changes are included for older versions via Service Packs or Cumulative 8 Updates.
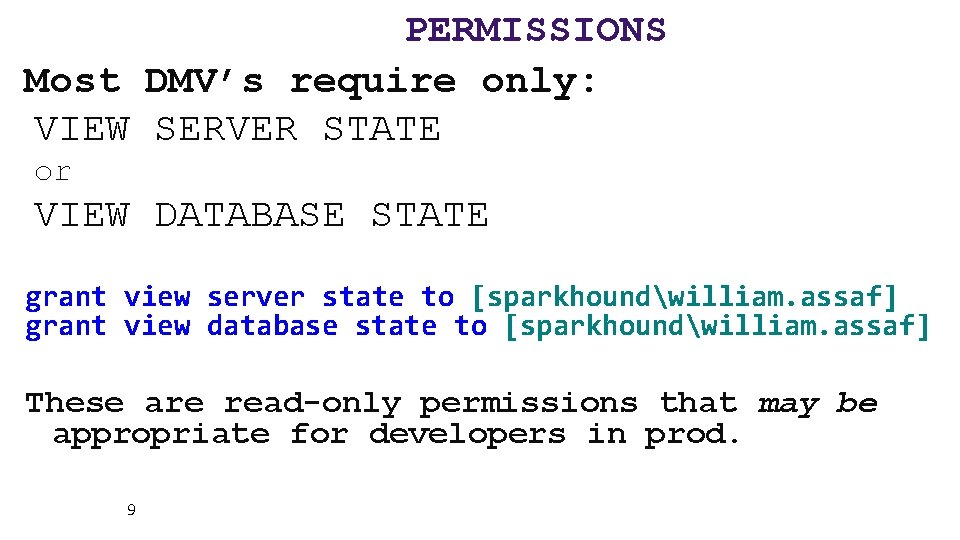
PERMISSIONS Most DMV’s require only: VIEW SERVER STATE or VIEW DATABASE STATE grant view server state to [sparkhoundwilliam. assaf] grant view database state to [sparkhoundwilliam. assaf] These are read-only permissions that may be appropriate for developers in prod. 9

READY?
SYS. DM_OS_WAIT_STATS Aggregated wait times – records when something has to wait and retains it. Records count of tasks experiencing the wait type, sum of time and max time waiting. There are 1054 (more or less documented) wait types in SQL 2019 CTP 3. 0. 11
SYS. DM_OS_WAIT_STATS Wait Stats can be powerful diagnostic tools. Many performance suits do little more than incorporate Wait Stats data for charts in their dashboards, but they also are great sponsors of user groups and SQLSaturday events! 12
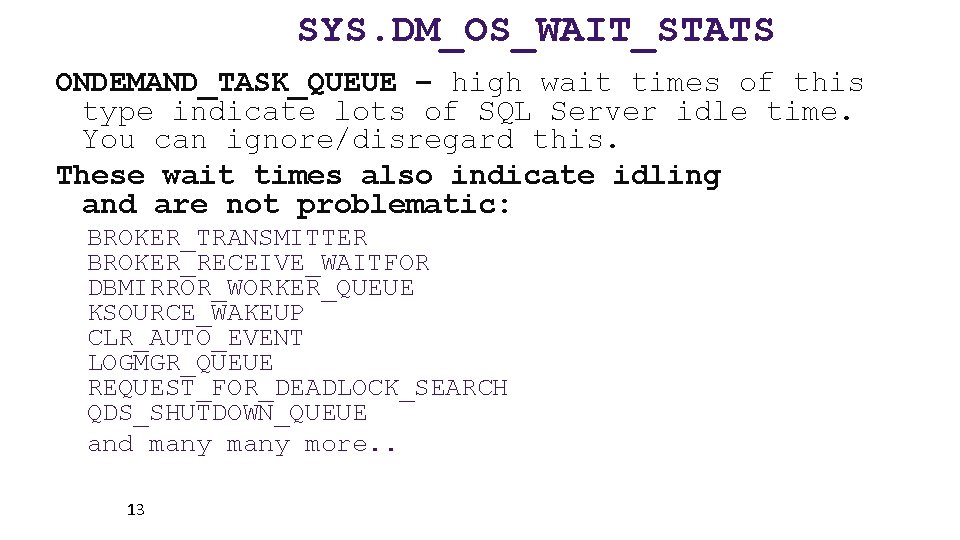
SYS. DM_OS_WAIT_STATS ONDEMAND_TASK_QUEUE – high wait times of this type indicate lots of SQL Server idle time. You can ignore/disregard this. These wait times also indicate idling and are not problematic: BROKER_TRANSMITTER BROKER_RECEIVE_WAITFOR DBMIRROR_WORKER_QUEUE KSOURCE_WAKEUP CLR_AUTO_EVENT LOGMGR_QUEUE REQUEST_FOR_DEADLOCK_SEARCH QDS_SHUTDOWN_QUEUE and many more. . 13
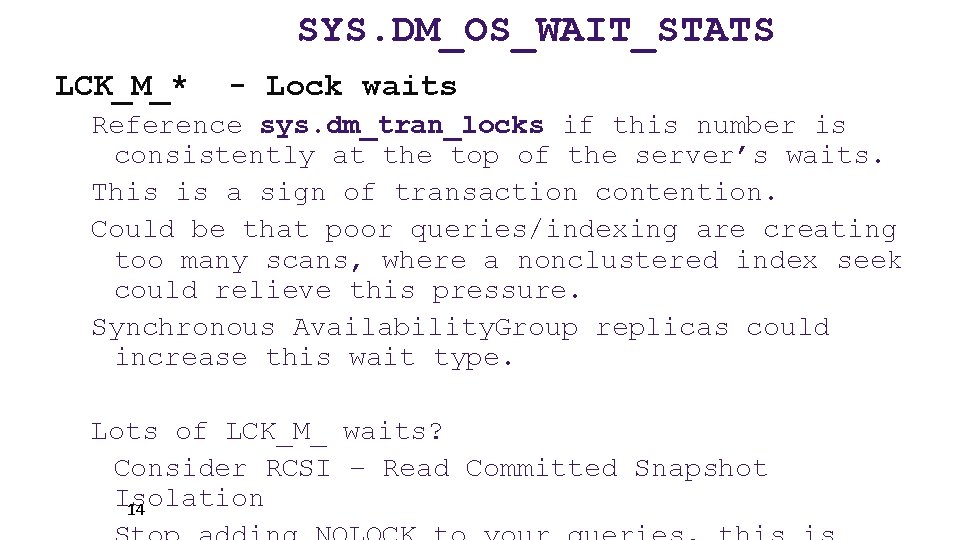
SYS. DM_OS_WAIT_STATS LCK_M_* - Lock waits Reference sys. dm_tran_locks if this number is consistently at the top of the server’s waits. This is a sign of transaction contention. Could be that poor queries/indexing are creating too many scans, where a nonclustered index seek could relieve this pressure. Synchronous Availability. Group replicas could increase this wait type. Lots of LCK_M_ waits? Consider RCSI – Read Committed Snapshot Isolation 14
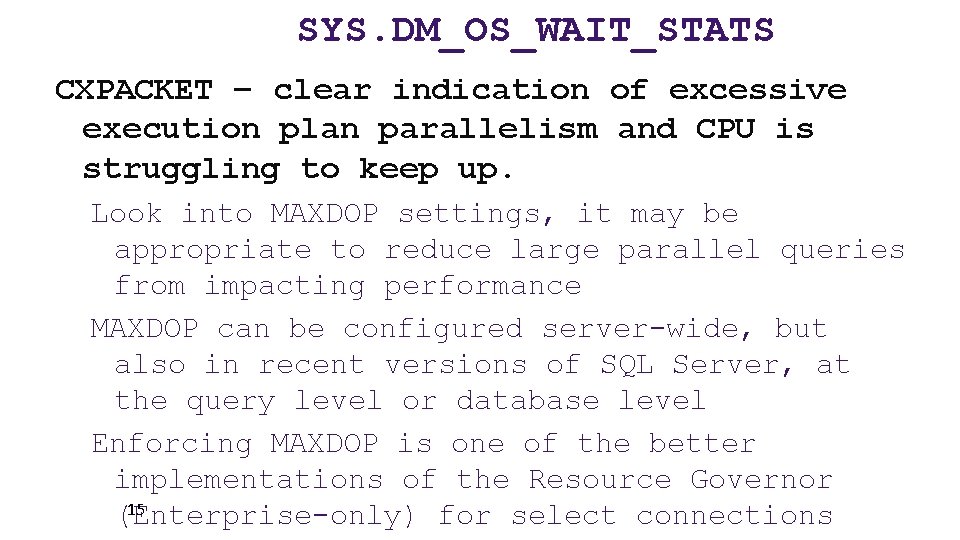
SYS. DM_OS_WAIT_STATS CXPACKET – clear indication of excessive execution plan parallelism and CPU is struggling to keep up. Look into MAXDOP settings, it may be appropriate to reduce large parallel queries from impacting performance MAXDOP can be configured server-wide, but also in recent versions of SQL Server, at the query level or database level Enforcing MAXDOP is one of the better implementations of the Resource Governor 15 (Enterprise-only) for select connections
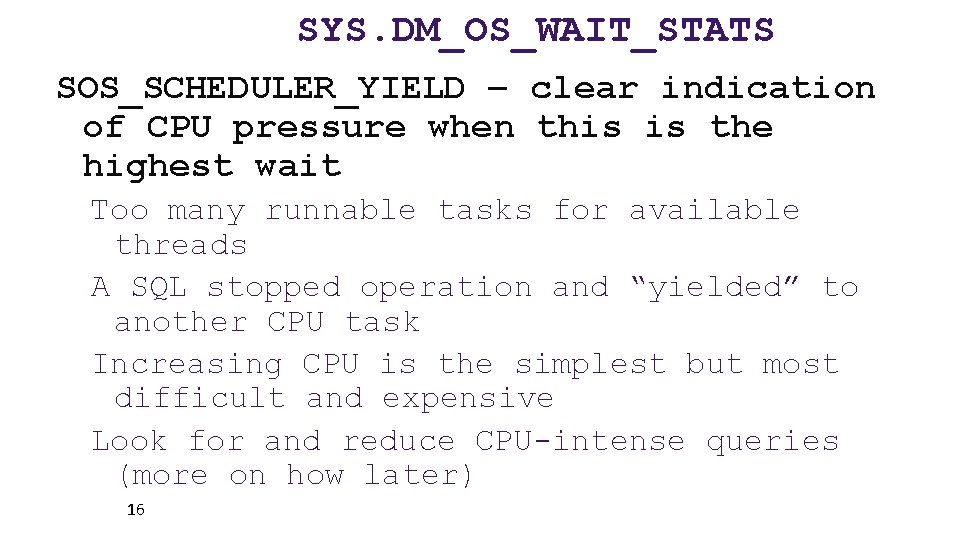
SYS. DM_OS_WAIT_STATS SOS_SCHEDULER_YIELD – clear indication of CPU pressure when this is the highest wait Too many runnable tasks for available threads A SQL stopped operation and “yielded” to another CPU task Increasing CPU is the simplest but most difficult and expensive Look for and reduce CPU-intense queries (more on how later) 16
SYS. DM_OS_WAIT_STATS RESOURCE_SEMAPHORE – request is waiting on memory to be gathered before starting Indication of memory pressure caused by: • Insufficient system memory (unlikely) • Poor query design, poor indexing, inefficient execution plan (likely) 17
SYS. DM_OS_WAIT_STATS PAGELATCH_xx - Nothing to do with Physical IO. Multiple threads are attempting to access a page in memory. Contention over a page in memory. Could be tempdb temp tables are being overused. Could be an INSERT statement hotspot on a table. PAGEIOLATCH_xx – This is Physical IO, reading data from disk into memory. Hard disks/SAN are struggling to keep up. Often this is because of inefficient application code Or, executives/analysts/goons are running MS 18 Access or Excel and pulling down entire tables
SYS. DM_OS_WAIT_STATS PAGELATCH_xx - New in SQL 2019 - A new index option OPTIMIZE_FOR_SEQUENTIAL_KEY specifically for tables with clustered keys on IDENTITY and SEQUENCE that have high write volumes, creating “hot spots” for sequential inserts. If you observe high amounts of PAGELATCH_EX, it may be because of contention for individual pages in memory due to sequential inserts. This new index option improves performance for tables that have a 19 sequential key.
SYS. DM_OS_WAIT_STATS ASYNC_NETWORK_IO – Common, caused by waits involving the reception of data by the remote clients. • Almost certainly not caused by the network. • Almost certainly caused by poor queries, such as SELECT *’s with no WHERE clause • Look for queries with high row counts • Will be caused by Office apps that query entire tables 20
SYS. DM_OS_WAIT_STATS When to analyze? Use on healthy or troubled systems, look for trending from a baseline. Determine which waits are impacting performance server-wide. It is one of the best DMV’s for serverwide performance. 21
SYS. DM_OS_WAIT_STATS • This number is a forever-growing aggregate. • Which means over time, recent changes will not affect the large aggregate numbers well. • For your performance-sensitive servers, consider a regimen of collection and manual wiping the stats weekly or daily. 22 Lab: dm_os_wait_stats. sql
SYS. DM_OS_WAIT_STATS Again, sys. dm_os_wait_stats is aggregated at the instance level. Doesn’t include live data. Doesn’t include request- or sessionlevel data. For that you’ll need the next DMV… 23
SYS. DM_OS_WAITING_TASKS Shows waits for current requests, not aggregated. Not much different from the current wait information in sys. dm_exec_requests (more on that important DMV later) 24
SYS. DM_EXEC_SESSION_WAIT_STATS New in SQL 2016 – Shows waits for the current session. Instead of server-wide waits or current waits, we can drill into specific query waits aggregated with the session so far, since it connected. The syntax is the same as the aggregated sys. dm_os_wait_stats, but includes an extra column for session_id. 25
SUMMARY OF WAIT TYPE DMV’S Labs: dm_os_wait_stats. sql - Aggregate Waits dm_os_waiting_tasks. sql – Live Session-level Waits dm_exec_session_wait_stats. sql – Aggregate Session -level Waits 26
SYS. DM_EXEC_QUERY_STATS • Stores performance information about the cached query plans in memory, but rows do not persist after a plan is removed from the cache (or an instance restart). • Provides a sql_handle and offsets (integers) to identify the statement within a batch or stored procedure using sys. dm_exec_sql_text. 27
SYS. DM_EXEC_QUERY_STATS • Used for in-depth performance tuning. • Find the “worst” queries in terms of total_worker_time (CPU), rows affected, and duration. • Records total writes, total 28
SYS. DM_EXEC_QUERY_STATS Lab: Worst query plans. sql But wait! SQL 2016+’s Query Store feature contains more and better information and functionality. Query Store is SO GOOD, that I no longer recommend using a “Worst Query Plans” script based on sys. dm_exec_query_stats in SQL 2016+. 29
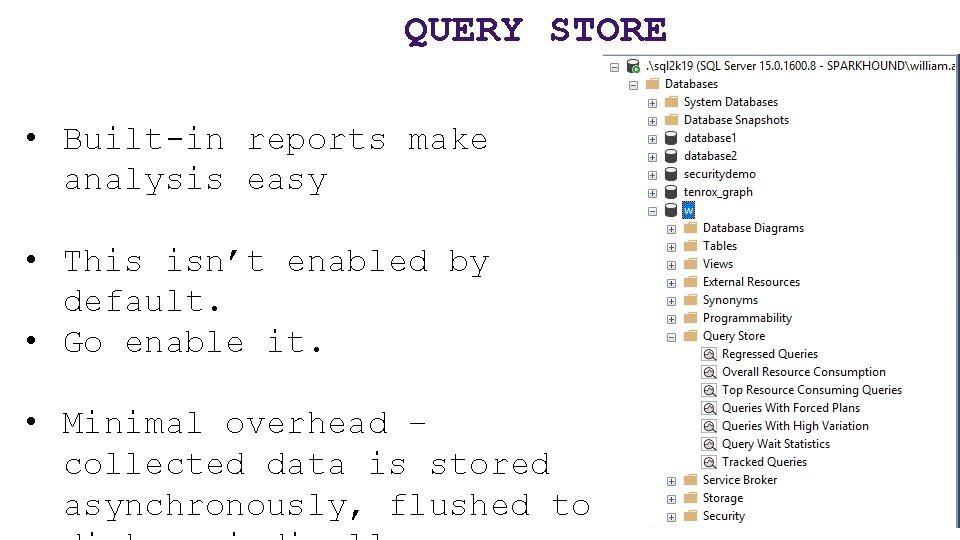
QUERY STORE • Built-in reports make analysis easy • This isn’t enabled by default. • Go enable it. • Minimal overhead – collected data is stored asynchronously, flushed to
QUERY STORE • New in SQL 2016, even better in SQL 2017. • Starting with SQL 2017, Query Store tracks Wait Stats too! • A feature that was developed for Azure SQL first. • Tracks the performance of queries – not of execution plans – a distinct
QUERY STORE • The “worst plans in cache” is a common strategy to identify the most expensive plans • The Query Store is one step better – finding the recent “worst queries” regardless of plan, with sortable/aggregable metrics to launch your performance tuning as a developer or DBA.
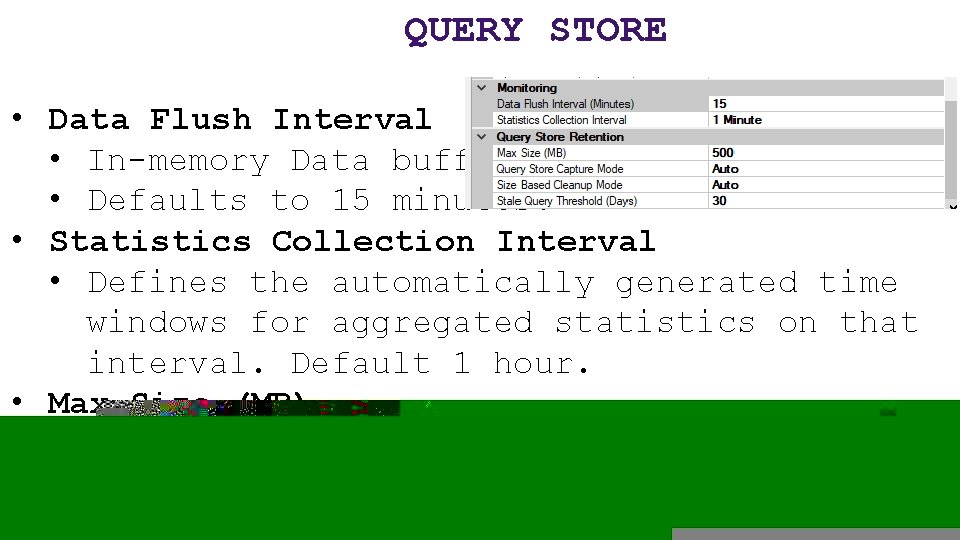
QUERY STORE • Data Flush Interval • In-memory Data buffer. • Defaults to 15 minutes. • Statistics Collection Interval • Defines the automatically generated time windows for aggregated statistics on that interval. Default 1 hour. • Max Size (MB) • Actual space on disk inside the user database. Default 100 MB probably isn’t enough to track busy history.
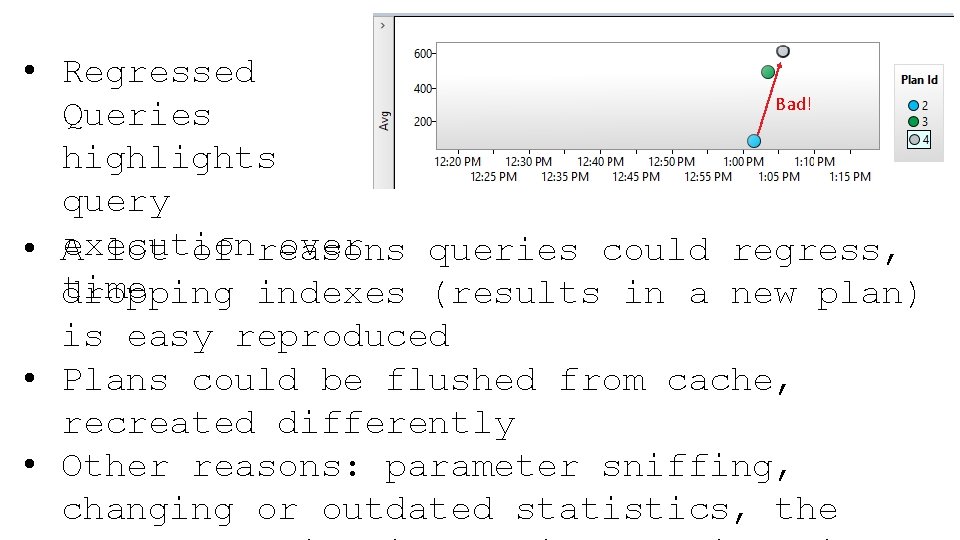
QUERY STORE • Regressed Bad! Queries highlights query execution over • A lot of reasons queries could regress, time dropping indexes (results in a new plan) is easy reproduced • Plans could be flushed from cache, recreated differently • Other reasons: parameter sniffing, changing or outdated statistics, the
QUERY STORE – NEXT LOGICAL STEP? • What if SQL Server could use information about Regressed Queries and a history of execution plans to decisions to automatically use a better plan? • Now it can! • Automatic Plan Correction (new to SQL 2017)! • Again, Azure SQL Database already does this for you!
AUTOMATIC PLAN CORRECTION • “Automatic Plan Tuning” is based on Query Store • Available in Azure SQL and now in SQL 2017 to revert a query from a newer, slower plan to an older, faster plan.
AUTOMATIC PLAN CORRECTION • You can also accomplish this manually yourself, or query the underlying information yourself, with a host of DMV’s including sys. dm_db_tuning_recommendations • Sample: https: //docs. microsoft. com/enus/sql/relational-databases/automatictuning/automatic-tuning
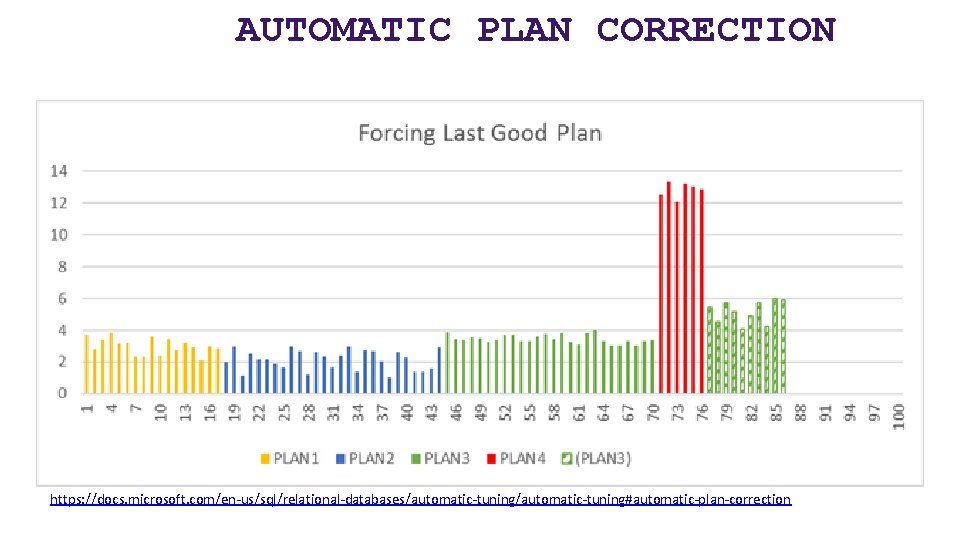
AUTOMATIC PLAN CORRECTION https: //docs. microsoft. com/en-us/sql/relational-databases/automatic-tuning#automatic-plan-correction
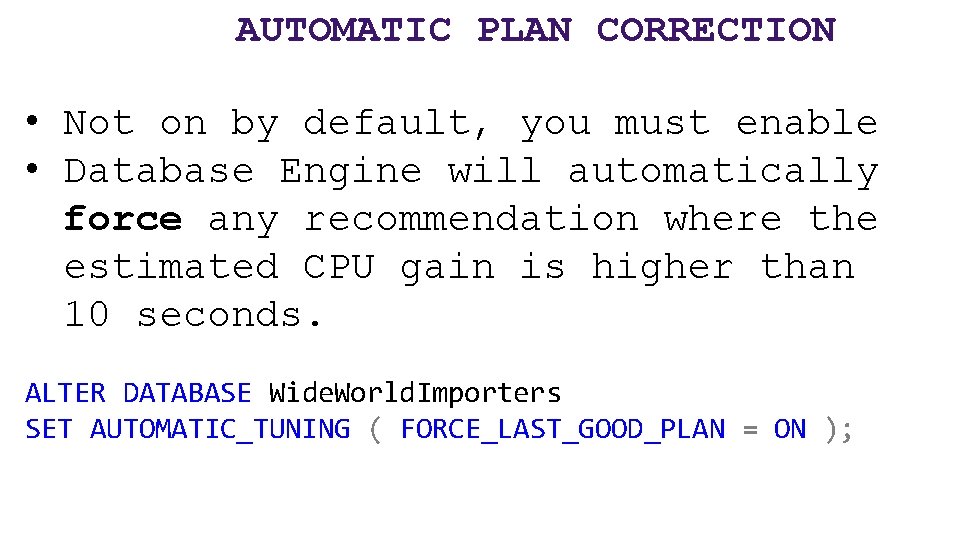
AUTOMATIC PLAN CORRECTION • Not on by default, you must enable • Database Engine will automatically force any recommendation where the estimated CPU gain is higher than 10 seconds. ALTER DATABASE Wide. World. Importers SET AUTOMATIC_TUNING ( FORCE_LAST_GOOD_PLAN = ON );
SYS. DM_EXEC_SESSIONS • Queryable session info • Includes connection identification info • Replaces the old system view sysprocesses • Often joined to… 41
SYS. DM_EXEC_REQUESTS • Shows current activity, like “SP_WHO 2 active” • Shows only active requests (ignores SLEEPING) • Main hub for many DMO’s providing request info, often joined with others. • Provides a sql_handle and offsets 42
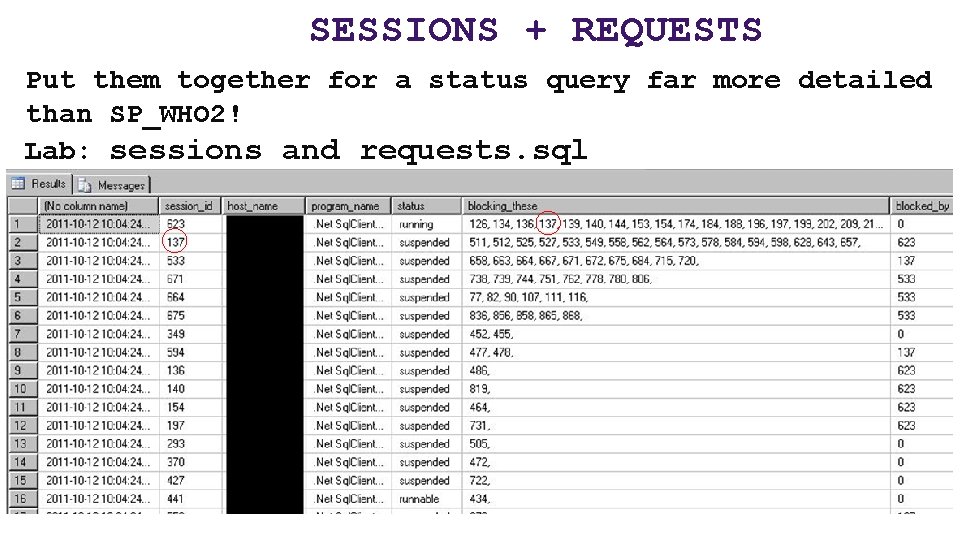
SESSIONS + REQUESTS Put them together for a status query far more detailed than SP_WHO 2! Lab: sessions and requests. sql
SYS. DM_EXEC_REQUESTS • Use the helpful percent_complete column to check progress of BACKUP and RESTORE. • Also applies to DBCC CHECKDB operations! • Combined with the start_time value, can estimate a completion datetime as well. 44 Lab:
SYS. DM_EXEC_INPUT_BUFFER • DBCC INPUTBUFFER still not deprecated • But has been effectively replaced by a new DMF first introduced in SQL 2014 SP 2: sys. dm_exec_input_buffer • This can display the last command issued from a session, even if there is no live request 45
INDEX DMV’S YOU SHOULD KNOW Physical stats DMV’s: Help you evaluate need for index maintenance Missing Index DMV’s: Help you design new indexes Index Usage Stats DMV: Helps you evaluate existing index usage
SYS. DM_DB_INDEX_PHYSICAL_STATS Determine index fragmentation to do SQLlevel defrag. Root of all index fragmentation monitoring queries. avg_fragmentation_in_pct shows logical fragmentation for indexes and extent fragmentation for heaps. 47 Replaces the functionality of
SYS. DM_DB_INDEX_PHYSICAL_STATS Will still show tables without clustered indexes as Index_id = 0, this is a HEAP. Almost always, a heap is poor design or an oversight. However, heap fragmentation isn’t meaningful. Index_ID = 1 is the clustered index. 49
SYS. DM_DB_INDEX_PHYSICAL_STATS • Avg_fragmentation_pct is a scale of 0 (not fragmented) to 100 (perfectly fragmented) • You may find it beneficial to perform some sort of index maintenance when avg_fragmentation_pct > 10, but this may vary. • You may find a better balance of meaningful performance protection and logged maintenance activity with less aggressive maintenance > 50. 50
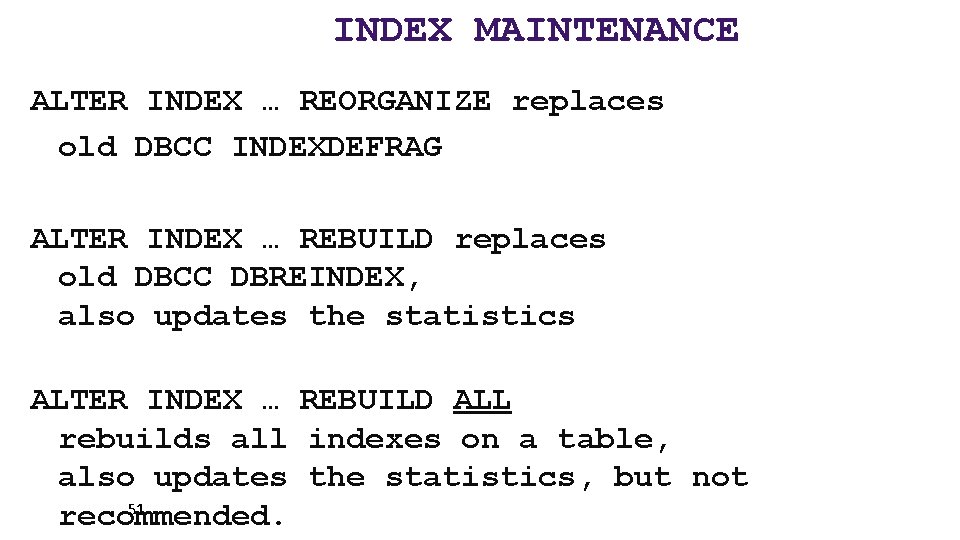
INDEX MAINTENANCE ALTER INDEX … REORGANIZE replaces old DBCC INDEXDEFRAG ALTER INDEX … REBUILD replaces old DBCC DBREINDEX, also updates the statistics ALTER INDEX … REBUILD ALL rebuilds all indexes on a table, also updates the statistics, but not 51 recommended.
SYS. DM_DB_INDEX_PHYSICAL_STATS When to use? Use while your application is in production to identify tables that are generating fragmentation over time. Then, only perform index maintenance on individual indexes as needed, and then, potentially on partitions of indexes. 52
INDEX MAINTENANCE Custom scripts that use this selective approach work fine. SSMS Maintenance Plans since SQL 2016 have dramatically increased capability to perform complex, conditional index maintenance operations. You can configure the REORGANIZE and REBUILD tasks to maintain only indexes
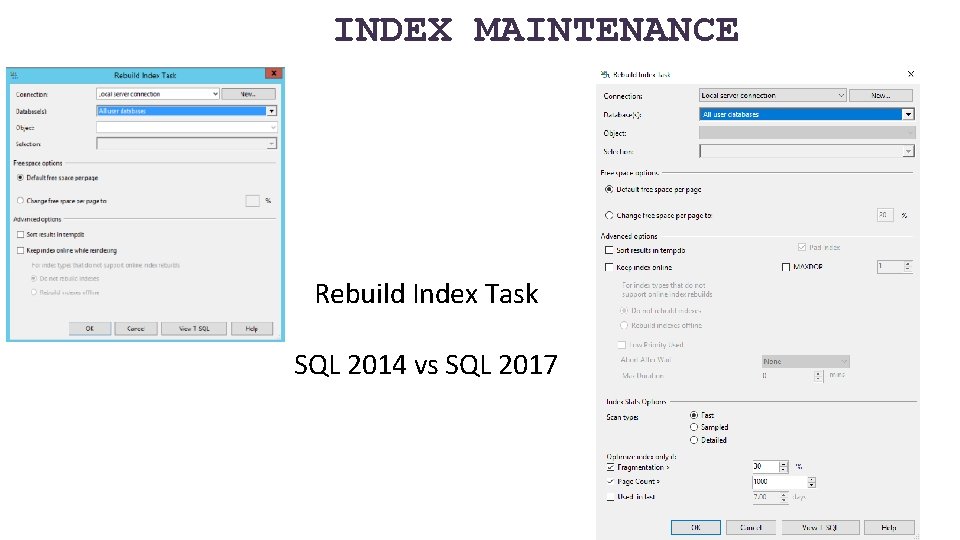
INDEX MAINTENANCE Rebuild Index Task SQL 2014 vs SQL 2017
SYS. DM_DB_INDEX_PHYSICAL_STATS Lab: *lab - fragmented table. sql *defrag. sql automated index rebuild. sql 57
ASIDE, ON FRAGMENTATION Why did the Microsoft Windows 7 RC download page break? http: //www. sqlskills. com/BLOGS/PAUL/post/Why-did-the-Windows-7 -RCfailure-happen. aspx 58

DM_DB_COLUMN_STORE_ROW_GROUP_PHYSICAL_STATS Columnstore indexes have their own DMV for rowgroup status and fragmentation, sys. dm_db_column_store_row_group_physical_ stats You need to include this DMV in any of your maintenance scripts if you have Columnstore indexes (and you probably should, they’re awesome SQL 2016+!). Since Columnstore indexes are read-only
DM_DB_COLUMN_STORE_ROW_GROUP_PHYSICAL_STATS You may find it necessary to REORGANIZE a Columnstore index multiple times before the rowgroups are compressed and the delta store rowgroups are moved to TOMBSTONE status. Lab: Defrag Columnstore. sql

INDEXES
MISSING INDEXES VIEWS My favorite feature of introduced by SQL 2005. A set of DMV’s record whenever a query plan recognized the need for an index that could have improved performance. SQL records that recognized need, 63 along with estimated statistics on
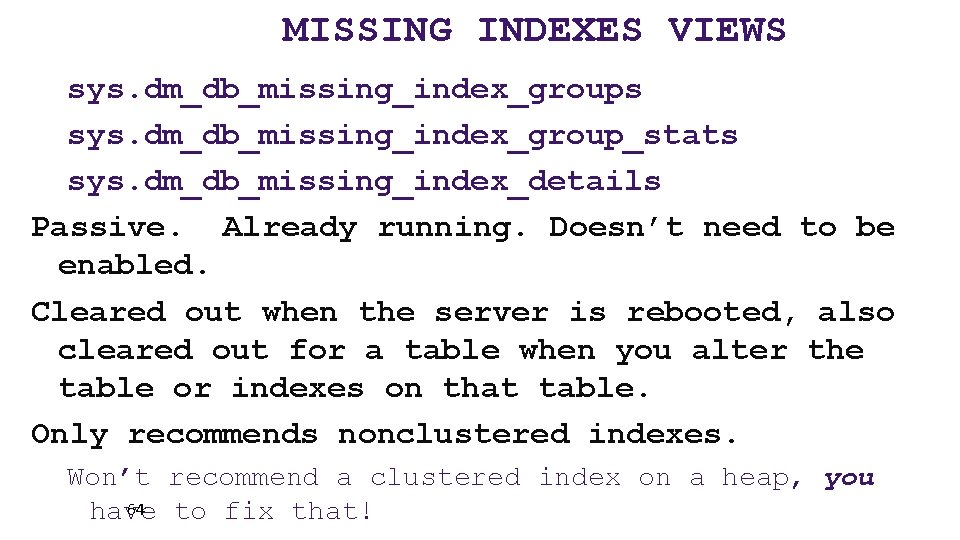
MISSING INDEXES VIEWS sys. dm_db_missing_index_groups sys. dm_db_missing_index_group_stats sys. dm_db_missing_index_details Passive. Already running. Doesn’t need to be enabled. Cleared out when the server is rebooted, also cleared out for a table when you alter the table or indexes on that table. Only recommends nonclustered indexes. Won’t recommend a clustered index on a heap, you 64 have to fix that!
MISSING INDEXES VIEWS Must be used with sobriety. Don’t create every suggested missing index or your update/insert/deletes will suffer. Nonclustered Indexes are physical data copies of your table, and must be kept up to date too. Writes can benefit from nonclustered indexes by making more efficient 65
MISSING INDEXES VIEWS Few indexes should be created to satisfy many suggestions. Suggestions may only differ by column order, the columns in the key vs. INCLUDE’d, or by a small number of columns. Combine suggestions together with common keys, a combined INCLUDE list. Combine with existing indexes on the table as well, potentially replacing an old index. However, be careful not to change the uniqueness of the table. A unique index = a 66 unique constraint.
MISSING INDEXES VIEWS When to use? After you have actual usage running against production. Don’t use during development, too likely to be misleading. Do use during user testing to simulate actual usage. Do use on your production environment after a stable period of active and typical activity. 67
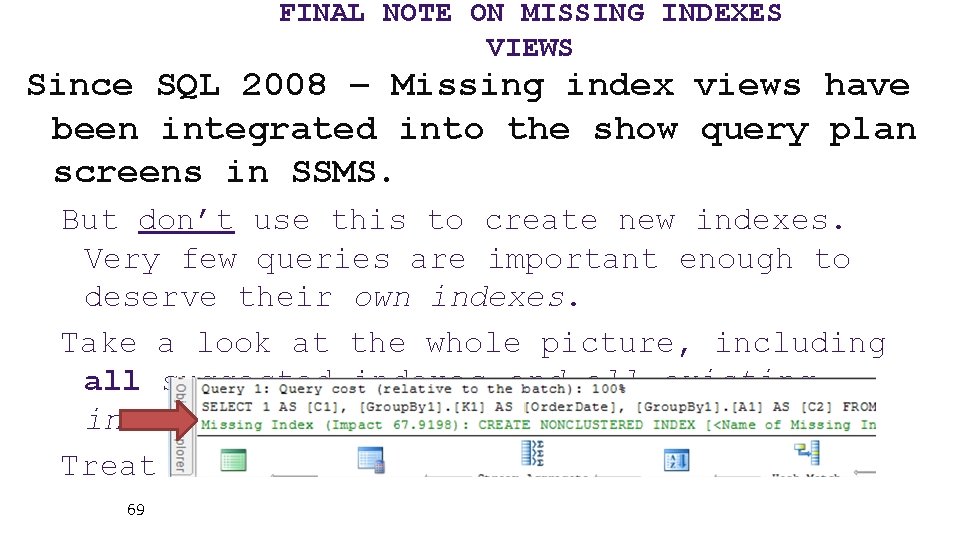
FINAL NOTE ON MISSING INDEXES VIEWS Since SQL 2008 – Missing index views have been integrated into the show query plan screens in SSMS. But don’t use this to create new indexes. Very few queries are important enough to deserve their own indexes. Take a look at the whole picture, including all suggested indexes and all existing indexes before creating any indexes. Treat this as an alert! 69
MISSING INDEXES VIEWS Lab lab - missing index setup demo. sql missing indexes. sql 70
SYS. DM_DB_INDEX_USAGE_STATS • Tracks access operations on all indexes and HEAPs, cumulatively. • Data resets with the instance or if db is detached. • Retains data through maintenance operations. • Joins to sys. indexes on object_id and index_id 71
SYS. DM_DB_INDEX_USAGE_STATS How to use? Zero values in user_lookups, user_seeks, and user_scans = This index isn’t being read from. User_updates (writes) greater than the sum of reads = This index might hurt more than it helps. This criteria could be different based on 72
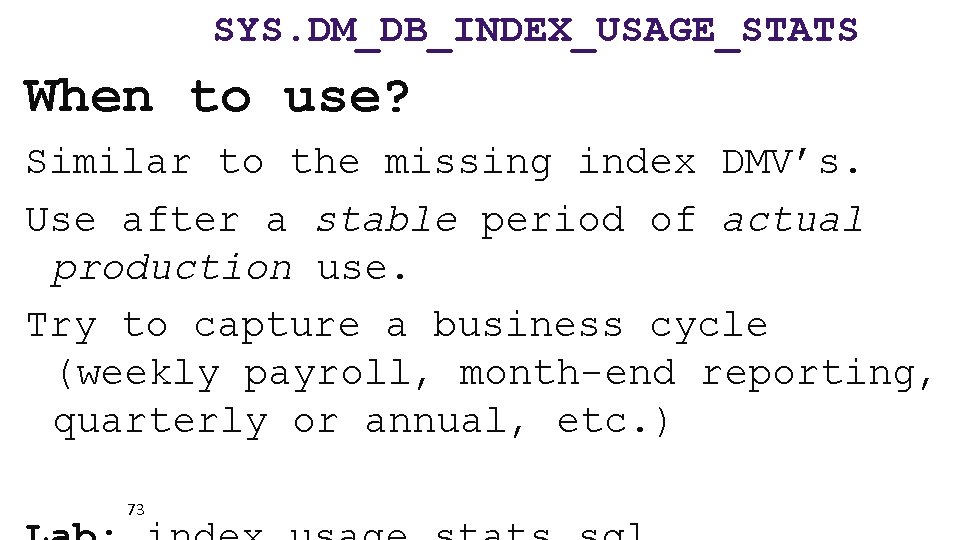
SYS. DM_DB_INDEX_USAGE_STATS When to use? Similar to the missing index DMV’s. Use after a stable period of actual production use. Try to capture a business cycle (weekly payroll, month-end reporting, quarterly or annual, etc. ) 73
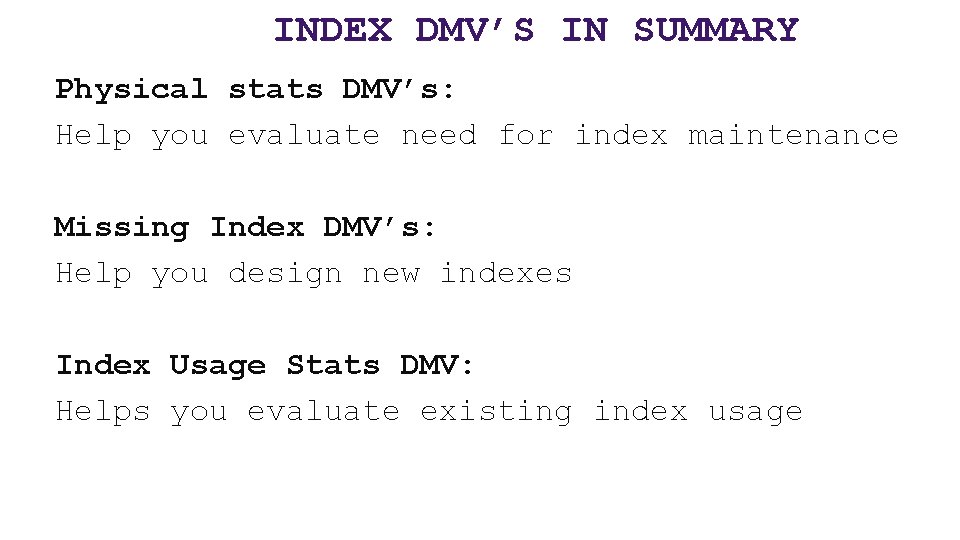
INDEX DMV’S IN SUMMARY Physical stats DMV’s: Help you evaluate need for index maintenance Missing Index DMV’s: Help you design new indexes Index Usage Stats DMV: Helps you evaluate existing index usage

DMV RAPID-FIRE ROUND BEGINS
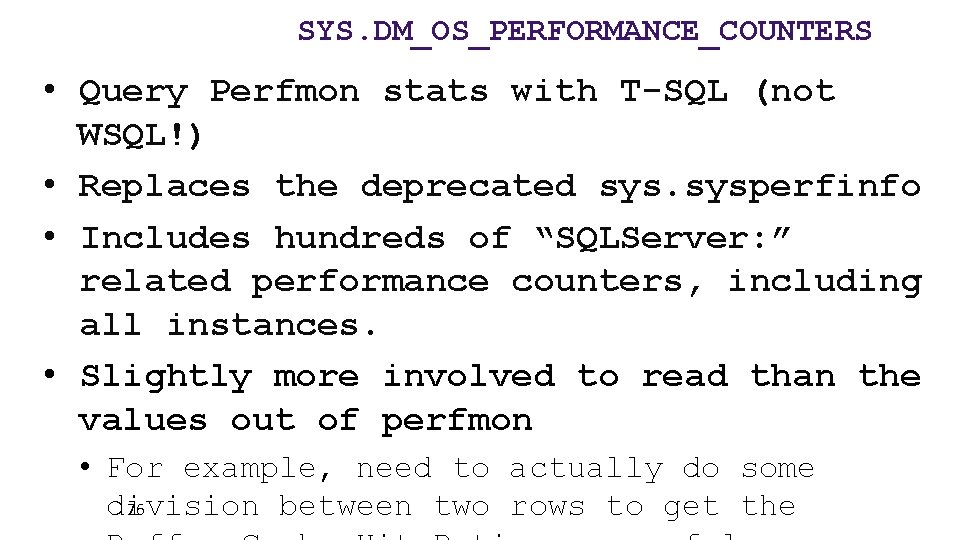
SYS. DM_OS_PERFORMANCE_COUNTERS • Query Perfmon stats with T-SQL (not WSQL!) • Replaces the deprecated sysperfinfo • Includes hundreds of “SQLServer: ” related performance counters, including all instances. • Slightly more involved to read than the values out of perfmon • For example, need to actually do some division between two rows to get the 76
SYS. DM_OS_PERFORMANCE_COUNTERS Lab dm_os_performance_counters. sql page life expectancy. sql 77
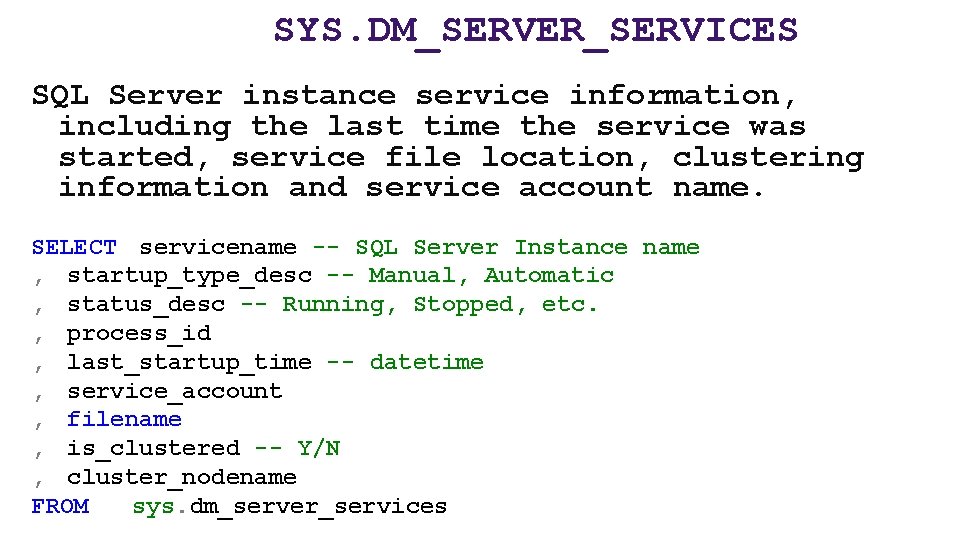
SYS. DM_SERVER_SERVICES SQL Server instance service information, including the last time the service was started, service file location, clustering information and service account name. SELECT servicename -- SQL Server Instance name , startup_type_desc -- Manual, Automatic , status_desc -- Running, Stopped, etc. , process_id , last_startup_time -- datetime , service_account , filename , is_clustered -- Y/N , cluster_nodename FROM sys. dm_server_services
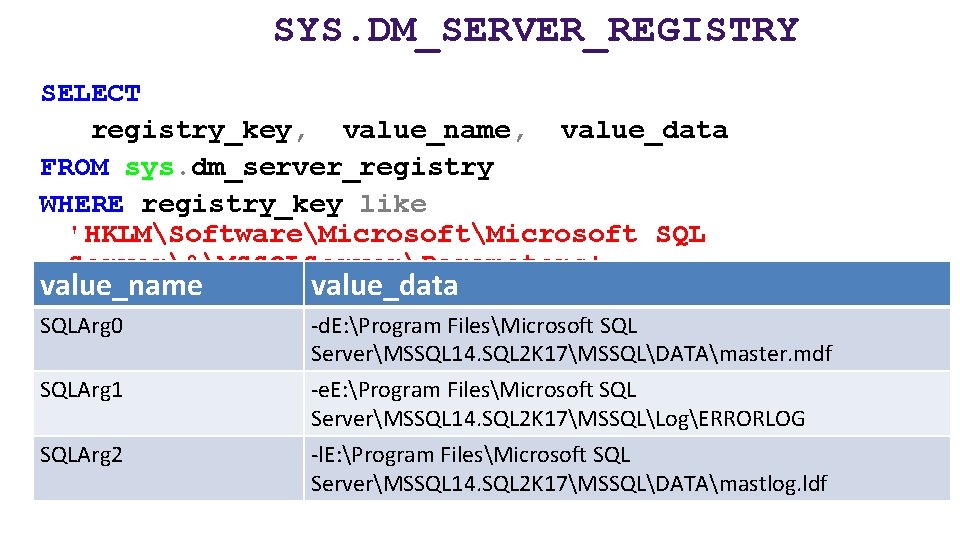
SYS. DM_SERVER_REGISTRY SELECT registry_key, value_name, value_data FROM sys. dm_server_registry WHERE registry_key like 'HKLMSoftwareMicrosoft SQL Server%MSSQLServerParameters' value_name value_data SQLArg 0 -d. E: Program FilesMicrosoft SQL ServerMSSQL 14. SQL 2 K 17MSSQLDATAmaster. mdf SQLArg 1 -e. E: Program FilesMicrosoft SQL ServerMSSQL 14. SQL 2 K 17MSSQLLogERRORLOG -l. E: Program FilesMicrosoft SQL ServerMSSQL 14. SQL 2 K 17MSSQLDATAmastlog. ldf SQLArg 2
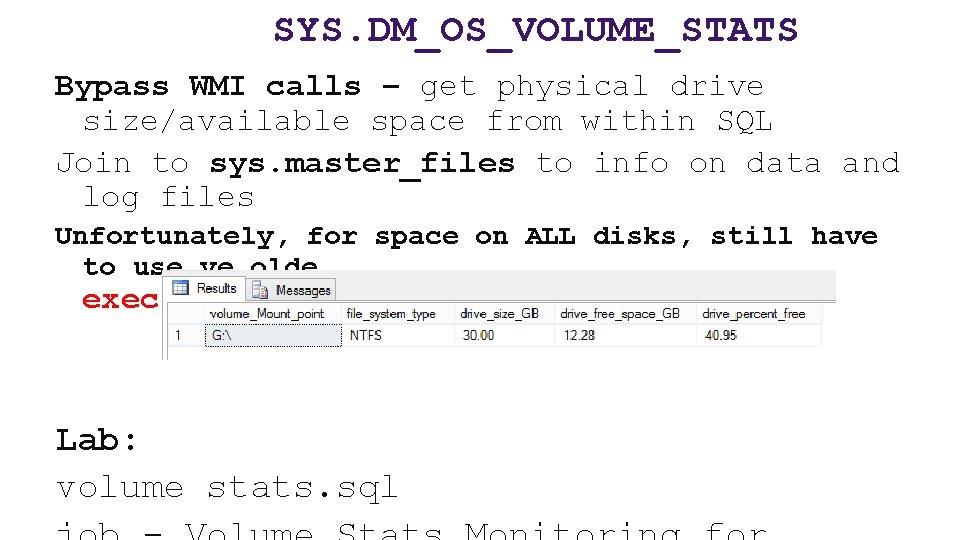
SYS. DM_OS_VOLUME_STATS Bypass WMI calls – get physical drive size/available space from within SQL Join to sys. master_files to info on data and log files Unfortunately, for space on ALL disks, still have to use ye olde exec xp_fixeddrives Lab: volume stats. sql
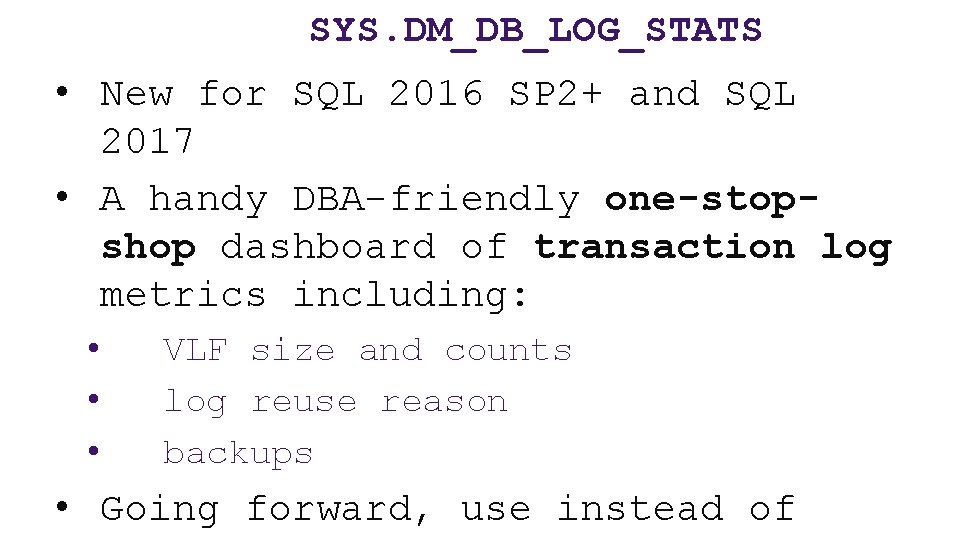
SYS. DM_DB_LOG_STATS • New for SQL 2016 SP 2+ and SQL 2017 • A handy DBA-friendly one-stopshop dashboard of transaction log metrics including: • • • VLF size and counts log reuse reason backups • Going forward, use instead of
SYS. DM_DB_LOG_STATS Databases with too many VLF’s can be problematic when a database is recovered, negatively affecting startup and restore times. You can also now see individual VLF information in sys. dm_db_log_info, instead of using DBCC LOGINFO. Lab: vlfs analysis. sql
SYS. DM_IO_VIRTUAL_FILE_STATS • Includes an ascending counter in milliseconds that can be used to measure the data volume over intervals, • For example: • • • Number of reads/writes issued to a file and volume in bytes IO waits/stall per file and overall IO latency for reads/writes Lab: record_dm_io_virtual_file_stats. sql
SYS. DM_OS_RING_BUFFERS Access to ring buffer endpoints of XEvents sessions The System Health session already gathers a lot of data, including a history of CPU, Memory utilization. The default system_health xevent session the only way to find Deadlocks in the recent past without having set up anything to capture them. It writes to ring_buffer and . xel. Lab:

SYS. DM_HADR_CLUSTER Returns information about Availability Groups Not Always. On cluster, not DAG… Availability Groups. Doesn’t matter if primary or secondary, but many DMV’s require you to run on the current primary replica for an AG to see complete information.
SYS. DM_HADR_CLUSTER Combine with Sys. dm_hadr_database_replica_states, and sys. dm_os_performance_counters for a performance snapshot of Availability Groups, • Including all current configuration, and endpoints • Including your current RPO/RTO (especially useful for asynchronous
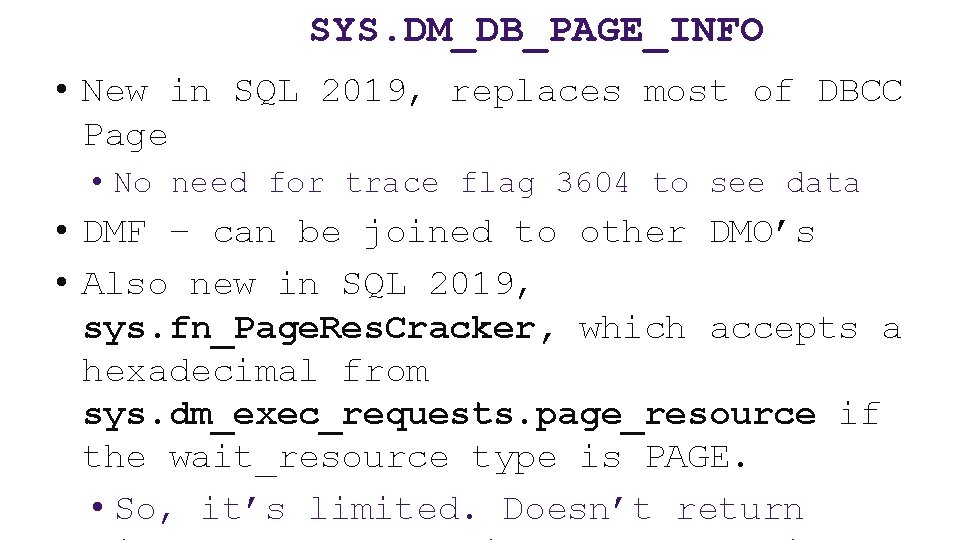
SYS. DM_DB_PAGE_INFO • New in SQL 2019, replaces most of DBCC Page • No need for trace flag 3604 to see data • DMF – can be joined to other DMO’s • Also new in SQL 2019, sys. fn_Page. Res. Cracker, which accepts a hexadecimal from sys. dm_exec_requests. page_resource if the wait_resource type is PAGE. • So, it’s limited. Doesn’t return

Helpful links, sources, and continued reading: http: //www. sqlskills. com/BLOGS/PAUL/post/Why-did-the-Windows-7 -RC-failure-happen. aspx http: //technet. microsoft. com/en-us/library/cc 966413. aspx http: //msdn. microsoft. com/en-us/library/ms 188917. aspx http: //www. codeproject. com/KB/database/Dynamic_Management_Views. aspx http: //glennberrysqlperformance. spaces. live. com/blog/cns!45041418 ECCAA 960!1446. entry http: //sharmilasanctuary. wordpress. com/about/database-performance-dmvs-for-ms-sql-2005/ http: //sqlblog. com/blogs/kevin_kline/archive/2009/04/07/looking-for-good-dmv-database-admin-queries. aspx http: //blogs. msdn. com/jimmymay/archive/2008/10/30/drum-roll-please-the-debut-of-the-sql-dmv-all-starsdream-team. aspx http: //blogs. msdn. com/psssql/archive/2007/02/21/sql-server-2005 -performance-statistics-script. aspx http: //msdn. microsoft. com/en-us/magazine/cc 135978. aspx http: //www. sqlservercentral. com/articles/DMV/64425/ http: //www. sqlskills. com/BLOGS/PAUL/post/Inside-sysdm_db_index_physical_stats. aspx http: //www. sqlskills. com/BLOGS/PAUL/post/Indexes-From-Every-Angle-How-can-you-tell-if-an-index-is-beingused. aspx http: //kswain. blogspot. com/2008/04/sysdmosperformancecounters-dynamic. html http: //www. sqlpassion. at/archive/2014/11/24/deadlocks-caused-by-missing-indexes-in-sql-server http: //www. sql-server-performance. com/articles/per/bm_performance_dashboard_2005_p 2. aspx http: //msdn. microsoft. com/en-us/library/aa 366541%28 VS. 85%29. aspx http: //sqlblog. com/blogs/aaron_bertrand/archive/2011/04/25/more-changes-you-might-not-have-noticed-in-the 90 sql-server-2008 -r 2 -sp 1 -ctp. aspx

SQL Server 2017 Administration Inside Out Published Feb 2018 by Microsoft Press 2 nd edition for SQL 2019 coming Q 4’ 2019* *just a guess

Free SQL Server, . NET, Business Intelligence training and more! An all day FREE training event with SQL Server and Development related sessions spread out over multiple tracks of Business Intelligence, SQL Development, Database Administration, IT Pro, . NET, Career Development, and CIO/IT Management See you August 17 at SQLSat. BR. com

BIO AND CONTACT • William D Assaf, MCSE • Baton Rouge SQL Server UG board and SQLSat chair • Principal Consultant, Manager – DBA Team at Sparkhound Inc. • William. Assaf@sparkhound. com • Twitter: @william_a_dba This presentation, including all source code, available at this SQLSaturday’s schedule page and at my blog: SQLTact. com
- Slides: 86