Sputtering at Europa History and Outlook Tim Cassidy


 discover electronic sputtering, that ice is very")


 showed that the O 2 yield is not a")
: “Cold” ions (~100")

 estimated that only 1/5 th of these cold ions reach")
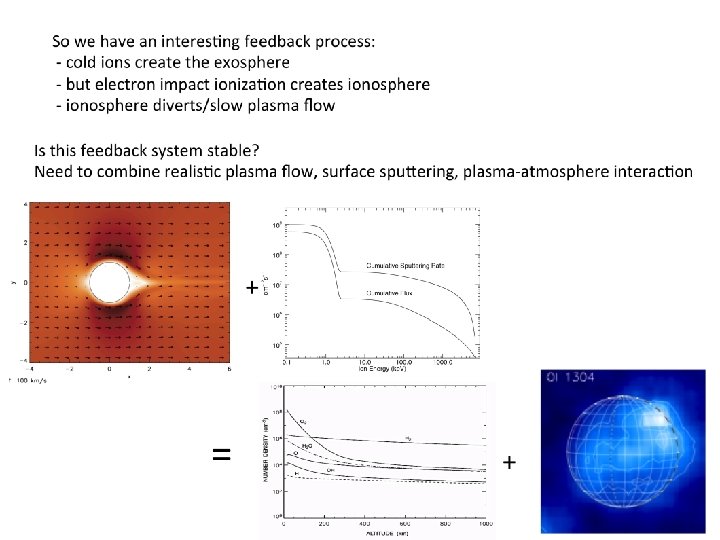
 we have")


 “Hot”/non-thermal ions")


- Slides: 20
Sputtering at Europa History and Outlook Tim Cassidy, with help from Fran Bagenal, Ben Teolis, Chris Paranicas
Europa’s O 2 atmosphere is created by ion sputtering of its surface. Ions eject H 2 O, O 2 & H 2 but only the O 2 sticks around. To get the sputtering rate, multiply ion flux by sputtering yield. S ion flux Energetic ions “Cold” ions (~100 e. V Maxwellian) most of the flux comes from these S ion sputtering yield
But that ion flux shown above assumes that the ions flow straight onto Europa’s surface… which modeling suggests does not happen: cold ions are diverted around Europa Saur et al. (1998) Schilling et al. (2008)
Some plasma must reach surface to produce the observed O 2 atmosphere. Is it a feedback? : Plasma (ions) creates exosphere Plasma (electrons) creates ionosphere from exosphere Ionosphere limits plasma bombardment Some equilibrium is reached
Or maybe O 2 is created energetic particles that are less affected by plasma diversion? Energetic (10 s – 100 s ke. V) electron & ion wake: suggests that these energetic particles are absorbed by body Paranicas et al. , 2000
To figure this out we need to understand the sputtering yield (number of ions ejected per incident particle). What creates O 2? Cold ions? Energetic ions? Which species? O, S, H? We are now in a position to address this problem because of recent breakthroughs in sputtering. spoiler: “cold” ions, mostly On+, produce the O 2 exosphere
A little history: Brown et al. (1978) discover electronic sputtering, that ice is very effectively eroded by energetic ions Johnson et al. (1982) predict that the result will be an O 2 exosphere: sputtering ejects mostly H 2 O from ice, along with a small fraction of H 2 and O 2. But the O 2 will stick around to make an exosphere while the H 2 O freezes to the surface and the H 2 escapes. This paper also introduced the idea of a self-limiting exosphere: the exosphere will build up until ion/neutral collisions stop sputtering Hall et al. (1995) OI emission from O 2 detected
Then came actual models of the O 2 atmosphere, what did they use for ion flux and sputtering yields? The O 2 production was assumed to be some fraction of the total sputtering yield (which is mostly H 2 O) Total yields were estimated by Shi et al. (1995) and others. The total H 2 O yield is dominated by energetic S ions, which have low flux but large sputtering yields. S ion flux Energetic ions “Cold” ions (~100 e. V Maxwellian) most of the flux comes from these S ion sputtering yield
Side note: they assumed that the pattern of sputtering followed the ‘bullseye’ of cold ion bombardment (E. g. , Pospieszalska and Johnson, 1989) Partial list of papers based on this picture of O 2 production: Ip (1996) Saur et al. (1998) Smyth and Marconi (2006) Cassidy et al. (2007) Schilling et al. (2008) Plainaki et al. (2012) But energetic ions hit the surface more uniformly so the sputtering rate actually looks like this: Cassidy et al. , 2012
Then Teolis et al. (2010) showed that the O 2 yield is not a fixed fraction of the total yield: O 2 yield plateaus where total yield takes off
Here is the resulting sputtering rate (O 2 only this time): “Cold” ions (~100 e. V Maxwellian) “Hot”/non-thermal ions Conclusion: Cold ions (especially oxygen ions) responsible for O 2 production
The O 2 sputtering rate with the new O 2 sputtering yields, calculated assuming that Europa is electromagnetically inert, is 1026 s-1 which is really quite small, an order of magnitude smaller than previous estimates (e. g. , Saur et al. , 1998, Smyth and Marconi, 2006). These cold ions are also susceptible to flow diversion/slowing will only make this smaller. Schilling et al. (2008)
Saur et al. (1998) estimated that only 1/5 th of these cold ions reach the surface. So we have an interesting feedback process: cold ions create the exosphere but they also divert/slow plasma flow because they create the ionosphere. O 2 sputtering yield by O ions Cold ions hit with this energy, slowing flow will lower yield But how do we get enough O 2 to account for observations? 1026 s-1 is probably likely the upper limit (since it was calculated without diversion/slowing) Lower loss rates? Re-sputtering?
Conclusions With new O 2 sputtering yields (Teolis et al. , 2010) we have a clear idea of what species create Europa’s exosphere. We are now in a position to model a fascinating system: Plasma flux creates the exosphere and limits plasma flux. This interesting idea has not been adequately explored. But the modeling community is divided between people who • work on plasma (Kabin et al. , Schilling et al. , Lipatov et al. )** and assume static atmospheres & • people who work on atmospheres (Shematovich et al. , Cassidy et al. , Plainaki et al. , ) but assume static plasma. **Saur et al. (1998) is an exception
Extra slides
That’s the pattern of the dominant cold ions, but the energetic ions have much larger sputtering yields Helium Nitrogen Oxygen Sputtering Yield Hydrogen Total sputtering yield Blue: Fama (2008) Red: Johnson (2004, 2009) Sulfur Argon Ion Energy (e. V) Cassidy et al. , 2012
“Cold” ions (~100 e. V Maxwellian) “Hot”/non-thermal ions
Cumulative plot indicates that 100 ke. V to several Me. V ions do most sputtering “Cold” ions (~100 e. V Maxwellian) “Hot”/non-thermal ions Cold ion contribution: a slight bump to the cumulative sputtering rate.
The cumulative plot shows that it’s the cold ions Steep slope means that most of the sputtering takes place around 1 ke. V, the cold ion ram energy By comparison the hot ions only produce about 1/5 th that much O 2.